11email: katja.poppenhaeger@hs.uni-hamburg.de 22institutetext: Lowell Observatory, 1400 West Mars Hill Road, Flagstaff, AZ 86001, USA
51 Pegasi - a planet-bearing Maunder minimum candidate
We observed 51 Peg, the first detected planet-bearing star, in a 55 ks XMM-Newton pointing and in 5 ks pointings each with Chandra HRC-I and ACIS-S. The star has a very low count rate in the XMM observation, but is clearly visible in the Chandra images due to the detectors’ different sensitivity at low X-ray energies. This allows a temperature estimate for 51 Peg’s corona of T; the detected ACIS-S photons can be plausibly explained by emission lines of a very cool plasma near 200 eV. The constantly low X-ray surface flux and the flat-activity profile seen in optical Ca ii data suggest that 51 Peg is a Maunder minimum star; an activity enhancement due to a Hot Jupiter, as proposed by recent studies, seems to be absent. The star’s X-ray fluxes in different instruments are consistent with the exception of the HRC Imager, which might have a larger effective area below 200 eV than given in the calibration.
Key Words.:
Stars: coronae – Stars: activity – Stars: individual: 51 Peg – X-rays: stars – X-rays: individuals: 51 Peg1 Introduction
The star 51 Peg (GJ 882, HD 217014) shot to fame in 1995 when Mayor & Queloz (1995) detected an exoplanet in its orbit, the planetary parameters being quite unexpected at that time, because 51 Peg b is a giant planet, located at only 0.05 AU distance. The star itself is a G5V star 15.4 pc away from the Sun. Its properties are quite similar to the Sun’s, since 51 Peg is about 4 Gyr old and its mass, radius and effective temperature are comparable to solar values with (Baines et al., 2008), , (Fuhrmann et al., 1997). However, 51 Peg is a metal-rich star, for which the metallicities given in the literature vary over a wide range of , see for example Valenti & Fischer (2005). Enhanced metallicities are a common feature of stars with giant planets (Gonzalez, 1997; Santos et al., 2001).
The activity profile of 51 Peg turned out to be unspectacular. In the Mount Wilson program (Baliunas et al., 1995), which monitors the Ca ii H and K line fluxes of main sequence stars, the star shows a very low and nearly flat chromospheric activity level from 1977 until 1989 and a slight drop in 1990 and 1991. In the Lowell Observatory program (Hall et al., 2007), it also shows low activity and little variability in Ca fluxes since the beginning of the program in 1994. The star was also observed in a 12.5 ks ROSAT PSPC pointing in 1992 and detected as a weak X-ray source.
The coronal activity of 51 Peg is of interest not only because the star is similar to the Sun, but also with regard to recent studies (Kashyap et al., 2008), which claim stars with close-in giant planets to be more X-ray active than stars with far-out ones.
2 Observations and data analysis
We observed 51 Peg on two occasions in 2008. A 55 ks XMM-Newton was carried out on June 1, 2008, and with Chandra, we observed 51 Peg for 5 ks each using HRC-I and ACIS-S on December 6, 2008 immediately after each other. The specific observation details are listed in Table 1.
| Instrument | Configuration | ObsID | Obs. time | GTI (s) |
|---|---|---|---|---|
| XMM MOS1 | full frame / thick filter | 0551020901 | 2008-06-01 11:57:03 2008-06-02 03:17:50 | 55000 |
| XMM MOS2 | full frame / thick filter | 0551020901 | 2008-06-01 11:57:03 2008-06-02 03:17:55 | 55100 |
| XMM PN | full frame / thick filter | 0551020901 | 2008-06-01 13:09:38 2008-06-02 03:18:10 | 29000 |
| Chandra ACIS-S | back-illuminated | 10825 | 2008-12-06 11:03:26 2008-12-06 12:26:26 | 4980 |
| Chandra HRC-I | imaging | 10826 | 2008-12-06 12:44:54 2008-12-06 14:07:54 | 4924 |
2.1 XMM-Newton data analysis
The XMM-Newton data were reduced using the Science Analysis System (SAS) version 8.0.0. Standard selection criteria were applied for filtering the data. In the full-time image obtained with the PN detector, the automatic source detection procedure finds a faint X-ray source with 32 excess counts at 51 Peg’s nominal position when using the 0.2-1 keV energy band. This choice is motivated by 51 Peg being detected in the 1992 ROSAT PSPC pointing as a very soft X-ray source. Because of the weak signal, we merged both MOS detectors. In the RGS, no relevant signal was present. The PN observation is affected by proton contamination, therefore we used only time intervals (GTI) where the high-energy background averaged over the detector is below 0.8 cts/s, leading to a PN GTI of 29 ks.
Since spectral fitting results are not very reliable with this low number of counts, we conducted a study in different energy bands instead and investigated the recorded counts within the source region, a radius of 15 around 51 Peg’s nominal position for the PN and MOS instruments. The source region size of 15 radius was chosen because of the rather broad point spread function, which contains 72% (68%) of the photons from a point-like source in the PN (MOS) detector. Background counts were extracted from source-free nearby regions, which are located on the same chip for the MOS detector; for the PN detector, two background regions were chosen, one on the same chip as the source and one on a neighboring chip. Since 51 Peg proved to be a very soft X-ray source in the previous ROSAT observation, we expect most X-ray photons to be produced from the O vii triplet or lines with even lower energies, such as N vii/vi and C vi/v. We therefore specified three energy bands for our analysis, concentrating on a band around the O vii triplet ( eV); the detected photons are given in Table 2. Since the EPIC detectors have energy resolutions of FWHM100 eV, we adopted this as minimum bandwidth.
| Energy | PN | MOS1+2 | ACIS-S | HRC | ||||
| (keV) | s | b | s | b | s | b | s | b |
| 0.15-0.2 | … | … | … | … | 0 | … | … | |
| 0.2-0.45 | 9.1 | 4.9 | 0 | … | … | |||
| 0.45-0.65 | 3.5 | 3.2 | 0 | … | … | |||
| 0.65-2.0 | 10.4 | 23.2 | 0 | … | … | |||
| 0.15-2.0 | … | … | … | …. | … | … | 0.6 | |
In the source region we then count the number of photons recorded in the various energy bands and detectors, listed in column ”s” in Table 2. Source counts are given with confidence limits for low count numbers according to Kraft et al. (1991); for a detailed discussion, see Ayres (2004). The scaled background counts (denoted ”b”) were taken from areas much larger than the source region, and thus the error on the background is dominated by statistical fluctuations.
2.2 Chandra data analysis
For data reduction of the Chandra observations we used CIAO 4.1 (Fruscione et al., 2006) and applied standard selection criteria. The analysis of the data was performed in the 0.15 – 1 keV energy band since the back-illuminated ACIS-S chip has nonzero effective area at X-ray energies below 300 eV. For the HRC imager no energy cuts were used since its energy resolution is low. 51 Peg is clearly detected in both instruments.
In the ACIS observation we detect eight photons in the source region, a circle with 1.5 radius around 51 Peg’s nominal position. This radius was chosen to contain 95% of the soft (1 keV) photons from a point-like source. From nearby source-free regions in the 150 – 650 eV energy band we expect only 0.03 background counts for this area, therefore we attribute all of the recorded counts to 51 Peg. The spectral resolution of ACIS-S is similar to the one of the EPIC detectors ( 100 eV).
In the HRC-I pointing 21 photons were detected in the source region over a background of 0.6 photons scaled to the same area. At any rate, also the HRC clearly detects 51 Peg.
3 Results

3.1 XMM-Newton PN and MOS
51 Peg shows a photon excess in the 0.2 – 0.45 keV and the O vii band (0.45 – 0.65 keV) in PN and a very weak excess in the same bands in the merged MOS detectors. The MOS and PN lightcurves show no obvious variability over the whole 55 ks. As shown in Figure 1, most of PN’s excess source photons have energies around 300 eV; another emission feature is present around 570 eV, the energy of the O vii triplet. Because of XMM’s moderate intrinsic energy resolution the nominal energies of the detected source photons cannot be regarded as exact values. From the absence of emission features at O viii energies ( eV) we can conclude that 51 Peg’s corona has an average plasma temperature well below 3 MK.
3.2 Chandra ACIS-S and HRC-I
All the recorded counts have energies between 150 and 450 eV and are distributed quite evenly over the observation time, supporting a soft, basically constant X-ray source. Let us now inspect the energies of the ACIS-S photons in detail; the CIAO software assigns a nominal energy to each recorded photon (see Figure 1). The eight source photons have energies of 170, 206, 211, 212, 256, 227, 291 and 428 eV; they are hence very soft and obviously none of these photons can be attributed to O vii or even O viii emission. This supports our hypothesis of a very low plasma temperature evoked by the XMM data.
The ACIS-S detector is prone to optical contamination, so we have to check whether the extremely soft events could be induced by optical photons. The threshold for optical contamination in the ACIS-S detector is at for stars with an effective temperature between 5000 and 6500 K; a star this bright would cause a bias level shift of one Analog-to-Digital-Unit (ADU) of 3.4 eV during the standard 3.2 s time frame for the central pixel of the source. 51 Peg’s visual magnitude is 5.5, so we expect ca. 8 ADUs per time frame. Since the event threshold lies at 20 ADUs, optical contamination can be ruled out as explanation for the detected events.
Also in the HRC the recorded events are distributed evenly throughout the observation time. The intrinsic energy resolution of the HRC detector is low so that little information on the spectral energy distribution can be derived; because the HRC-I observation was carried out immediately after the ACIS-S observation, we assume that the 21 detected HRC-I source photons have similar energies as the photons in the ACIS-S detector.
| Instrument | Flux (0.1 – 1.0 keV) | (0.1 – 1.0 keV) |
|---|---|---|
| (erg s-1 cm-2) | (erg s-1) | |
| XMM PN | 26.3 – 26.8 | |
| XMM MOS1+2 | 26.1 – 26.8 | |
| Chandra ACIS-S | 26.5 – 26.8 | |
| Chandra HRC-I | 27.0 – 27.2 | |
| ROSAT PSPC | 26.7 – 26.8 |
3.3 Determination of coronal temperature
To estimate the coronal temperature, we evaluate the temperature-dependent hardness ratios of several energy bands, viz. with and covering 0.45 – 0.65 keV and 0.2 – 0.45 keV for PN; for ACIS-S, we use and with the energy bands : 0.25 – 0.45 keV, : 0.15 – 0.25 keV, : 0.45 – 0.65 keV and : 0.25 – 0.45 keV. The energy bands for ACIS-S were chosen to obtain quite an even distribution of source photons.
We derive the temperature-dependence of the hardness ratios with Xspec v12, using the instrument responses and effective areas as shown in Figure 1 and simulating spectra for a one-temperature thermal plasma model with solar abundance in the temperature range between and (see Figure 2). The possible plasma temperature of 51 Peg is then constrained by the observed hardness ratios for ACIS-S and PN. Assuming errors for low count numbers as defined in Table 2, we find that , and . The observed PN ratio yields the temperature limits . The ACIS-S ratios yield a lower temperature limit from and an upper limit from : , so that the likely temperature range for 51 Peg’s corona is .
Since there are virtually no background photons in ACIS-S, we can use the energies of the eight recorded source photons to validate our temperature constraints by identifying the most likely emission lines of their origin. Strong emission at temperatures near 1 MK comes from the Si and S emission line complexes around 200 eV, some strong Si lines around 230 eV, the C v triplet around 300 eV and the N vi triplet around 426 eV. These emission lines match well with the observed photons, which can be considered as a rough plausibility check. So, both the temperature constraints from hardness ratios and the identification of possible emission line complexes point to a plasma temperature of MK.


3.4 Comparison with ROSAT data
To investigate the long-term X-ray behavior of 51 Peg, we reanalyzed a 12.5 ks ROSAT PSPC observation from December 1992. Using the conversion factor with being the hardness ratio (S: 0.1 – 0.4 keV, H: 0.5 – 2.0 keV) (Schmitt, 1997), the luminosity derived from the observed count rate of 7 cts/ks is log. The observation is split in two parts, interrupted for ca. 70 ks. 51 Peg emits mainly soft X-ray photons below 500 eV () and showed a low and constant X-ray activity level without any obvious variability.
We can constrain the coronal temperature of 51 Peg in this observation in the same way as for the XMM and Chandra pointings. We use the temperature-dependent hardness ratio with the energy bands : 0.1 – 0.3 keV, : 0.3 – 0.65 keV. The observation yields from which lower and upper limits for the temperature can be derived, namely (see Figure 2). This again leads to a temperatur estimate of MK.
3.5 Consistency of measured count rates and fluxes
The observed count rates in XMM PN and MOS and Chandra ACIS-S are, considering the low photon numbers and therefore large statistical fluctuation, in reasonably good agreement. That ACIS-S detects no photons in the O vii band is no surprise given the shorter exposure in ACIS-S and its smaller effective area in that energy range (see Figure 1). At energies below 300 eV, we find that the PN and MOS counts numbers are smaller than expected from what we see in ACIS-S. This might be explained by statistical fluctuations, errors in the effective area determination or energy redistribution effects in the CCD detectors (EPIC ”low-energy shoulder”). Given these uncertainties for very low energies, we use only the O vii counts (0.45-0.65 keV) of PN and MOS for our flux calculations and then extrapolate the flux to a common energy range of 0.1 – 1 keV for comparison. For the other instruments, we use 0.65 keV as the upper bound of the energy range and their low-energy sensitivity limits as the lower bound (0.15 keV for ACIS-S/HRC, 0.1 keV for PSPC) and then extrapolate to the common energy range.
The fluxes normalized to the 0.1 – 1 keV energy band and the corresponding X-ray luminosities are consistent within errors except for the HRC-I flux, which seems to be larger. The count rate measured by the HRC instrument is higher by a factor of ca. 2.5 compared to the ACIS-S count rate. The nominal effective areas of the two instruments are very similar at low energies, with the HRC having somewhat larger effective area below 200 eV ( or 17% at 200 eV, 44% at 150 eV). The additional counts might arise from photons at these energies, but considering the small difference in effective areas, it does not seem likely that this is the case for all excess HRC photons. This mismatch is further validated by comparing ACIS-S and HRC count rates with WebPIMMS: assuming a thermal plasma with solar abundances and MK, 8 counts in the 0.15 – 0.65 keV energy band in ACIS-S translate into 9 expected counts in the same energy band in HRC-I, which is obviously inconsistent with the 21 recorded HRC photons only 15 minutes after the ACIS-S observation. The photon count estimate changes by if one assumes a plasma temperature of 0.8 or 1.25 MK, so a slightly different plasma temperature does not cure the substantial mismatch in the count rates.
Mismatches between HRC and XMM count rates have been reported before for Cen (Robrade et al., 2005; Ayres et al., 2008). This mismatch between almost simultaneous HRC and ACIS-S count rates can be explained reasonably by two possibilities: either the effective area of the HRC at low energies is underestimated in the current calibration or the effective areas of XMM MOS and PN (while using the thick filter) as well as Chandra ACIS-S are overestimated in that energy range. A detailed cross-calibration effort, preferably with a soft coronal source, could help to resolve any systematic errors in the effective areas of the instruments.
4 Discussion
4.1 Low activity - 51 Peg a Maunder minimum candidate?
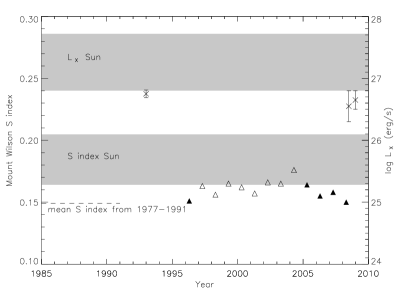
We found 51 Peg to be a rather constant, weak and soft X-ray source over the last 15 years. Another available long-term activity indicator is Ca ii. In the Ca ii H and K line flux monitoring programs carried out at the Mount Wilson and Lowell Observatories (Baliunas et al., 1995; Hall et al., 2007), 51 Peg was found to have a very low chromospheric activity level (, ). In Figure 3 we plot the star’s Mount Wilson S index measured since 1996 together with the average of older data. Clearly, the overall chromospheric activity is low, with some variations in the older set of data which is also seen in the more recent observations. Apart from one data point which is derived from a very small number of observations, 51 Peg’s S indices are at the lower end of or even below the Sun’s respective data during a solar minimum (data taken from Baliunas et al. (1995)). Other stellar properties like radius, mass, age and effective temperature are similar to the Sun’s respective parameters.
The steady low-activity behavior of 51 Peg’s Ca ii H and K line fluxes is also reflected by its X-ray properties. Compared to estimates for the solar X-ray luminosity in the ROSAT RASS band (0.1 – 2.4 keV) during a solar cycle (Judge et al., 2003), 51 Peg’s luminosity is also at the lower end of the Sun’s values. The ratio of the star’s X-ray to bolometric luminosity is also rather low with . The X-ray surface flux of F to M stars was shown to be constrained at the lower end by the surface flux level of a solar coronal hole; erg s-1 cm-2 for the ROSAT and Chandra energy band, which translates to erg s-1 cm-2 for XMM’s 0.2 – 12 keV band (Schmitt, 1997). 51 Peg’s surface flux, calculated from the ACIS-S data, is one of the lowest so far detected with erg s-1 cm-2; the coronal hole surface flux seems to be a good description of this star’s X-ray flux, with regards to the flux level as well as the plasma temperature.
There has been some discussion on how to identify a Maunder minimum (MM) star over the last years. The original criterion of chromospheric activity levels was derived by Henry et al. (1996), but relied on a stellar sample contaminated with evolved stars, which have significantly lower chromospheric activity levels compared to main sequence stars. Wright (2004) reanalyzed these data, excluding evolved stars with luminosities more than one magnitude larger than the Hipparcos average main sequence for the respective value, and found that most stars previously identified as MM candidates are evolved stars and therefore not comparable to the Sun’s Maunder minimum state. This led Judge & Saar (2007) to the question if the minimum level for main sequence stars to qualify as an MM candidate should be higher than , and also to consider flat-activity time profiles and UV- and X-ray data to identify MM candidates. A recent study by Hall et al. (2009) suggests that minimum levels of depend on stellar metallicity, with metal-poor stars from the examined sample having a higher minimal . In this picture, 51 Peg as a metal-rich star still has low chromospheric activity as measured by , but this alone does not necessarily qualify it to be a Maunder minimum candidate. However, as recent results show (Hall et al., 2007, 2009), the absolute magnetic excess flux seems to be a more reliable indicator for stellar activity than . In terms of this quantity, 51 Peg’s activity level is even lower compared to the quiescent Sun than indicated by or the S index, supporting our interpretation of 51 Peg as being extremely inactive.
The strongest line of evidence for 51 Peg being a Maunder minimum candidate is its flat activity profile as seen over decades in the Mount Wilson program (Baliunas et al., 1995) and in observations at Lowell Observatory (Hall et al., 2007), as well as the extremely low X-ray surface fluxes, which have not changed significantly since the 1992 ROSAT observations. That 51 Peg is a slow rotator with d (Baliunas et al., 1996; Mayor & Queloz, 1995) fits the picture, making 51 Peg the first MM candidate star with a close-in giant planet.
A statistical analysis of the X-ray luminosities of planet-bearing host stars has recently been conducted (Kashyap et al., 2008). Its authors claim that stars with close-in giant planet, such as 51 Peg, are on average X-ray brighter by a factor of two compared to stars with far away planets. Apparently, 51 Peg’s overall activity is not enhanced by the presence of its Hot Jupiter. However, at a distance of order of 50 only a weak interaction between an inactive star and its planet might be expected.
5 Conclusions
We have detected X-ray emission from 51 Peg in a 55 ks observation with XMM-Newton and 5 ks observations with Chandra ACIS-S and HRC-I each. The detection of 51 Peg with a low count rate in the XMM pointing and the clear source signal in the much shorter Chandra observations can be explained by the different effective response of the detectors at low energies and 51 Peg having an extremely cool corona. Our main results are summarized as follows:
-
1.
51 Peg shows weak emission in the O vii triplet and emission around 200 eV which can be explained most likely by cool silicon emission lines.
-
2.
A coronal temperature of MK is consistent with the detected hardness ratios in different energy bands in both the XMM and the Chandra pointing as well as in the ROSAT observation carried out 16 years earlier.
-
3.
The Chandra HRC-I count rate is higher than can be explained by differences in the effective areas of HRC and ACIS-S; HRC’s effective area might be larger at low energies than given in the calibration so far.
-
4.
The constant and very low surface X-ray flux level together with a flat-activity behavior in chromospheric Ca ii H and K line fluxes suggests 51 Peg to be a Hot Jupiter-bearing Maunder minimum candidate.
Acknowledgements.
K. P. and J. R. acknowledge financial support from DLR grants 50OR0703 and 50QR0803. J. C. H. acknowledges support from grant ATM-0742144 from the National Science Foundation. This work is based on observations obtained with XMM-Newton, Chandra and makes use of the ROSAT Data Archive. We acknowledge the allocation of Chandra Director’s Discretionary Time.References
- Ayres (2004) Ayres, T. R. 2004, ApJ, 608, 957
- Ayres et al. (2008) Ayres, T. R., Judge, P. G., Saar, S. H., & Schmitt, J. H. M. M. 2008, ApJ, 678, L121
- Baines et al. (2008) Baines, E. K., McAlister, H. A., ten Brummelaar, T. A., et al. 2008, ApJ, 680, 728
- Baliunas et al. (1996) Baliunas, S., Sokoloff, D., & Soon, W. 1996, ApJ, 457, L99+
- Baliunas et al. (1995) Baliunas, S. L., Donahue, R. A., Soon, W. H., et al. 1995, ApJ, 438, 269
- Fruscione et al. (2006) Fruscione, A., McDowell, J. C., Allen, G. E., et al. 2006, in Society of Photo-Optical Instrumentation Engineers (SPIE) Conference Series, Vol. 6270, Society of Photo-Optical Instrumentation Engineers (SPIE) Conference Series
- Fuhrmann et al. (1997) Fuhrmann, K., Pfeiffer, M. J., & Bernkopf, J. 1997, A&A, 326, 1081
- Gonzalez (1997) Gonzalez, G. 1997, MNRAS, 285, 403
- Hall et al. (2009) Hall, J. C., Henry, G. W., Lockwood, G. W., Skiff, B. A., & Saar, S. H. 2009, AJ, 138, 312
- Hall et al. (2007) Hall, J. C., Lockwood, G. W., & Skiff, B. A. 2007, AJ, 133, 862
- Henry et al. (1996) Henry, T. J., Soderblom, D. R., Donahue, R. A., & Baliunas, S. L. 1996, AJ, 111, 439
- Judge & Saar (2007) Judge, P. G. & Saar, S. H. 2007, ApJ, 663, 643
- Judge et al. (2003) Judge, P. G., Solomon, S. C., & Ayres, T. R. 2003, ApJ, 593, 534
- Kashyap et al. (2008) Kashyap, V. L., Drake, J. J., & Saar, S. H. 2008, ApJ, 687, 1339
- Kraft et al. (1991) Kraft, R. P., Burrows, D. N., & Nousek, J. A. 1991, ApJ, 374, 344
- Mayor & Queloz (1995) Mayor, M. & Queloz, D. 1995, Nature, 378, 355
- Robrade et al. (2005) Robrade, J., Schmitt, J. H. M. M., & Favata, F. 2005, A&A, 442, 315
- Santos et al. (2001) Santos, N. C., Israelian, G., & Mayor, M. 2001, A&A, 373, 1019
- Schmitt (1997) Schmitt, J. H. M. M. 1997, A&A, 318, 215
- Valenti & Fischer (2005) Valenti, J. A. & Fischer, D. A. 2005, ApJS, 159, 141
- Wright (2004) Wright, J. T. 2004, AJ, 128, 1273