Flows along cometary tails in the Helix planetary nebula NGC 7293
Abstract
Previous velocity images which reveal flows of ionized gas along the most prominent cometary tail (from Knot 38) in the Helix planetary nebula are compared with that taken at optical wavelengths with the Hubble Space Telescope and with an image in the emission from molecular hydrogen. The flows from the second most prominent tail from Knot 14 are also considered. The kinematics of the tail from the more complex Knot 32, shown here for the first time, also reveals an acceleration away from the central star. All of the tails are explained as accelerating ionized flows of ablated material driven by the previous, mildly supersonic, AGB wind from the central star. The longest tail of ionized gas, even though formed by this mechanism in a very clumpy medium, as revealed by the emission from molecular hydrogen, appears to be a coherent outflowing feature.
keywords:
Stars: circumstellar matter, ISM: planetary nebulae: individual: Helix nebula (NGC 7293)1 Introduction
Dense, neutral (Meaburn et al. 1992; Huggins et al. 1992) knots with ionized cometary tails are found in the central regions of planetary nebulae (PNe); the most famous being those in the Helix nebula for, at a distance of only 213 30/16 pc (Harris et al., 2007), they were easily detected and resolved by early ground–based observations (Baade and reported by Vorontsov–Velyaminov 1968). The incredibly clumpy nature of the neutral material in the disk of the Helix nebula (when modelled as a bi–polar PNe viewed along its axis, Meaburn et al. 1998; Meaburn et al. 2005) has now been revealed in spectacular fashion in the imagery in the H2 emission line by Matsuura et al. (2009). Previously, Meixner et al. (2005) had estimated that there were 23,000 cometary knots and that inevitably tail interactions must be occurring. Matsuura et al. (2009) show conclusively that it is an inner region in the Helix disk, towards the central star, where tails are observed from neutral globules surrounded by an outer clumpy region free of such tails.
Dyson (2003) reviewed the two broad models for the creation of the cometary tails; either they are shadowed from the ionizing radiation of the central star, and their surfaces photo-ionized by scattered Lyman photons in the nebula, or they are dynamically produced as the particle winds from the central star swept past the slowly expanding system of dense globules.
A critical distinction between these models arises if the cometary tails can be seen to be flowing along their lengths away from their parent globules. Only the ‘dynamic’ model would have this effect. In fact, a numerical simulation of the flow of a moderately supersonic particle wind past the ionized head of a globule (Dyson et al., 2006) predicted not only the creation of a cometary tail but a moderate acceleration of ionized material parallel to the tail surface and away from the globule. In this initial model the neutral material away from the globule had a smooth density distribution.
The most comprehensive optical study of the kinematics of the Helix system of globules remains that described in Meaburn et al. (1998). Here, spatially resolved [N ii] 6584 Å profiles, from 300 separate long-slit (163″ long) positions, were obtained with the Manchester echelle spectrometer (MES – Meaburn et al. 1984 but now with a CCD as the detector) on the Anglo–Australian telescope in exceptional ‘seeing’ conditions, over three separate ‘blocks’ of globules and their tails in the nebular core. Furthermore, a kinematical ‘case study’ of the globule which is apparently the 2nd closest to the nebular core (Knot 14), and a length of its tail, was carried out in a range of emission lines. The principal outcome was to show that the system of central globules is concentrated in a disk expanding itself at 14 km s-1. Flows parallel to the surfaces of the cometary tails of two of the most prominent globules (Knots 38 and 14) were also detected and even an acceleration of this flow along the length of the longest tail (from Knot 38) suggested. O’Dell, Henney & Ferland (2007) challenged these latter assertions without making any further kinematical observations but simply because they claim that more recent HST images reveal confusing minor globules in the longest tail (Knot 38). With the dismissal of these kinematical effects they proceeded to support the shadowing theories of the creation of the tails. The aim of the present paper is to reassess the strength of the deductions from the Meaburn et al. (1998) kinematical data set in the light of the subsequent HST and very latest H2 imagery by Matsuura et al. (2009). In particular, to consider if the evidence in Meaburn et al. (1998) for flows along the tail surfaces of Knots 38 and 14, away from the central star, is now invalidated by this HST imagery alone as suggested by O’Dell, Henney & Ferland (2007). Furthermore, the flow behind Knot 32, which was not considered hitherto, is now presented to strengthen the original suggestion that accelerating flows in the cometary tails could be ubiquitous though in a clumpy medium.
2 Knots 38 and 14
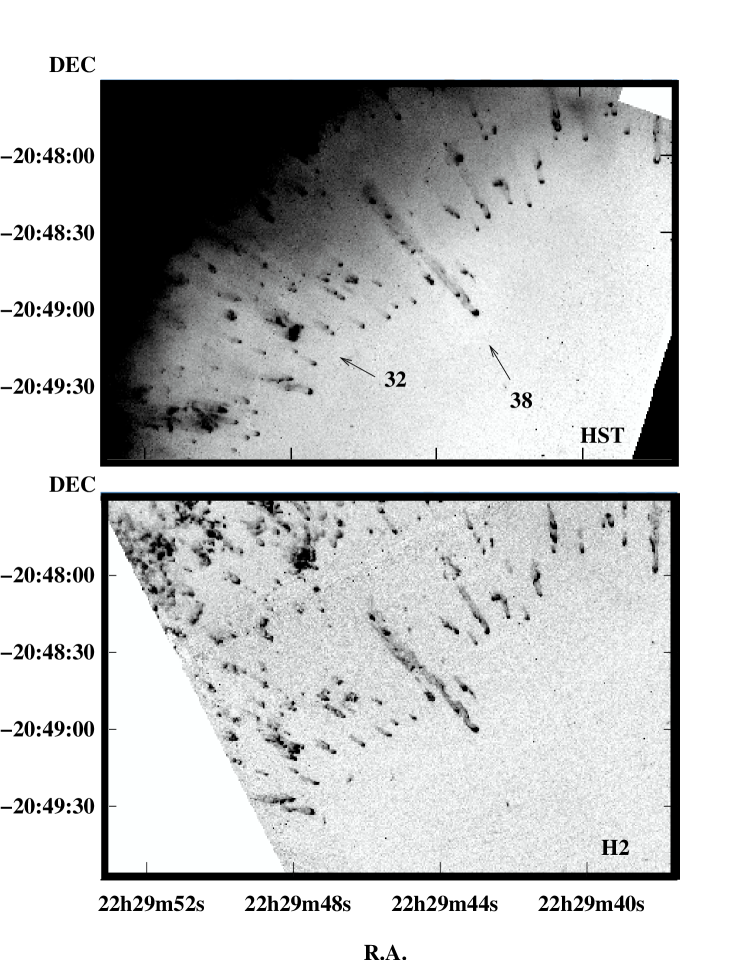
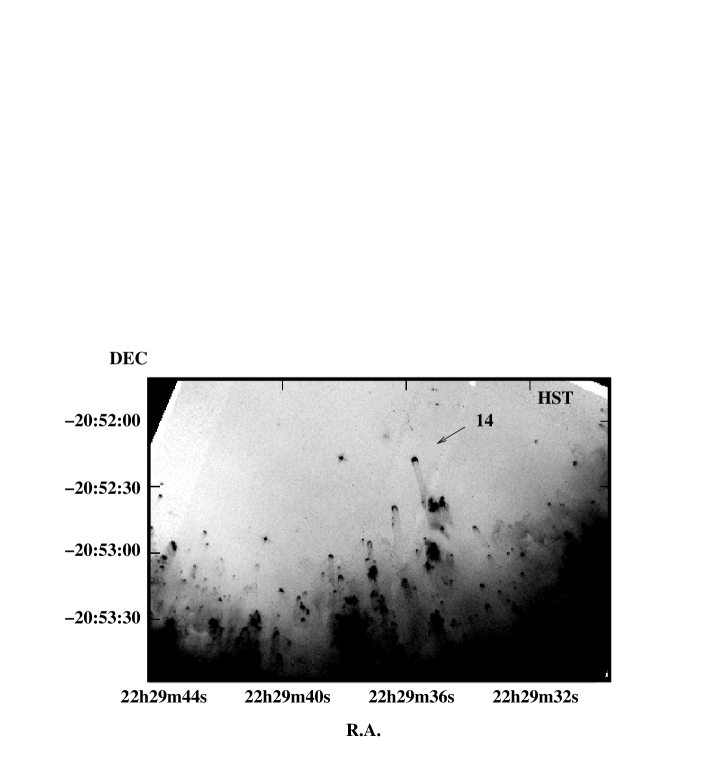
Knot 38 has the longest (62″) cometary tail and is the apparently closest knot to the central star of NGC 7293, while Knot 14 is the next closest. The heads of both have arcs of [O iii] 5007 Å emission facing this star which indicates that they protrude into the hard radiation field of the central volume of the bi–polar, ellipsoidally–shaped, nebula that produces the characteristic helical appearance in emission lines of lower ionization species (Meaburn et al. 1998; Meaburn et al. 2005). The HST archival images (PI NAME: Meixner, PID:9700) of Knots 38 (HST ACS/WFC J8KR14040) and 14 (HST ACS/WFC J8KR0840) are presented respectively in Figs. 1a and 2. These should be compared with those taken with the New Technology Telescope (NNT - Chile) and presented in Meaburn et al (1998). All are in the light of the H plus [N ii] 6548 & 6584 Å nebular emission lines.
The uniquely long ionized tail of Knot 38 in Fig. 1 is prominent in both the HST and former (Meaburn et al., 1998) NTT images and appears to be a coherent structure in both i.e. it is not simply a consequence of chance superposition of a large number of fore– or background tails along the same sightlines. Minor ionized knots appear along the tail in the image in Fig. 1a but it is the H2 2.12m image (Matsuura et al., 2009) shown in Fig. 1b that emphasises that the tail of ionized gas, being so long, is formed around an internal core composed of a large number of minor clumps of neutral material.
With this as a starting point the kinematics along this tail should be re–considered by examining the [N ii] 6584 Å line profiles presented in Meaburn et al. (1998). The centroids of these profiles are shown in fig. 13 of that paper to change along the 62″ length of this tail by a radial velocity difference (from central knot to tail end) by 10 km s-1. The velocity images in figs. 4 and 12 of the same paper confirm this systematic radial velocity change in a different way. Unfortunately, the four images in different heliocentric radial velocity () ranges became jumbled in the production of fig. 12 in the Meaburn et al. (1998) paper. These should be 31 to 27 (top right), 25 to 21 (top left), 20 to 15 (bottom right) and 14 to 10 (bottom left) and all km s-1. When these four images are considered with this correction it is clear that the head of Knot 38 appears alone in the top right frame then progressively the tail appears in the subsequent three frames towards more positive velocities as the image of the head declines. The acceleration along the tail length, if regarded as a coherent feature starting at Knot 38, is very clear and not dominated by the minor confusing knots apparent in Fig. 1a. Those areas free of these along the tail length of Knot 38 in Fig. 1 clearly show this radial velocity change. The appearance of the neutral material in the tail of Knot 38 and seen in Fig. 1b suggests that the ionized outflow is in a sheath around a clumpy neutral core.
Similarly, the [N ii] 6584 Å line profiles up to 5″ from the head of Knot 14 (fig. 9 of Meaburn et al. 1998) show a systematic change of radial velocity of their centroids of -6 km s-1. This was not covered by the H2 imagery of (Matsuura et al., 2009). The tail from Knot 14 was modelled kinematically as a flow parallel to the globule and tail surfaces. The HST images in Fig. 2 show that there are no significant minor ionized knots along this small length of the tail. Again an accelerating flow away from the central star is indicated. If tilted at 25∘ to the plane of the sky this change of outflow velocity amounts to 14 km s-1 compared to the apex of the head of the cometary knot.
3 Knot 32
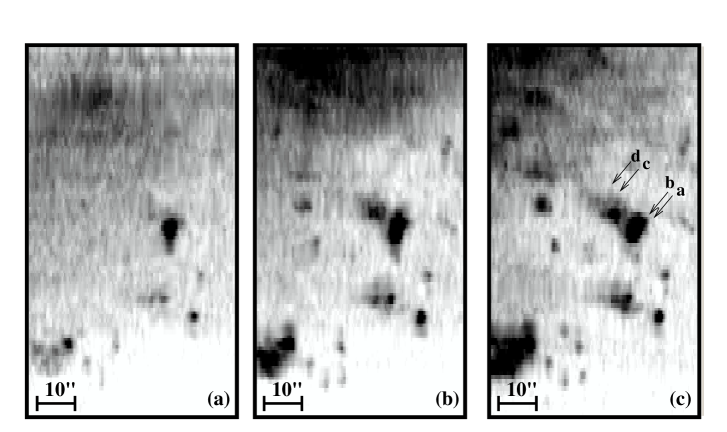
As shown in Figs. 1a & b Knot 32 has a more complex structure than that of both Knots 38 and 14. Again, a faint tail of diffuse ionized gas can be seen extending radially away from the central star though the central knot is composed of several neutral clumps. This tail of course could be an unrelated feature along the same sightline but its appearance suggests that this is unlikely. The kinematics of the Knot 32 tail have now been examined using the set of profiles of the [N ii] 6584 Å emission line from 100 longslit positions. These have an EW orientation and each is separated from its neighbour by 1″. The slit width is 6 km s-1 and 0.5″ on the sky. These observations and their analysis are described fully in Meaburn et al. (1998) and the reader is referred there for detailed information.
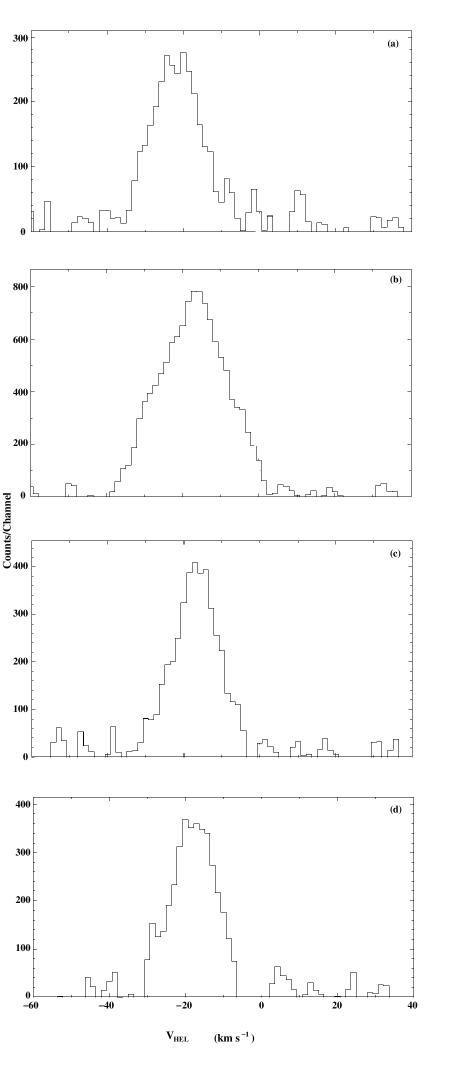
However, the [N ii] 6584 Å line profile from the very apex of this knot, facing the ionizing star, is shown in Fig. 3a and that of the knot head (1.5 ″ further from this star) in Fig. 3b. The [N ii] 6584 Å profiles from the faint material of the knot tail ( 14″ and 16″ away from the apex) are shown in Figs. 3c & d respectively. The positions where these line profiles were obtained are marked a–d in the velocity image in Fig. 4c. The [N ii] 6584 Å profiles from the host nebula have been subtracted in each case leaving only the profiles of the [N ii] 6584 Å emission from Knot 32 and its tail in those shown in Fig. 3a–d. This type of ‘velocity imagery’ is inevitably blurred in the NS dimension for the adjacent longslit spectra, each orientated EW, that are used to generate individual velocity images are separated by 1″ which is then convolved in the imagery with the angular slit width and the 0.8″ seeing disk. A distinct positive shift of around 8 km s-1 in radial velocity can be seen to be occurring between the apex of the knot and the material in the extended tail.
The ‘velocity’ images from the same data set in Figs. 4a–c show this radial velocity shift in a different way. The head of the knot alone appears in Fig. 4a ( 31 to 27 km s-1), the nearest part of the tail in Fig. 4b ( 24 to 21 km s-1) and the furthest extent of this tail in Fig. 4c ( 20 to 16 km s-1) all of which is consistent with the profiles shown in Fig. 3a–d.
4 Conclusions
The 62″ long tail from Knot 38 appears to be a coherent structure in the HST, NTT and the previous velocity imagery but formed around an extremely clumpy neutral medium as shown by the H2 imagery.
The evidence that there are accelerating flows along the walls of the tails of the two most prominent cometary globules in NGC 7293 (Knots 38 and 14), away from the central star, is not substantially affected by the higher resolution HST images or even the extremely clumpy nature of the neutral material revealed in the H2 imagery.
A similar flow away from the more complex Knot 32 is shown to be occurring for the first time in the present paper.
It is valid to attempt to explain flows along the cometary tails in the dynamical type of model in Dyson et al. (2006) but now modified to accommodate a very clumpy ambient medium similar to that in Pittard et al. (2005) which had been derived for more general clumpy phenomena.
It is becoming very clear (Matsuura et al., 2009) that the AGB particle wind overflowing the clumpy neutral structure of the disk of NGC 7293, at mildly supersonic velocity, can create and accelerate the cometary tails. Previously, Meaburn & White (1982) had shown that an inner quasi–spherical volume of material shielded the system of cometary knots from exposure to any subsequent fast stellar particle wind.
Acknowledgments
We would like to thank the referee for constructive comments that have improved the paper considerably. We also thank M. Matsuura who kindly provided their molecular hydrogen image of Helix in FITS format. The observations made with the NASA/ESA Hubble Space Telescope, obtained from the data archive at the Space Telescope Institute. STScI is operated by the association of Universities for Research in Astronomy, Inc. under the NASA contract NAS 5-26555.
References
- Dyson (2003) Dyson, J. E., 2003, Ap&SS, 285, 709.
- Dyson et al. (2006) Dyson, J. E., Pittard, J. M., Meaburn, J. & Falle, S. A. E. G., 2006, A&A, 457, 561.
- Harris et al. (2007) Harris, H.C., Dahn, C. & Canzian, B. et al., 2007, AJ, 133, 631.
- Huggins et al. (1992) Huggins, P. J., Bachiller, R., Cox, P. & Forveille, T., 1992, ApJ, 401, L43.
- Matsuura et al. (2009) Matsuura, M., Speck, A. K., McHunu, B. M., Tanaka, I., Wright, N. J., Smith, M. D., Zijlstra, A. A., Viti, S. & Wesson, R., 2009, ApJ, 700, 1067.
- Meaburn & White (1982) Meaburn, J. & White, N. J., 1982, ApSS, 82, 423.
- Meaburn et al. (1984) Meaburn, J., Blundell, B., Carling, R., Gregory, D. E., Keir, D. F. & Wynne C. G., 1984, MNRAS, 210, 463.
- Meaburn et al. (1992) Meaburn, J., Walsh, J. R., Clegg, R. E. S., Walton, N. A., Taylor, D. & Berry D. S., 1992, MNRAS, 255, 177.
- Meaburn et al. (1998) Meaburn, J., Clayton, C. A., Bryce, M., Walsh, J. R., Holloway, A. J. & Steffen, W., 1998, MNRAS, 294, 201.
- Meaburn et al. (2005) Meaburn, J., Boumis, P., López, J. A., Harman, D. J., Bryce, M., Redman, M. P. & Mavromatakis, F., 2005, MNRAS, 360, 963
- Meixner et al. (2005) Meixner, M., McCullough, P. R., Hartman, J., Minho, S. & Speck, A., 2005, AJ, 130, 1784.
- Pittard et al. (2005) Pittard, J. M., Dyson, J. E., Falle, A. E. G. & Hartquist, T. W., 2005, MNRAS, 361, 1077.
- O’Dell, Henney & Ferland (2007) O’Dell, C. R., Henney, W. J. & Ferland, G. J., 2007, AJ, 133, 2343.
- Vorontsov–Velyaminov (1968) Vorontsov–Velyaminov B. A., 1968, in Osterbrock D. E., O’Dell C. R., eds., Proc. IAU Symp. 34, Planetary Nebulae, Reidel, Dordrecht, p.256