Causal Links Between US Economic Sectors
Abstract
In this paper, we perform a comparative segmentation and clustering analysis of the time series for the ten Dow Jones US economic sector indices between 14 February 2000 and 31 August 2008. From the temporal distributions of clustered segments, we find that the US economy took one and a half years to recover from the mid-1998-to-mid-2003 financial crisis, but only two months to completely enter the present financial crisis. We also find the oil & gas and basic materials sectors leading the recovery from the previous financial crisis, while the consumer goods and utilities sectors led the descent into the present financial crisis. On a macroscopic level, we find sectors going earlier into a crisis emerge later from it, whereas sectors going later into the crisis emerge earlier. On the mesoscopic level, we find leading sectors experiencing stronger and longer volatility shocks, while trailing sectors experience weaker and shorter volatility shocks. In our shock-by-shock causal-link analysis, we also find shorter delays between corresponding shocks in more closely related economic sectors. In addition, our analysis reveals evidences for complex sectorial structures, as well as nonlinear amplification in the propagating volatility shocks. From a perspective relevant to public policy, our study suggests an endogeneous sectorial dynamics during the mid-2003 economic recovery, in contrast to strong exogeneous driving by Federal Reserve interest rate cuts during the mid-2007 onset. Most interestingly, we find for the sequence of closely spaced interest rate cuts instituted in 2007/2008, the first few cuts effectively lowered market volatilities, while the next few cuts counter-effectively increased market volatilities. Subsequent cuts evoked little response from the market.
keywords:
US economic sectors , macroeconomic cycle , segmentation , clustering , causal linksPACS:
05.45.Tp , 89.65.Gh , 89.75.Fb1 Introduction
In a recent paper [1], we reported finding the US economy to be predominantly in a low-volatility phase (which corresponds roughly to the standard economic growth phase) and a high-volatility phase (which has a significantly longer duration than the economic contraction phase it incorporates), when we perform statistical segmentation and clustering analysis on the Dow Jones Industrial Average time series between 1997 and 2008. Both phases are interrupted by moderate-volatility market correction phases, which come with two typical durations: 1–2 weeks, and 1.5–2 months. The high-volatility phase is also frequently interrupted by very-high-volatility market crash phases, which can go from 1 day to 3 weeks in duration. More interestingly, the temporal distribution of the clustered segments suggests that the US economy made a transition from the low-volatility phase to the high-volatility phase in mid-1998 (apparently triggered by the July 1997 Asian Financial Crisis), went back into the low-volatility phase in mid-2003, before entering the high-volatility phase again in mid-2007 (the current global financial crisis, apparently triggered by market corrections in the Chinese markets that started in mid-2006).
Having extracted such a rich and exciting story of the US economy through segmentation and clustering analysis of a single index time series, we naturally wondered what we would find if we do a comparative study of the clustered segments for time series data from the various US economic sectors. In particular, we were inclined to believe that such a comparative analysis offers the potential to understand causal relationships between different components of the US economy. Thus far, many fingers point (with hindsight) to the complex, poorly managed, poorly regulated interactions between the US property and financials sectors as the root cause of the present financial crisis. However, this stating of what is apparent on the surface — less an understanding of the concomitant subtleties beneath the surface — may not be enough to help us prevent the next financial crisis, nor is it likely to show us how to develop effective mitigation measures should one arise. If we fully comprehend the causal linkages between the various economic sectors, we imagine it would be possible to devise flexible and effective policies that would target key industries and sectors to accelerate recovery from a financial crisis, or to soften the impact (or avert altogether) the onset of a financial crisis.
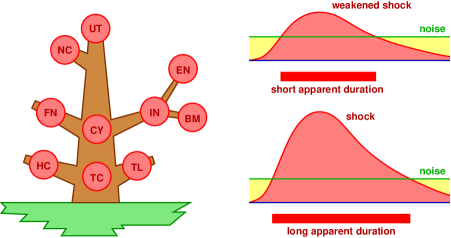
In this paper, we report intriguing results that emerge from our segmentation and clustering analysis of the ten Dow Jones US economic sector time series. The varying temporal distributions of clustered segments tells us that the last US financial crisis was led to a large extent by the technologies sector, while the present global financial crisis was led by the non-cyclical consumer goods (within which we find the homebuilders and realties) and utilities sectors. Moreover, we found what we believe might be a generic pattern: the sector that led the economy into decline recovers last, while the last sector to succumb to the financial crisis is also the first to recover when the economy ‘picks up’. Other robust statistical signatures extracted include the leading sectors experiencing stronger and longer high-volatility shocks, while the trailing sectors experience weaker and shorter high-volatility shocks. These observations are consistent with the causal tree analogy shown in Fig. 1. In this analogy, exogeneous factors shake the root of the tree, and branches closest to the root are the first to respond. As the influence of the exogeneous shock propagates up the tree, the amplitudes of the shocks experienced by the sectors decrease in strength. Another natural implication of this analogy is that the delay between successive sectors will be shorter if they are more closely related. Because of its apparent utility, we will interpret our results within the framework of this analogy.
To facilitate easy navigation of our methods and results, this paper is organized into six sections. In Section 2, we briefly describe the data sets used, as well as the segmentation and clustering procedures. In Section 3, we describe general features observed in the ten temporal distributions of clustered segments, how we determine the sequence of recovery in the US economic sectors, as well as the sequence leading into the current global financial crisis. In Section 4, we discuss an in-depth shock-by-shock causal-link analysis of the dynamics of the ten US economic sectors, in the period leading up to full economic recovery, as well as the start of the Subprime Crisis. In Section 5, we present results on the present financial crisis, showing how the economy responded positively to the first few interest rate cuts, negatively to the next few rate cuts, and then not at all to subsequent rate cuts. This suggests that the Federal Reserve interest rate is not a universal knob that can be continuously adjusted to fine tune the economy, but can be good medicine if used sparingly. Finally, we present our conclusions in Section 6.
2 Data and methods
2.1 Data
Tic-by-tic data for the ten Dow Jones US economic sector indices (see Table 1) over the period 14 February 2000 to 31 August 2008 were downloaded from the Taqtic database [2]. There are about three million tic-by-tic records for each index, and the format of this raw data is shown in Table 2. These were processed into half-hourly time series , where index the various economic sectors according to Table 1, and indicate which half-hour within the period of study the indices are sampled. For example, in Table 2 we see for BM that there was a transaction on February 14, 2000 at 14:25:50.259 GMT, at index value 149.92. The next transaction was on February 14, 2000 at 14:30:29.829 GMT, at index value 149.93. Therefore, we take the index value for BM on February 14, 2000 at 14:30:00 GMT, which is the opening time of the New York Stock Exchange (NYSE), to be 149.92, i.e. the index value of the last transaction before 14:30:00 GMT. Similarly, the half-hourly index values for 15:00:00 GMT, 15:30:00 GMT, …, 20:30:00 GMT, up till the closing time 21:00:00 GMT of the NYSE, are taken to be the index values of the last transactions before these half hours. In the raw data, we also see records of transactions several minutes after the closing time, and once in a while, we will see transactions an hour to two hours before the opening time. Records before the opening time are corrections made by the NYSE. These are not real transactions so we ignore such entries. Records after the closing time are real transactions, with index values that can be about 0.1% different from that of the last transaction before the official closing time. This last-minute rush in stock markets is well known. We also ignore these records, because their index values will generally be very close to the index values we assign to the opening hours. Finally, the list of half hours is also adjusted to take into account daylight saving. In the end, we obtained from the tic-by-tic records index values for 31560 half hours for each economic sector.
| symbol | sector | number of component stocks | float-adjusted market capitalization (billion USD) | number of tic-by-tic records | |
|---|---|---|---|---|---|
| 1 | BM | Basic Materials | 155 | 506.7 | 2,843,033 |
| 2 | CY | Consumer Services | 484 | 1,649.1 | 2,937,192 |
| 3 | EN | Oil & Gas | 214 | 1,405.7 | 3,109,893 |
| 4 | FN | Financials | 876 | 2,192.5 | 3,086,616 |
| 5 | HC | Healthcare | 512 | 1,423.8 | 3,009,245 |
| 6 | IN | Industrials | 692 | 1,725.7 | 2,939,937 |
| 7 | NC | Consumer Goods | 326 | 1,351.1 | 2,889,067 |
| 8 | TC | Technology | 509 | 2,158.1 | 3,222,199 |
| 9 | TL | Telecommunications | 44 | 379.5 | 2,908,507 |
| 10 | UT | Utilities | 96 | 470.9 | 2,445,898 |
#RIC,Date[G],Time[G],GMT Offset,Type,Price .DJUSBM,02/14/2000,11:54:20.434,+0,Index,149.92 .DJUSBM,02/14/2000,14:25:50.259,+0,Index,149.92 .DJUSBM,02/14/2000,14:30:29.829,+0,Index,149.93 .DJUSBM,02/14/2000,14:30:57.532,+0,Index,149.92 .DJUSBM,02/14/2000,14:31:28.710,+0,Index,149.93 .DJUSBM,02/14/2000,14:31:57.861,+0,Index,149.94 .DJUSBM,02/14/2000,14:32:15.252,+0,Index,149.93 .DJUSBM,02/14/2000,14:32:36.853,+0,Index,149.94 .DJUSBM,02/14/2000,14:32:59.533,+0,Index,149.95 .DJUSBM,02/14/2000,14:33:13.906,+0,Index,149.98 .DJUSBM,02/14/2000,14:33:30.941,+0,Index,149.97 .DJUSBM,02/14/2000,14:33:43.577,+0,Index,149.98 .DJUSBM,02/14/2000,14:33:58.916,+0,Index,150.02 .DJUSBM,02/14/2000,14:34:13.525,+0,Index,150.05 .DJUSBM,02/14/2000,14:34:30.817,+0,Index,150.15 .DJUSBM,02/14/2000,14:34:43.452,+0,Index,150.16 .DJUSBM,02/14/2000,14:34:58.883,+0,Index,150.33 .DJUSBM,02/14/2000,14:35:13.972,+0,Index,150.34 .DJUSBM,02/14/2000,14:35:31.265,+0,Index,150.39 .DJUSBM,02/14/2000,14:35:45.639,+0,Index,150.29 .DJUSBM,02/14/2000,14:36:02.616,+0,Index,150.38 .DJUSBM,02/14/2000,14:36:20.902,+0,Index,150.41 .DJUSBM,02/14/2000,14:36:40.442,+0,Index,150.32 .DJUSBM,02/14/2000,14:36:49.013,+0,Index,150.22 .DJUSBM,02/14/2000,14:36:59.389,+0,Index,150.19
As explained in Ref. [1], the half-hourly data frequency allows us to confidently identify statistically stationary segments as short as a day. Higher data frequency was not used, because in a macroeconomic study such as this, we are not interested in segments shorter than a day. From the index time series , we prepare the log-index movement time series , where , for segmentation based on the log-normal index movement model described in Ref. [1]. The log-index movement model was chosen because different indices have different magnitudes, and it is more meaningful to compare their fractional changes.
2.2 Segmentation
Sudden changes in the dynamics of an economy are variously known as regime shifts, structural breaks, or change points. The problem of detecting change points (see for example, Refs. [3, 4] is also important in the fields of image segmentation (see for example, Refs. [5, 6] and biological sequence segmentation (see for example, Refs. [7, 8]). In the economics and econometrics literature, Quandt first considered the problem theoretically in 1958 [9, 10], developing least square estimation procedures used by Huizinga and Mishkin in their study of regime shifts in US monetary policy [11]. After putting forth a likelihood test on regime switching in 1972 [12], Quandt, along with Goldfeld, developed in 1973 a Markov switching framework for estimating regime shifts, and applied it to detect regime shifts in the US housing market [13]. This Markov switching framework formed the basis of Hamilton’s seminal 1989 paper on the US business cycles [14, 15]. There is now a large and growing economics and econometrics literature on regime shifts and change points. Most of these works are based on autoregressive models and unit-root tests [16, 17, 18, 19, 20, 21, 22, 23, 24, 25, 26, 27, 28, 29, 30, 31, 32], and only a small number are based on Hamilton’s Bayesian approach [33].
In the finance literature, Merton noticed as early as 1976 that stock returns frequently exhibit discontinuous jumps [34, 35], and extended the Black-Scholes option pricing framework by incorporating a Poisson jump process in addition to the standard lognormal returns process. Ball and Torous later compared the Black-Scholes-Merton pricing formula to the actual time series of derivatives, and found only slight mispricing [36, 37]. Jorion, on the other hand, found that jumps in the foreign exchange market are structurally different from jumps in the stock market [38]. In 1986, Poterba and Summers also noticed persistent changes in the returns variance frequently accompanied large jumps in the returns [39]. Lamoureux and Lastrapes later associated this persistence of variance with a structural change in the market [40]. In general, financial economists are less interested in locating and explaining change points, and more interested in incorporating the existence of these temporal features into the prices of derivative instruments.
In contrast to the economics and finance communities, the data mining communities are very much interested in employing pattern recognition tools to make predictions. In pattern-based segmentation schemes, features within the time series are abstracted into symbols, along the same spirit as the technical analysis of stock markets [41]. The time series is then segmented either based on the relative abundance of symbols, or their context trees [42, 43, 44, 45]. The focus of the younger econophysics community is again different. Here, the economy and financial market are seen as complex systems obeying emergent laws of self organization, and econophysicists attempt to discover these laws, through studying simple models with the essential dynamical features, as well as by analyzing high-frequency market data. In the time series segmentation works by Vaglica et al. [46] and Tóth et al. [47], the aim is to discover scaling laws governing financial markets, whereas in our previous work [1], we are concerned with what macroeconomic phases are manifest in a financial market, and what time scales are associated with the transition from one macroeconomic phase to another.
In this paper, we would like to learn more about the dynamics of the US economy, by segmenting the time series of the ten Dow Jones US economic sector indices. To do this, we assume that each economic sector time series consist of segments, and that within segment , the log-index movements are normally distributed, with constant mean and constant variance . The unknown segment boundaries , which separates segments and , are determined through time series segmentation, using the recursive entropic scheme introduced by Bernaola-Galván et al. [48, 49]. In this segmentation scheme, we start with the time series , and compute the Jensen-Shannon divergence [50]
| (1) |
where within the log-normal index movement model,
| (2) |
is the likelihood that is generated probabilistically by a single Gaussian model with mean and variance , and
| (3) |
is the likelihood that is generated by two statistically distinct models: the left segment by a Gaussian model with mean and variance , and the right segment by a Gaussian model with mean and variance . In terms of the maximum likelihood estimates and , the Jensen-Shannon divergence , which measures how much better a two-segment model fits the time series data compared to a one-segment model, simplifies to
| (4) |

We then scan through all possible times , as shown in Fig. 2(a), and place a cut at , for which the Jensen-Shannon divergence
| (5) |
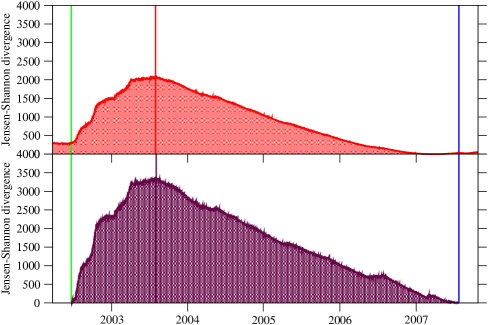
is maximized, to break the time series into two statistically most distinct segments and . In Fig. 2, the half-hourly time series shown is that of the Dow Jones Industrial Average between January 1, 1997 and August 31, 2008. The first segment boundary identified by this one-to-two segmentation procedure is at mid-2003, since this is where peaks, when it is computed over the entire time series. The Jensen-Shannon divergence value associated with this peak is . Recalling that , this means that at this point in time, the two-segment likelihood is larger than the one-segment likelihood. Therefore, when benchmarked against the model of one stationary segment for the entire time series, we know that the left segment from January 1997 to mid-2003 is statistically very dissimilar to the right segment from mid-2003 to August 2008. Given such a large disparity between the one-segment and two-segment likelihoods, it is clear that the mid-2003 segment boundary is highly significant statistically. When we use Eq. (11) calculate the maximum error that could arise in the Jensen-Shannon divergence of the whole time series, which has 31560 points, we find . This also suggests that the mid-2003 segment boundary, with , is statistically highly significant. In fact, this time point corresponds to the start of the four-year growth phase of the US economy from mid-2003 to mid-2007.
To apply this one-into-two segmentation scheme recursively to obtain shorter and shorter segments, we compute separately for and , as shown in Fig. 2(b). For , we find the optimum segment boundary to be at mid-2002, whereas for , the optimum segment boundary is at mid-2007. After this second stage segmentation, we now have four segments, separated by two new and one old segment boundary. The two new segment boundaries have (mid-2002, with ) and (mid-2007, with ) respectively. Both are thus less significant than the first segment boundary discovered by the segmentation procedure. However, they remain highly significant statistically. In fact, corresponds to the mid-2002 Dow Jones low, and corresponds to the July 2007 start of the Subprime Crisis. Before we move on to the third stage of the recursive segmentation, we need to ensure that the position of remains optimum. This is necessary, because was initially identified using computed the entire time series. But now that we know the positions of and , we should compute over the interval only to locate . When we do this, the optimum position for must be shifted slightly to , as shown in Fig. 3. Since has been moved, we must also check the optimalities of and , by computing over the intervals and . At each stage of the recursive segmentation, this first-order optimization [51] must be done iteratively for all segment boundaries, until they have all converged onto their optimum positions.
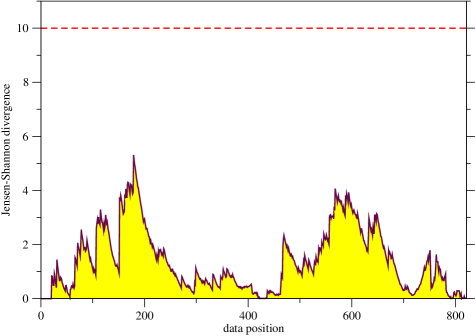
From Fig. 3, we also see that obtained over the interval is actually larger than obtained over the entire time series. This is in spite of the maximum error in computing the Jensen-Shannon divergence falling from over the whole time series, to over . Therefore, and are smaller than not because they are computed over shorter segments, but because the segment boundaries and are in fact statistically less significant than the segment boundary . Nevertheless, as the optimized recursive segmentation progresses, all the highly significant segment boundaries would have been discovered, and we start discovering less and less significant segment boundaries. When this happens, the Jensen-Shannon divergence of the newly discovered segment boundaries will become smaller and smaller. When starts looking like that shown in Fig. 4, we can no longer identify any statistically significant boundary within the segment. Such segments should therefore not be segmented any further.
At this point, we find it necessary to address the important question of how we decide whether a time series is statistically stationary or nonstationary. In the statistics and econometrics literatures, a time series that fails a unit-root test when it is fitted to an autoregressive model can plausibly be regarded as statistically nonstationary. However, in its most general terms this question is not well posed: no matter how nonstationary a given time series looks, it can always be fitted to a stationary stochastic process. Similarly, it is also possible for a stationary model to produce a seemingly nonstationary time series, or for a nonstationary model to produce a seemingly stationary time series. A stationary model is the simplest model for any given time series. However, if the likelihood for observing the given time series is very low, then it is not better than a more complex nonstationary model which reproduces the given time series with much higher likelihood. Therefore, the more meaningful question to ask is if a given time series can be more profitably modeled by a stationary model or by a nonstationary model. Based on our discussions above, the answer to this model selection problem is very clear in the initial stages of the recursive segmentation, when the two-segment likelihoods are so much larger than the one-segment likelihoods. More importantly, the peak Jensen-Shannon divergence is also very much larger than the amplitude of the point-to-point fluctuations in across the time series.
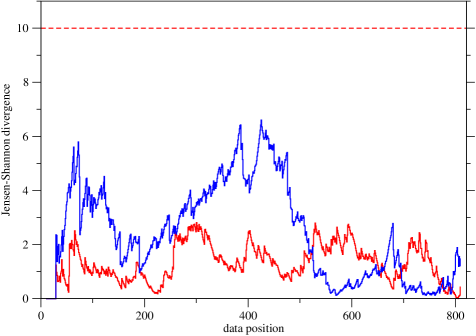
At the late stages of recursive segmentation, most plots of look like that shown in Fig. 4. The peak is now small, and not that much larger than the point-to-point fluctuations in . Discounting structures seen in the larger-scale fluctuations, now resembles those of artificial time series (shown in Fig. 5) generated by stationary Gaussian processes. The segment shown in this example should therefore not be further segmented. As far as we are aware of, there are three statistical frameworks for terminating the recursive segmentation in the literature. In the original approach by Bernaola-Galván and coworkers [48, 49], the divergence maximum of a new segment boundary is tested for statistical significance against a distribution whose degree of freedom depends on the length of the segment to be subdivided. Recursive segmentation terminates when no new segment boundaries more significant than the chosen confidence level can be found. In the second approach [52, 53], a segment is subdivided if the information criterion of its best two-segment model exceeds that of its one-segment model. Recursive segmentation terminates when further segmentation does not explain the data better. In the third approach [51], we compare the Jensen-Shannon divergence against a coarse-grained divergence of the segment to be subdivided, to compute the total strength of point-to-point fluctuations in . Recursive segmentation terminates when the area under falls below the desired signal-to-noise ratio.
All the most statistically significant segment boundaries will be discovered by recursive segmentation using any of the three termination criteria. Based on the experience in our previous work [1], these most statistically significant segment boundaries are also discovered if we terminate the recursive segmentation when no new optimized segment boundaries with Jensen-Shannon divergence greater than a cutoff of are found. This choice of cutoff is consistent with the standard errors calculated using Eq. (10) and the eventual sizes of the segments, although it sometimes result in long segments whose internal segment structures are masked by their context [54]. For these long segments, we progressively lower the cutoff until a segment boundary with strength appears. The final segmentation then consists of segment boundaries discovered through the automated recursive segmentation, as well as segment boundaries discovered through progressive refinement of overly long segments.
Before we move on to describe how segments are grouped into a small number of classes based on their statistical similarities, let us also discuss how the segmentation procedure will perform if the volatility consists not only of a deterministic part , but also receives contribution from a stochastic part . For our segmentation procedure to work, and must change abruptly from one segment to the next. Here, is a deterministic parameter, and is a stochastic variable drawn from any standard distribution. Whether it is , , or both, that is undergoing a sudden transition, this change point will be detected if it is statistically significant (and thus likely to be economically meaningful). In this sense, we do not need to specifically worry about any stochastic contributions to the segment volatilities.
2.3 Clustering
After the time series segmentation is completed, we end up with between 100 and 150 segments for each economic sector index. For each time series, a segment is statistically distinct from the segment before it as well as the segment after it. However, distant segments can be statistically similar to each other. In this way, we expect the large number of segments may actually represent a smaller number of segment types or classes. This was the case when Azad et al. segmented the human chromosome 22, and found that the 248 segments can be classified into 53 segment types [55]. In fact, there is good reason to believe that the time series segments we obtained can actually be organized into a small number of classes, each representing a macroeconomic phase.
The procedure of assigning a large number of objects into a smaller number of collections, such that within each collection, the objects are more similar to each other than they are with objects from another collection, is known as clustering or classification (see for example, the books by Mirkin [56] and by Halgamuge and Wang [57], or the review by Jain [58]). Clustering algorithms can be broadly classified as partitional or hierarchical. In the -means algorithm [59, 60], which is the representative algorithm for partitional clustering, we decide beforehand that there are clusters, and assign each data point to a cluster, such that the sum of square deviations to the means is minimized by varying the centers of the clusters as well as the cluster assignment. In single linkage clustering [61, 62], by far the most popular hierarchical clustering algorithm, small clusters are progressively merged into larger clusters, by first merging clusters that are closest together. In this clustering algorithm, the ‘distance’ between two clusters is given by the smallest ‘distance’ between their constituents.
Clustering of different periods within a financial time series has been previously investigated by van Wijk et al. [63] and Fu et al [64], with the goal of discovering patterns that can be used for doing prediction. In this paper, we perform hierarchical agglomerative clustering of the time series segments to organize them into different macroeconomic phases. We do this for each US economic sector index independently, because the same macroeconomic phase may exhibit different statistical characteristics in different indices. Also, as we are interested in discovering macroeconomic phases, we use the complete link algorithm [65], favored by social scientists for producing compact clusters with the maximum internal homogenuity. We do not use the single link algorithm, which is more meaningful in the biological sciences because it corresponds more closely with the nature of evolutionary changes, since it tends to produce loose and elongated clusters [66].
There are many ways to extract clusters from a hierarchical clustering tree. For example, in the hierachical clustering tree of time series segments of the Dow Jones Industrial Average shown in Fig. 6, we can group the segments into two clusters, if we choose the threshold statistical distance, measured by the Jensen-Shannon divergence between segments, to be , or three clusters, if we choose the threshold statistical distance to be . We can also group the segments into six clusters (different from the ones identified by colors), if we choose the threshold statistical distance to be . However, unlike time series segmentation, the statistical criterion for a meaningful clustering is not significance, but robustness. A robust cluster is one whose composition does not change over a broad range of threshold statistical distances. At a higher level, a robust clustering is one in which the number of clusters does not change over a broad range of threshold statistical distances. Once we understand this different statistical concern, we can even work with different thresholds for different clusters. In Fig. 6, we make use of this flexibility to identify the six colored clusters for the Dow Jones Industrial Average.

In the same way, we analyzed the hierarchical complete-link clustering trees obtained for the ten US economic sector indices, and selected between four to six coarse-grained clusters for each index. In general, we choose to work with between four and six clusters, instead of fewer or more, because we want to map the clusters to the four macroeconomic phases, growth, crisis, correction, and crash, identified by economists. This mapping between clusters and macroeconomic phases, as well as the color scheme used in all the time series plots in this paper, is shown in Table 3. We have shown in Ref. [1] that this association between clusters and macroeconomic phases is reasonable, by correctly identifying the start and end of crises and growths of the US economy from 1997 to 2008. In this paper, we hope that similar analysis based on the temporal distributions of clustered segments for the ten US economic sectors, presented in Sections 3, 4, and 5, will shed more light on the sectorial dynamics within the US economy.
| volatility | extremely low | low | moderate | high | very high | extremely high |
|---|---|---|---|---|---|---|
| color | black | blue | green | yellow | orange | red |
| phase | growth | correction | crisis | crash | ||
| BM | - | 0.0016 | 0.0037 | 0.0046 | 0.0069 | 0.0146 |
| CY | 0.0005 | 0.0015 | 0.0023 | 0.0031 | 0.0053 | 0.0121 |
| EN | 0.0010 | 0.0014 | 0.0027 | 0.0037 | 0.0058 | 0.0152 |
| FN | 0.0007 | 0.0016 | 0.0024 | 0.0039 | 0.0058 | 0.0134 |
| HC | - | 0.0006 | 0.0016 | 0.0023 | 0.0041 | 0.0076 |
| IN | - | 0.0013 | 0.0022 | 0.0035 | 0.0056 | 0.0140 |
| NC | - | 0.0009 | 0.0015 | 0.0022 | 0.0034 | 0.0085 |
| TC | - | 0.0019 | 0.0030 | 0.0042 | 0.0082 | 0.0121 |
| TL | - | 0.0008 | 0.0018 | 0.0024 | 0.0033 | 0.0078 |
| UT | - | 0.0014 | 0.0023 | 0.0030 | 0.0038 | 0.0088 |
3 Temporal distributions of clustered segments: general features
As expected, the time series of different economic sectors exhibit different temporal distributions of clustered segments (see Appendix B for complete listings of time series segments found for the ten DJUS indices). However, based on the distributions of high-volatility segments (which are dominant during financial crises) and low-volatility segments (which are dominant during the economic expansion phase), we see that all economic sectors went into the high-volatility phase during the previous financial crisis, reverted to the low-volatility phase, and then entered the high-volatility phase again during the present global financial crisis. Our main interest lies in whether we can draw meaningful inferences on the causal relationships between the various US economic sectors, by studying these consistent time series features that emerge during recovery from the previous financial crisis, and the onset of the present financial crisis.
3.1 Recovery from mid-1998 to mid-2003 financial crisis
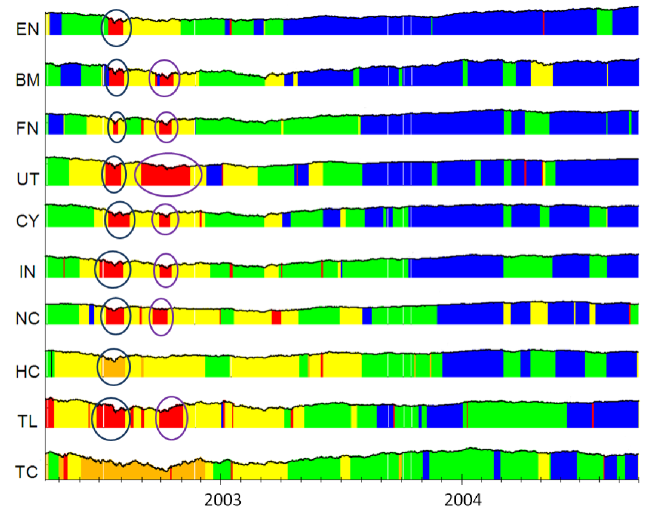
For any given US economic sector, its time series segment boundaries are not equally significant. Some segment boundaries have large , and are thus highly significant statistically. Other segment boundaries have just above our cutoff of , and are thus less significant statistically. When we cluster these time series segments, we not only group temporally distant segments which are statistically similar, we also group adjacent segments separated by statistically weaker boundaries. In our temporal distribution of clustered segments plot, adjacent segments assigned to the same cluster will be mapped to the same color. Conversely, adjacent segments which are colored differently must have been assigned to different clusters, because they have highly dissimilar statistics, and hence the boundary separating them is highly significant statistically. For example, as shown in Appendix B, the extremely-high-volatility segment of BM () is flanked by the low-volatility segments () and (). The Jensen-Shannon divergence of the boundary between and is , whereas the Jensen-Shannon divergence of the boundary between and is . Furthermore, because the clusters we identified from the hierachical clustering tree are highly robust, the set of time points where the color in the temporal distribution change is also highly robust. We therefore design our feature extraction methodology around this set of statistically significant and robust segment boundaries.

As a working definition, an economic sector is deemed to have recovered from the high-volatility phase, when we can identify in its time series low-volatility segments that run for longer than two months. The choice of the two-month duration is arbitrary, but as shown in the clustered segments of UT in Fig. 7 for example, we find that the ‘post-recovery’ time series always consists predominantly of low-volatility segments, interrupted infrequently by moderate-volatility market correction phases. With this definition, we find a very clear pattern of a temporally extended recovery in the ten economic sectors from the previous financial crisis. As shown in Fig. 8, EN and BM led the US economic recovery around April/May 2003, followed by FN and UT in early August 2003, CY and IN in mid-October 2003, NC and HC around November/December 2004, TL in mid-June 2004, and finally TC in mid-September 2004. The time interval between the first sector recovering and the last sector recovering is roughly one and a half years. Unless the present inner workings of the US economy is entirely different from what it was ten years ago, we believe this is the time scale US policy makers have to wrestle with to achieve complete economic recovery from the current financial crisis.
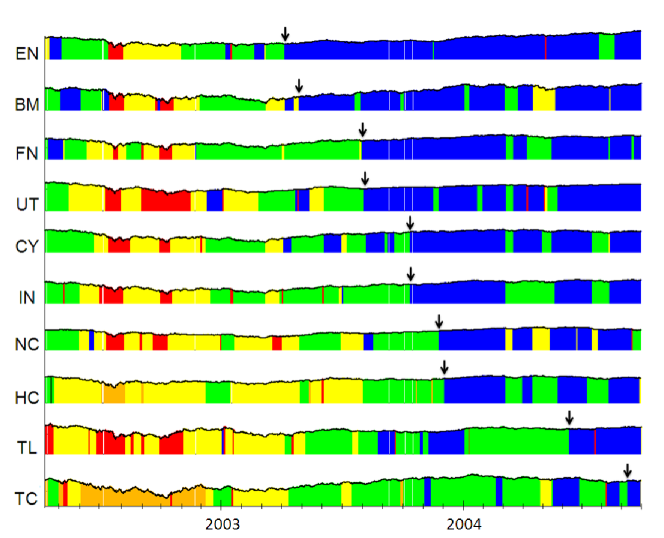
From Fig. 8, we see that the last sector to recover from the previous financial crisis (mid-1998 to mid-2003) is TC. This is understandable, because the previous financial crisis was the result of the technology bubble bursting, so it would be natural for investors to stay away from the technology sector while the economy is recovering. The observation that TL is the second-to-last sector to recover is also understandable: the fortunes of the telecommunications sector is most strongly tied to that of the technology sector. In general, the more ‘basic’ economic sectors recover ahead of the more ‘advanced’ economic sectors, because the output of the former must be consumed by the latter to drive the economic recovery. The other feature clearly visible in Fig. 8 is the pairwise recovery by (EN, BM), (FN, UT), (CY, IN), and (NC, HC). We suspect such pairings suggest closer causal relationship between members of the pairs. To ensure that the pairings observed in the recovery sequence, and also in the onset sequence we report in the next subsection, are economically meaningful and not merely accidental, we will analyze this causal proximity more carefully in Section 4. An understanding of the distribution of causal distances between economic sectors is clearly critical to policy making.
(a)
(b)
(c)
(d)
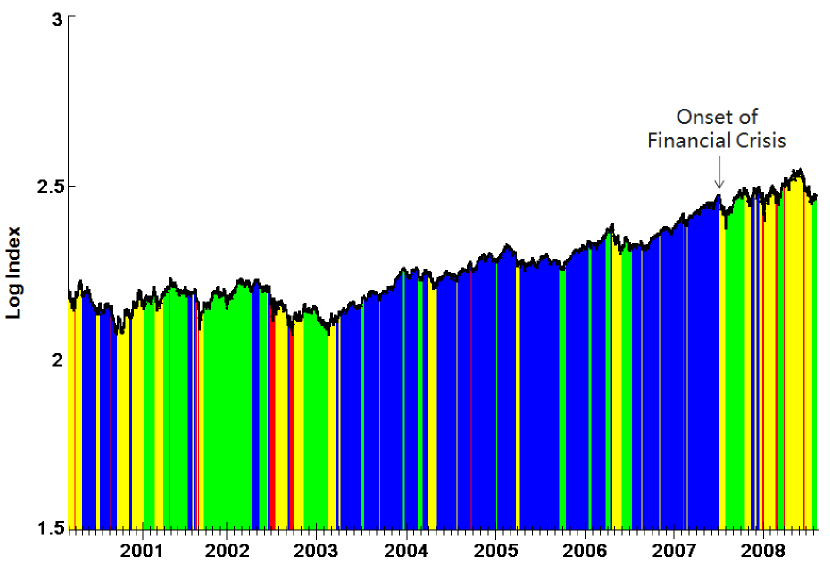
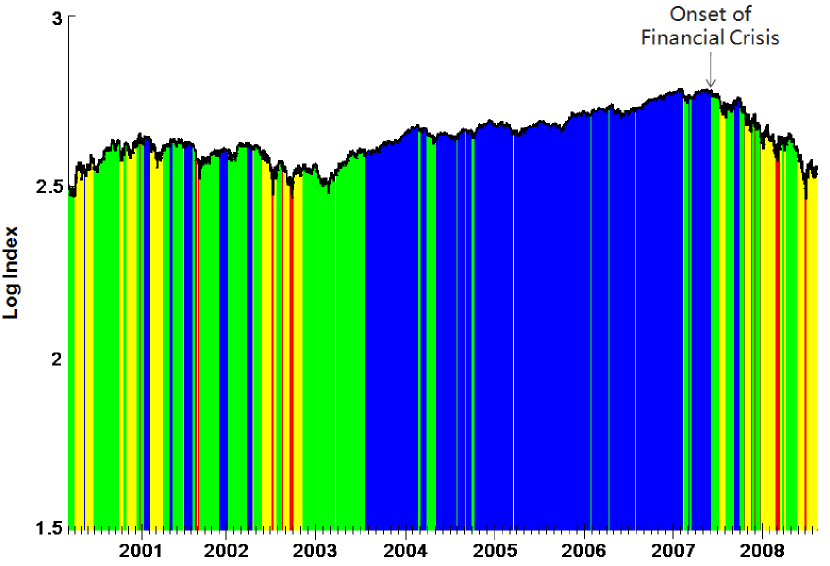
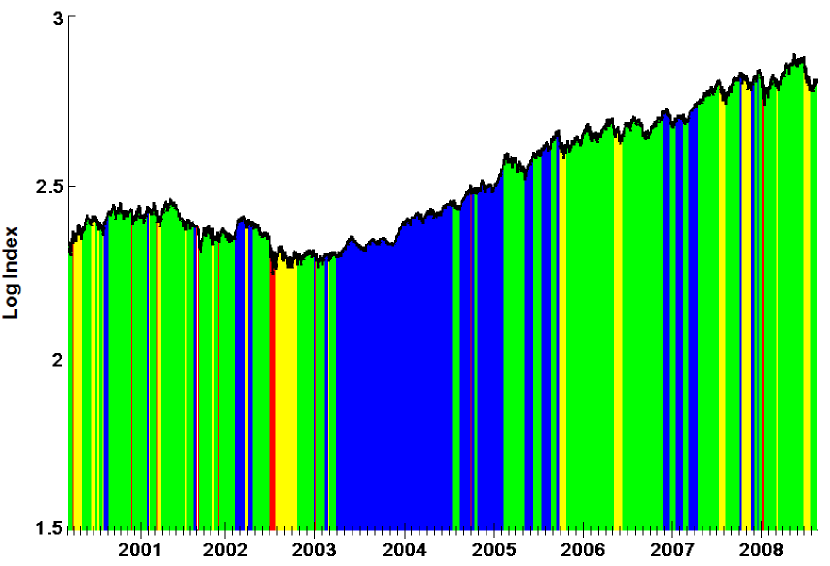
3.2 Mid-2007 onset of current global financial crisis
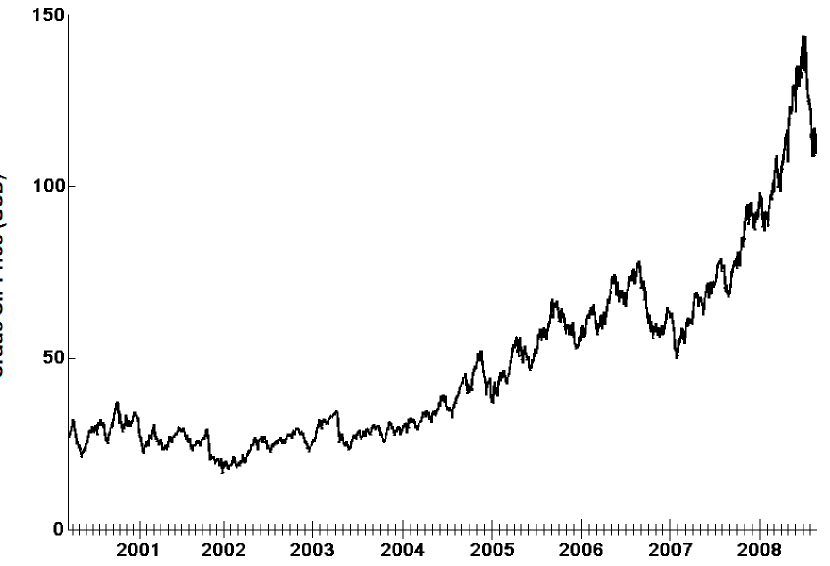
Analogous to our working definition of an economic recovery, we define the start of the high-volatility phase (the present financial crisis) in an economic sector time series as the end of the final low-volatility phase lasting longer than two months. In Fig. 9, we show the temporal distributions of clustered segments for (a) BM, (b) FN, and (c) EN. The start dates of high-volatility phases in FN and BM are 20 June 2007 and 23 July 2007 respectively, consistent with our earlier finding that the current global financial crisis started in July 2007. The EN sector, however, is an anomaly, because based on our working definition, the start of the high-volatility phase for EN would be 24 February 2005. In reality, the volatility of the EN sector time series is only moderate between 2005 and 2007, so what we are seeing in Fig. 9(c) is an extremely extended market correction phase, driven by the ever rising oil price (Fig. 9(d)).
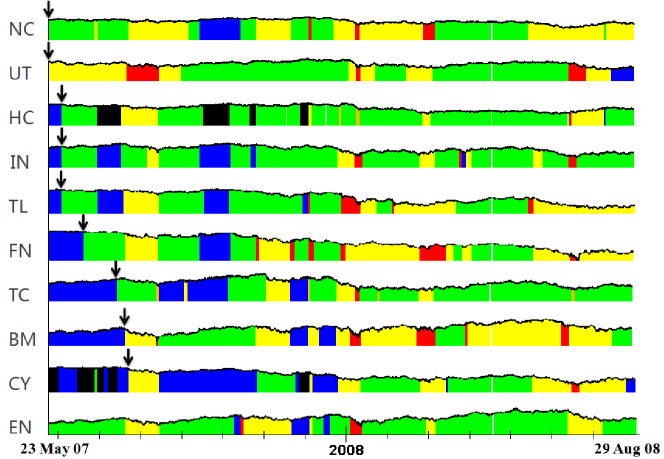
This anomaly aside, the pattern of clustered segments observed (see Fig. 10) for the mid-2007 onset of the present global financial crisis stands in stark contrast to the mid-2003 recovery from the previous financial crisis. Firstly, the time scale of the onset is very much shorter. Starting with NC/UT on 23 May 2007, HC/IN/TL on 4 June 2007, FN on 20 June 2007, TC on 17 July 2007, BM on 23 July 2007, and CY on 25 July 2007, the US economy went from the first sector to the last sector into the high-volatility phase in a mere two months! Secondly, the synchronized or nearly-synchronized groups of economic sectors are different: (NC, UT), (HC, IN, TL), (BM, CY). Thirdly, and most importantly, whereas the time series dynamics during the mid-2003 economic recovery appears to be driven by endogeneous interactions between the ten economic sectors, the time series dynamics during the mid-2007 breakdown of the global financial machinery appears to be driven by exogeneous factors. We will discuss in greater details this last observation in Section 5.
To date, the many accounts [74, 75, 76, 77, 78, 79, 80] of the present global financial crisis paint a complex picture of how the crisis came to pass. Our analysis suggests that the reasons behind the collapse of investor confidence worldwide might be even more complicated. Instead of being led by a crisis in the homebuilding and property industries, and the ensuing waves of mortgage defaults silently catching up to the financial institutions, we find the declines in the UT, HC, IN, and TL sectors between those of NC and FN, whose downfalls were nearly one month apart. If we were to assume that these four sectors were not at fault, and were merely collateral damage and early sacrifices of the subprime excesses, then fully half of the US economic sectors were in trouble before the financials found themselves in thick soup. One might wonder why no one saw and acted on these writings on the wall.
4 Shock-by-shock causal-link analysis
Perhaps no one understood these signs of the times, because they are written in the language of statistical fluctuations. In general, people understand things better if they are cast in relational terms, for example, cause and effect, leader and follower, etc. In this section, we map out probable causal links between the ten US economic sectors, based on the temporal distributions of the clustered segments, and their associated statistics. We do this first for the entire high-volatility phase prior to the mid-2003 economic recovery, and then for corresponding high-volatility shocks (to be defined later) preceding the mid-2003 economic recovery. Finally, we analyze corresponding high-volatility shocks after the July 2007 onset of the present financial crisis.
4.1 The entire high-volatility phase prior to mid-2003 economic recovery
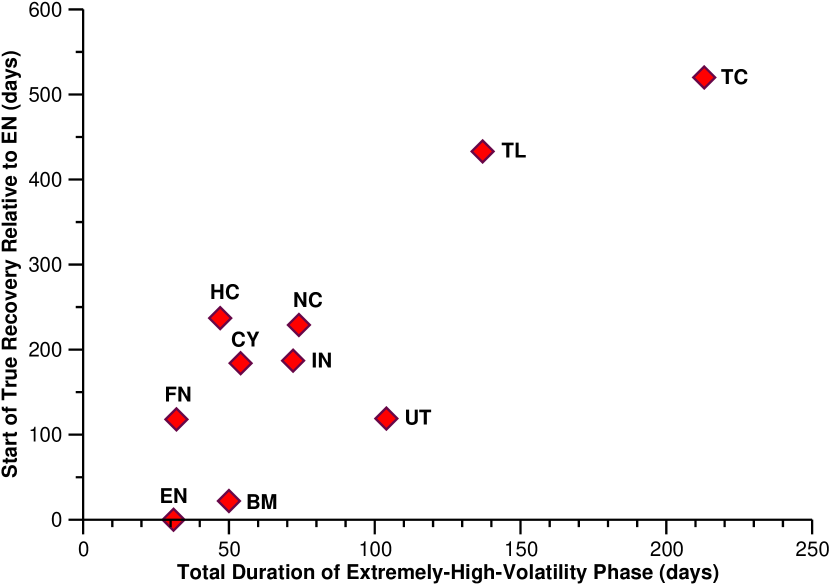
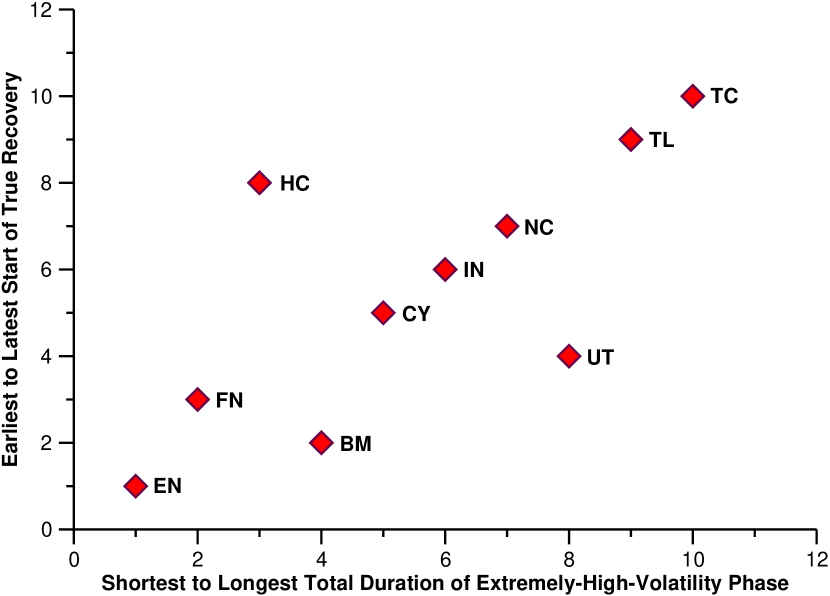
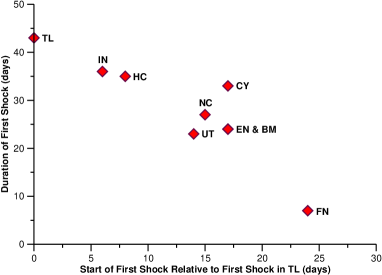
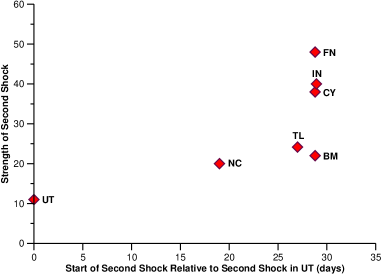
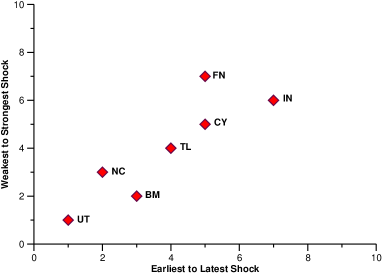
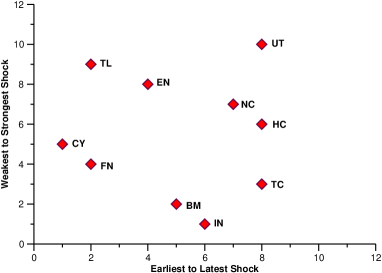
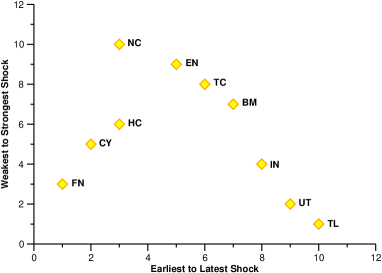
From Fig. 8, we can very roughly see that the later the start of recovery, the longer the high-volatility phase. This positive correlation between the start of recovery and duration of high-volatility phase can be seen more clearly in the form of a scatter plot (Fig. 11(a)). However, causal relationships between economic sectors are not so clear from the scatter plot. When the same information is presented as a rank plot in Fig. 11(b), the causal relationships become clearer. In fact, only in the rank plot is it clear that HC and UT are outliers during the recovery from the previous financial crisis. In going from a scatter plot to a rank plot, we have gone from parametric statistics to nonparametric order statistics. It is well known in the statistics community that order statistics, being much less sensitive to how well parameters are estimated, allows us to arrive at much more robust conclusions on trends and outliers [81, 82].
(a)
(b)
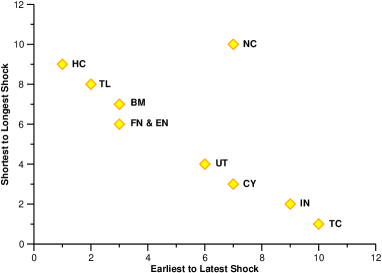
It would be interesting to perform a similar analysis for the present financial crisis, to compare and to contrast. However, at the time of writing, this crisis is not yet over. It is also tempting, based on the robustness of the rank plot results shown in Fig. 11(b), to expect EN, FN and BM to again lead the recovery (or at least be very close to the start of the complete recovery), and that recovery in CY will precede IN, which will in turn precede NC, as suggested by Fig. 11(b). However, we must remind ourselves of the difference between robustness and significance. A given sequence is only meaningful, and predictive, only if it is robustly determined, and its appearance statistically significant compared against the null hypothesis of the sequence appearing by chance. To establish that temporal proximity in their response is a statistical significant indicator of causal proximity between two US economic sectors, we analyze various rank plots of the ten US economic sectors at the shock-by-shock level, for both the period prior to the mid-2003 economic recovery, as well as the period after the mid-2007 start of the Subprime Crisis. Basically, a significant and robust sequence is one that we expect to see over and over again in the following shock-by-shock analysis.
4.2 Very-high-volatility shocks prior to mid-2003 economic recovery
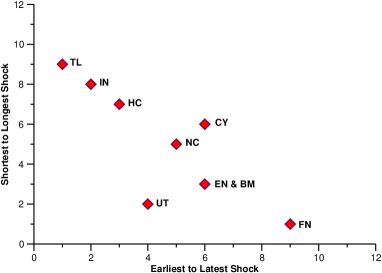
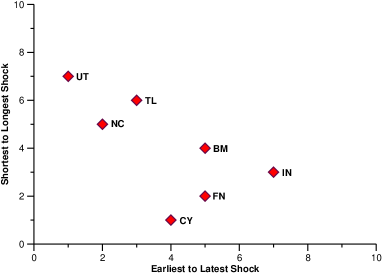
To repeat the causal-link analysis presented above on the more detailed level of individual shocks, which are periods in the time series characterized by high market volatilities, we observe the presence of corresponding shocks in the different sectors. These can be identified based on the volatility, or the direction of volatility change. In Fig. 12, we highlight a pair of very-high-volatility shocks (July 2002 and October 2002) experienced by most of the economic sectors around the 2002 low of the major US indices. For most economic sectors, this is the last extended very-high-volatility shocks experienced prior to the mid-2003 economic recovery.
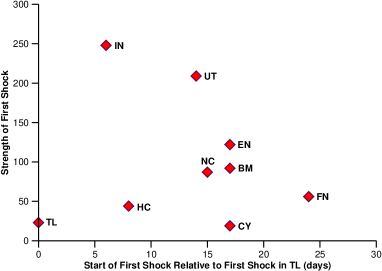
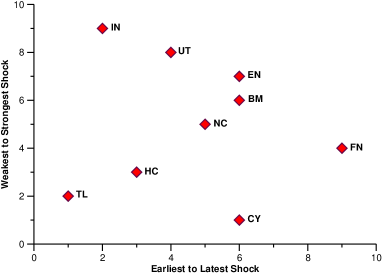
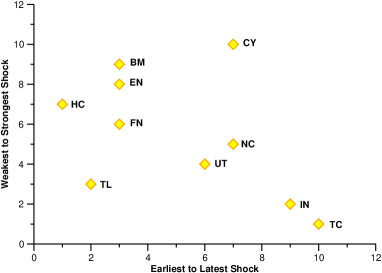
In Fig. 13 we show the scatter plots of the duration and strength of the shocks against the start of the shocks. As expected from our causal tree analogy, there is a negative correlation between duration of shock and start of shock. This relationship is clearer for the first (July 2002) shock (Fig. 13(a)), and less clear for the second (October 2002) shock (Fig. 13(b)), where the starting dates of BM, CY, FN, IN and TL are highly clustered. Based on our causal tree analogy, we also expect a leading sector to experience a stronger shock compared to a trailing sector. This translates to an expected negative correlation between the Jensen-Shannon divergence value of the leading boundary of the very-high-volatility shocks and the start of the shock. Here, let us recall that the larger is, the more statistically different the very-high-volatility shock is from the preceding segment, and thus the stronger the shock.
 |
 |
| (a) | (b) |
 |
 |
| (c) | (d) |
 |
 |
| (a) | (b) |
 |
 |
| (c) | (d) |
However, the scatter plots (c) and (d) in Fig. 13 suggests something more complex and more interesting. For the first shock, a negative correlation between Jensen-Shannon divergence and start was observed for IN, UT and FN, but a positive correlation is observed for TL, HC, NC, BM, and EN. In this first shock, CY is an outlier, which is not clear from Fig. 13(a). For the second shock, we see surprisingly from Fig. 13(d) a strictly positive trend for all participating sectors. These trends, which can be seen even clearer on the rank plots shown in Fig. 14, can only be explained if there is amplification as volatility shocks propagate from one sector to another in the causal tree. If this amplification is linear, and is weaker than the expected linear dissipation, we would expect to see dissipative propagation of volatility shocks all the time. Conversely, if the linear amplification is stronger than the linear dissipation, we would expect to see amplified propagation of volatility shocks all the time. In our plots, we see mostly dissipative propagation of volatility shocks, and amplification only occasionally. This suggests that the amplification of volatility shocks is of a nonlinear nature.
4.3 High-volatility shocks after mid-2007 onset of present financial crisis
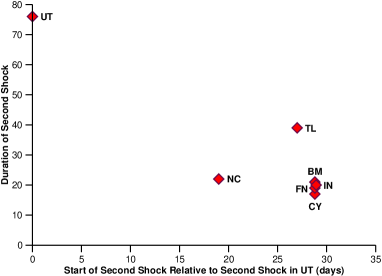
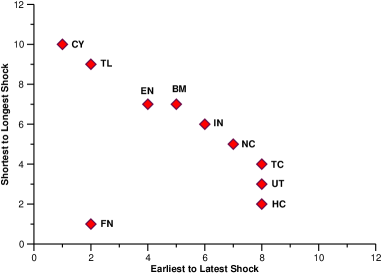
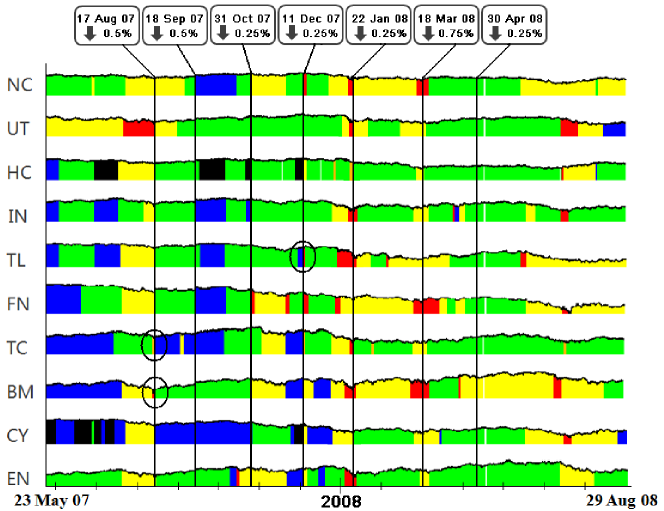
As we shall show in the next section, the temporal distributions of clustered segments right after the onset of the present financial crisis appears to be strongly driven by the Federal Reserve interest rate cuts. The clustered segment boundaries between some economic sectors coincide to within a day or two of the the dates interest rates are revised. This observation is highly significant, given the statistical significance and robustness of the clustered segment boundaries. However, because of this strong driving, nearly all scatter plots are highly clustered and not very informative. In contrast, rank plots constructed based on the precise half-hour of the segment boundaries are more informative. In Fig. 15, we show the rank plots for two high-volatility shocks (end-July 2007 and end-January 2008) and one very-high-volatility shock (mid-January 2008).
 |
 |
| (a) | (b) |
 |
 |
| (c) | (d) |
 |
 |
| (e) | (f) |
In Fig. 15, we find the negative correlations between duration and starting time, as well as between strength and starting time for all three shocks expected from the causal tree analogy. However, there are several surprises. First, different statistical outliers are identified from different shocks, and also from different rank plots. For the first high-volatility shock (end-July 2007), NC experienced a much longer shock, whereas CY experienced a much stronger shock than expected from their respective starting times. For the very-high-volatility shock (mid-January 2008), FN experienced a much shorter shock, whereas UT experienced a stronger shock than expected from their respective starting times. For the second high-volatility shock (end-January 2008) immediately following the very-high-volatility shock, we find FN, CY, and HC experiencing much weaker shocks than expected based on the starting times of their respective shocks. As suggested earlier, this is the signature of nonlinear amplification of the volatility shock as it propagates from FN to CY to HC. Second, from the rank plot of strength against starting time of the very-high-volatility shock, we detect two different clusters of economic sectors, (CY, FN, BM, IN) and (TL, EN, NC, HC). This statistical feature suggests that there are two (or perhaps more) shocks propagating in tandem through the US economy around mid-January 2008. Third, the orderings in the duration versus starting time rank plots are different for the first and second high-volatility shocks, suggesting that causal links in the US economy are highly dynamic, and constantly rearranging themselves.
5 The (near) futility of interest rate cuts
After the subtle and statistically weaker onset signatures between May and July 2007, most of the important shocks in different economic sectors occur within a day or two of each other, and appear to be exogeneously driven by Federal Reserve interest rate cuts, as shown in Fig. 16. In BM, TC, and TL, we see brief volatility movements a few days to a week before two interest rate cuts (circled in Fig. 16), suggesting that these sectors were anticipating the rate cuts. Naturally, all fiscal policies are double-edged swords. According to Investopedia [83], a decrease in interest rates is supposed to move money from the bond market to the stock market. It is also supposed to allow businesses to finance their expansion at a cheaper rate, increase their future earnings, and thereby bring about higher stock prices. Even though an interest rate cut erodes the banks’ ability to make money (since the main business of banks is to lend money), the overall psychological impact of interest rate cuts is regarded as positive, more so during a financial crisis. Taking the investors’ sentiments into account, it is likely that interest rate cuts were implemented during the onset of the Subprime Crisis to calm the market.
Indeed, looking at Fig. 16, the first rate cut on 17 August 2007 appears to be highly effective, in the sense that market volatilities fell across a broad spectrum of economic sectors right after the cut. The only exception is NC, which did not respond to this first rate cut. In comparison, the second rate cut on 18 September 2007 appears to be slightly less effective. On 18 September, TC and CY were already in the low-volatility phase, so we do not expect the second rate cut to do anything to these sectors anyway. However, even after factoring in anticipations and lags, BM and EN, which were in the moderate-volatility phase, did not respond to this second rate cut. More interestingly, the next three rate cuts, on 31 October 2007, 11 December 2007, and 22 January 2008, appear to have the opposite effect as intended, increasing (instead of lowering) market volatilities in a number of economic sectors. Most notably, NC, HC, TC and BM reacted adversely to all three rate cuts. Finally, we observe that the last two rate cuts, on 18 March 2008 and 30 April 2008, do not coincide with any of the clustered segment boundaries. As far as we can tell, the interest rate cuts were ineffective in evoking any kind of response from the market. This is especially true for the last rate cut on 30 April 2008.
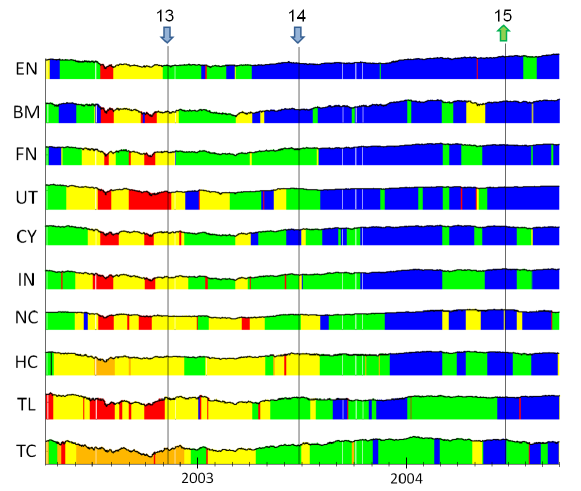
Similar interest rate cut driven dynamics were seen in 2001, the year the US economy was officially in recession. However, the picture on whether interest rate cuts by the Federal Reserve (see Table 4) is an effective tool for macroeconomic manipulations is a lot less clear. As we can see from Fig. 17(a), successive interest rate cuts alternates between counter-effective (market volatilities increased in most economic sectors) and effective (market volatilities decreased in most economic sectors), before losing its effectiveness (no change in market volatilities for most economic sectors) in the last few cuts. This ineffectiveness of interest rate cuts continued into 2002 and 2003 (see Fig. 17(b)), when the US economy started recovering from the previous financial crisis.
| S/No. | Date | Change (%) | New Rate (%) |
|---|---|---|---|
| 1 | 16 May 2000 | 6.50 | |
| 2 | 3 January 2001 | 6.00 | |
| 3 | 31 January 2001 | 5.50 | |
| 4 | 20 March 2001 | 5.00 | |
| 5 | 18 April 2001 | 4.50 | |
| 6 | 15 May 2001 | 4.00 | |
| 7 | 27 June 2001 | 3.75 | |
| 8 | 21 August 2001 | 3.50 | |
| 9 | 17 September 2001 | 3.00 | |
| 10 | 2 October 2001 | 2.50 | |
| 11 | 6 November 2001 | 2.00 | |
| 12 | 11 December 2001 | 1.75 | |
| 13 | 6 November 2002 | 1.25 | |
| 14 | 25 June 2003 | 1.00 | |
| 15 | 30 June 2004 | 1.25 |

(a)
(b)
6 Conclusions
To understand the causal links and processes within the US economy, we performed in this paper a comparative segmentation and clustering analysis of the time series data between 14 February 2000 and 31 August 2008 for the ten Dow Jones US economic sector indices. Based on general features of the temporal distributions of clustered segments, we see a clear pattern of economic recovery from the mid-1998 to mid-2003 financial crisis, and also a clear pattern of descent into the present global financial crisis. In particular, we saw how EN and BM led the one-and-a-half-year long recovery from the previous financial crisis precipitated by TC, and how NC and UT led the two-month-long decline into the present financial crisis. Apart from the greatly differing time scales between recovery and onset, our study also reveals that on a macroscopic scale, the economic sector going first into a financial crisis recovers the last, and the last economic sector to be in trouble recovers first.
From the temporal distributions of clustered segments, we were also able to identify corresponding shocks in the different economic sectors, based on the volatility, or the direction of volatility change. Our shock-by-shock causal-link analysis thereafter reveals on a mesoscopic level that leading sectors experience a stronger and longer shock, whereas trailing sectors experience a weaker and shorter shock. We also observe in general that corresponding shocks start in close temporal proximity to each other within the most closely related sectors. These general observations are robust, because they are derived from the order statistics of the starting dates, durations, and strengths of shocks in the various economic sectors. These observations are also modestly significant, even though the sample size is small, because they are repeatedly observed for different shocks in different historical periods. More importantly, these general observations are consistent with the causal tree analogy we developed, which helps us simplify our mental model of the response of an economy to financial crises. In addition to dissipative propagation of volatility shocks from one economic sector to another, we also find evidences for nonlinear amplification, and complex sectorial structures for the propagating shocks that suggest a highly dynamic US economy.
Most interestingly, while the mid-2003 economic recovery appears to be driven by endogeneous interactions within the US economy, the dynamics during the mid-2007 onset of the Subprime Crisis appears to be strongly driven by the Federal Reserve interest rate cuts. By comparing the dates interest rates were cut to the statistical significant boundaries of clustered segments, we find that the first few interest rate cuts are effective, i.e. market volatility decreases across a broad spectrum of economic sectors. Surprisingly, the next few interest rate cuts are counter-effective, in the sense that the market volatility increases after the rate cut in most economic sectors. Thereafter, the volatilities in most economic sectors stop responding to further interest rate cuts, which have thus become ineffective. A slightly more complex pattern of interest rate cuts alternating between effective and counter-effective, before becoming ineffective, was also found during 2001 (the year the US economy officially went into a recession). The moral of the story is clear: an interest rate cut by the Federal Reserve is not a magic bullet, nor panacea for all our economic woes, but must be administered sparingly to be effective.
Acknowledgements
This research is supported by the Nanyang Technological University startup grant SUG 19/07. We have had helpful discussions with Chris Kok Jun Liang and Tan Chong Hui.
Appendix A Top components of Dow Jones US economic sector indices
A.1 Basic Materials
| ISIN/Ticker | Company | Adjusted Weight |
|---|---|---|
| FCX | Freeport-McMoRan Copper & Gold Inc. | 10.29% |
| DD | E.I. DuPont de Nemours & Co. | 9.12% |
| DOW | Dow Chemical Co. | 7.70% |
| NEM | Newmont Mining Corp. | 6.14% |
| PX | Praxair Inc. | 6.13% |
| APD | Air Products & Chemicals Inc. | 3.67% |
| BTU | Peabody Energy Corp. | 3.38% |
| AA | Alcoa Inc. | 2.89% |
| PPG | PPG Industries Inc. | 2.78% |
| ECL | Ecolab Inc. | 2.41% |
A.2 Consumer Services
| ISIN/Ticker | Company | Adjusted Weight |
|---|---|---|
| WMT | Wal-Mart Stores Inc. | 7.28% |
| MCD | McDonald’s Corp. | 5.33% |
| DIS | Walt Disney Co. | 4.15% |
| AMZN | Amazon.com Inc. | 3.90% |
| HD | Home Depot Inc. | 3.28% |
| CVS | CVS Caremark Corp. | 2.70% |
| CMCSA | Comcast Corp. Cl A | 2.64% |
| TGT | Target Corp. | 2.44% |
| DTV | DIRECTV Group Inc. | 2.30% |
| WAG | Walgreen Co. | 2.18% |
A.3 Oil & Gas
| ISIN/Ticker | Company | Adjusted Weight |
|---|---|---|
| XOM | Exxon Mobil Corp. | 25.57% |
| CVX | Chevron Corp. | 11.68% |
| SLB | Schlumberger Ltd. | 7.59% |
| COP | ConocoPhillips | 6.01% |
| OXY | Occidental Petroleum Corp. | 5.14% |
| APA | Apache Corp. | 2.96% |
| HAL | Halliburton Co. | 2.47% |
| APC | Anadarko Petroleum Corp. | 2.28% |
| DVN | Devon Energy Corp. | 2.08% |
| NOV | National Oilwell Varco Inc. | 1.84% |
A.4 Financials
| ISIN/Ticker | Company | Adjusted Weight |
|---|---|---|
| JPM | JPMorgan Chase & Co. | 7.50% |
| WFC | Wells Fargo & Co. | 6.73% |
| BAC | Bank of America Corp. | 5.50% |
| C | Citigroup Inc. | 5.04% |
| GS | Goldman Sachs Group Inc. | 3.40% |
| BRK/B | Berkshire Hathaway Inc. Cl B | 3.38% |
| AXP | American Express Co. | 2.32% |
| USB | U.S. Bancorp | 2.30% |
| V | VISA Inc. Cl A | 1.85% |
| BK | Bank of New York Mellon Corp. | 1.65% |
A.5 Healthcare
| ISIN/Ticker | Company | Adjusted Weight |
|---|---|---|
| JNJ | Johnson & Johnson | 12.56% |
| PFE | Pfizer Inc. | 9.68% |
| MRK | Merck & Co. Inc. | 7.82% |
| ABT | Abbott Laboratories | 5.28% |
| AMGN | Amgen Inc. | 3.72% |
| BMY | Bristol-Myers Squibb Co. | 3.20% |
| UNH | UnitedHealth Group Inc. | 3.03% |
| MDT | Medtronic Inc. | 2.68% |
| LLY | Eli Lilly & Co. | 2.44% |
| GILD | Gilead Sciences Inc. | 2.26% |
A.6 Industrials
| ISIN/Ticker | Company | Adjusted Weight |
|---|---|---|
| GE | General Electric Co. | 10.45% |
| UTX | United Technologies Corp. | 4.03% |
| MMM | 3M Co. | 3.39% |
| UPS | United Parcel Service Inc. Cl B | 3.10% |
| CAT | Caterpillar Inc. | 2.98% |
| UNP | Union Pacific Corp. | 2.77% |
| BA | Boeing Co. | 2.58% |
| EMR | Emerson Electric Co. | 2.57% |
| HON | Honeywell International Inc. | 2.15% |
| DE | Deere & Co. | 1.95% |
A.7 Consumer Goods
| ISIN/Ticker | Company | Adjusted Weight |
|---|---|---|
| PG | Procter & Gamble Co. | 13.34% |
| KO | Coca-Cola Co. | 10.35% |
| PM | Philip Morris International Inc. | 8.02% |
| PEP | PepsiCo Inc. | 7.91% |
| F | Ford Motor Co. | 4.09% |
| MO | Altria Group Inc. | 3.85% |
| KFT | Kraft Foods Inc. Cl A | 3.73% |
| CL | Colgate-Palmolive Co. | 2.90% |
| MON | Monsanto Co. | 2.50% |
| NKE | Nike Inc. Cl B | 1.97% |
A.8 Technology
| ISIN/Ticker | Company | Adjusted Weight |
|---|---|---|
| AAPL | Apple Inc. | 13.57% |
| MSFT | Microsoft Corp. | 9.33% |
| IBM | International Business Machines Corp. | 8.58% |
| GOOG | Google Inc. Cl A | 6.52% |
| INTC | Intel Corp. | 5.65% |
| CSCO | Cisco Systems Inc. | 5.31% |
| ORCL | Oracle Corp. | 4.98% |
| HPQ | Hewlett-Packard Co. | 4.73% |
| QCOM | Qualcomm Inc. | 3.61% |
| EMC | EMC Corp. | 2.11% |
A.9 Telecommunications
| ISIN/Ticker | Company | Adjusted Weight |
|---|---|---|
| T | AT&T Inc. | 44.32% |
| VZ | Verizon Communications Inc. | 24.29% |
| AMT | American Tower Corp. Cl A | 5.45% |
| CTL | CenturyLink Inc. | 3.47% |
| S | Sprint Nextel Corp. | 2.99% |
| CCI | Crown Castle International Corp. | 2.75% |
| Q | Qwest Communications International Inc. | 2.67% |
| FTR | Frontier Communications Corp. | 2.44% |
| VMED | Virgin Media Inc. | 2.03% |
| NIHD | NII Holdings Inc. | 1.72% |
A.10 Utilities
| ISIN/Ticker | Company | Adjusted Weight |
|---|---|---|
| SO | Southern Co. | 6.68% |
| EXC | Exelon Corp. | 5.61% |
| D | Dominion Resources Inc. (Virginia) | 5.28% |
| DUK | Duke Energy Corp. | 4.94% |
| NEE | NextEra Energy Inc. | 4.52% |
| PCG | PG&E Corp. | 3.96% |
| AEP | American Electric Power Co. Inc. | 3.67% |
| PEG | Public Service Enterprise Group Inc. | 3.38% |
| SE | Spectra Energy Corp. | 3.32% |
| ED | Consolidated Edison Inc. | 2.93% |
Appendix B List of time series segments
In this appendix, we list all time series segments identified by the recursive segmentation procedure, for all ten DJUS economic sector indices. In the tables to follow, the start, end, and duration of each segment is given in terms of the number of half hours since 14 February 2000. The actual calendar date for the start of each segment is also given.
If segment with half hours is indeed generated by a Gaussian process with mean and standard deviation , the standard errors in estimating and are given by the finite-sample formulas
| (6) |
and
| (7) |
respectively. Even if segment is generated by a different stochastic process, these formulas are still useful for gauging the magnitudes of the standard errors in and .
The Jensen-Shannon divergence between successive segments and are also given. Given that the Jensen-Shannon divergence between successive Gaussian segments is a simple function (Eq. (4)) of the standard deviations (of segment with length ), (of segment with length ), and (of the combined supersegment with length ), we estimate the error in as
| (8) |
Here, we make use of the fact that is positively correlated to and .
Using the fact that the fractional errors are
| (9) |
for Gaussian segments, we arrive at the simplified expression
| (10) |
for the error in the Jensen-Shannon divergence .
The error derived in Eq. (10) is independent of the data, and depends only on the position of the segment boundary. Fig. 18 shows for a segment of length , which is largest when . This maximum error grows with the length of the segment as
| (11) |
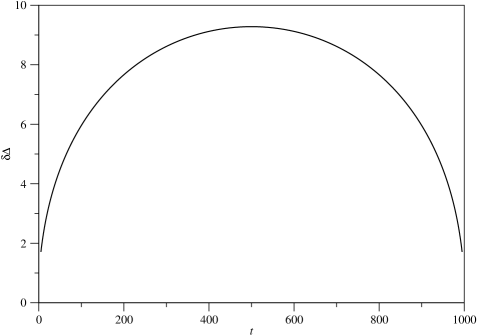
The large majority of our time series segments are shorter than . Hence their Jensen-Shannon divergences ought to be compared against standard errors that are generally smaller than for . Moreover, most of the time series segments longer than are enclosed by very strong segment boundaries with very large Jensen-Shannon divergences. This suggests that most of our segments, which are selected based on our empirical cutoff , should be statistically significant.
In fact, for shorter segments, Eq. (11) tells us that we can adopt a cutoff lower than 10, and still maintain their statistical significance. We do not do this, because it would result in a large number of short but statistically significant intraday market microstructure segments. One of our reasons for choosing the empirical cutoff of is to limit the emergence of such segments.
B.1 Basic Materials
| start | end | duration | start date | mean | std dev | cluster | ||
|---|---|---|---|---|---|---|---|---|
| 1 | 1 | 184 | 184 | 14/02/2000 | - | high | ||
| 2 | 185 | 312 | 128 | 02/03/2000 | high | |||
| 3 | 313 | 336 | 24 | 14/03/2000 | extremely high | |||
| 4 | 337 | 388 | 52 | 16/03/2000 | high | |||
| 5 | 389 | 612 | 224 | 22/03/2000 | high | |||
| 6 | 615 | 1196 | 582 | 18/04/2000 | low | |||
| 7 | 1197 | 1380 | 184 | 26/06/2000 | high | |||
| 8 | 1381 | 1826 | 446 | 17/07/2000 | low | |||
| 9 | 1827 | 1842 | 16 | 30/08/2000 | extremely high | |||
| 10 | 1845 | 2081 | 237 | 06/09/2000 | low | |||
| 11 | 2082 | 2388 | 307 | 28/09/2000 | high | |||
| 12 | 2389 | 2609 | 221 | 30/10/2000 | high | |||
| 13 | 2611 | 2725 | 115 | 20/11/2000 | low | |||
| 14 | 2726 | 3013 | 288 | 30/11/2000 | high | |||
| 15 | 3014 | 3243 | 230 | 29/12/2000 | high | |||
| 16 | 3244 | 3658 | 415 | 26/01/2001 | moderate | |||
| 17 | 3659 | 3689 | 31 | 09/03/2001 | extremely high | |||
| 18 | 3691 | 4005 | 315 | 14/03/2001 | high | |||
| 19 | 4020 | 4037 | 18 | 18/04/2001 | low | |||
| 20 | 4038 | 4285 | 248 | 20/04/2001 | moderate | |||
| 21 | 4286 | 4302 | 17 | 14/05/2001 | extremely high | |||
| 22 | 4305 | 4320 | 16 | 15/05/2001 | low | |||
| 23 | 4321 | 5070 | 750 | 21/05/2001 | moderate | |||
| 24 | 5071 | 5276 | 206 | 31/07/2001 | low | |||
| 25 | 5277 | 5327 | 51 | 20/08/2001 | high | |||
| 26 | 5328 | 5396 | 69 | 24/08/2001 | low | |||
| 27 | 5397 | 5562 | 166 | 04/09/2001 | extremely high | |||
| 28 | 5565 | 5746 | 182 | 21/09/2001 | high | |||
| 29 | 5747 | 7772 | 2026 | 11/10/2001 | moderate | |||
| 30 | 7773 | 8094 | 322 | 02/05/2002 | low | |||
| 31 | 8095 | 8411 | 317 | 03/06/2002 | moderate | |||
| 32 | 8412 | 8430 | 19 | 02/07/2002 | high | |||
| 33 | 8431 | 8531 | 101 | 05/07/2002 | low | |||
| 34 | 8532 | 8772 | 241 | 12/07/2002 | extremely high | |||
| 35 | 8775 | 8899 | 125 | 05/08/2002 | high | |||
| 36 | 8900 | 9266 | 367 | 16/08/2002 | high | |||
| 37 | 9267 | 9300 | 34 | 20/09/2002 | extremely high | |||
| 38 | 9301 | 9341 | 41 | 25/09/2002 | low | |||
| 39 | 9342 | 9558 | 217 | 27/09/2002 | extremely high | |||
| 40 | 9559 | 9961 | 403 | 18/10/2002 | high | |||
| 41 | 9962 | 11004 | 1043 | 27/11/2002 | moderate | |||
| 42 | 11005 | 11305 | 301 | 12/03/2003 | high | |||
| 43 | 11306 | 11440 | 135 | 09/04/2003 | low | |||
| 44 | 11441 | 11520 | 80 | 23/04/2003 | high | |||
| 45 | 11521 | 12401 | 881 | 01/05/2003 | low | |||
| 46 | 12402 | 12492 | 91 | 23/07/2003 | moderate | |||
| 47 | 12495 | 13120 | 626 | 31/07/2003 | low | |||
| 48 | 13121 | 13167 | 47 | 29/09/2003 | moderate | |||
| 49 | 13170 | 13791 | 622 | 02/10/2003 | low | |||
| 50 | 13792 | 14123 | 332 | 01/12/2003 | low | |||
| 51 | 14124 | 14204 | 81 | 02/01/2004 | moderate | |||
| 52 | 14206 | 14758 | 553 | 14/01/2004 | low | |||
| 53 | 14759 | 14969 | 211 | 08/03/2004 | moderate | |||
| 54 | 14971 | 15202 | 232 | 29/03/2004 | low | |||
| 55 | 15203 | 15552 | 350 | 20/04/2004 | high | |||
| 56 | 15555 | 15807 | 253 | 21/05/2004 | low | |||
| 57 | 15810 | 16121 | 312 | 17/06/2004 | low | |||
| 58 | 16122 | 16405 | 284 | 19/07/2004 | low | |||
| 59 | 16406 | 16422 | 17 | 13/08/2004 | high | |||
| 60 | 16425 | 16856 | 432 | 16/08/2004 | low | |||
| 61 | 16857 | 16997 | 141 | 27/09/2004 | low | |||
| 62 | 16998 | 17015 | 18 | 11/10/2004 | extremely high | |||
| 63 | 17016 | 17268 | 253 | 13/10/2004 | low | |||
| 64 | 17269 | 17382 | 114 | 05/11/2004 | low | |||
| 65 | 17383 | 17399 | 17 | 16/11/2004 | high | |||
| 66 | 17401 | 18073 | 673 | 18/11/2004 | low | |||
| 67 | 18074 | 18093 | 20 | 24/01/2005 | moderate | |||
| 68 | 18094 | 18448 | 355 | 26/01/2005 | low | |||
| 69 | 18449 | 18795 | 347 | 01/03/2005 | low | |||
| 70 | 18796 | 18881 | 86 | 04/04/2005 | low |
| start | end | duration | start date | mean | std dev | cluster | ||
|---|---|---|---|---|---|---|---|---|
| 71 | 18882 | 19047 | 166 | 11/04/2005 | high | |||
| 72 | 19050 | 19065 | 16 | 26/04/2005 | low | |||
| 73 | 19066 | 19275 | 210 | 28/04/2005 | low | |||
| 74 | 19276 | 20282 | 1007 | 18/05/2005 | low | |||
| 75 | 20283 | 20721 | 439 | 23/08/2005 | low | |||
| 76 | 20722 | 21001 | 280 | 04/10/2005 | moderate | |||
| 77 | 21002 | 21943 | 942 | 31/10/2005 | low | |||
| 78 | 21944 | 22070 | 127 | 01/02/2006 | moderate | |||
| 79 | 22071 | 22249 | 179 | 15/02/2006 | low | |||
| 80 | 22250 | 22660 | 411 | 06/03/2006 | low | |||
| 81 | 22661 | 22878 | 218 | 12/04/2006 | moderate | |||
| 82 | 22879 | 22941 | 63 | 04/05/2006 | low | |||
| 83 | 22942 | 23050 | 109 | 10/05/2006 | high | |||
| 84 | 23051 | 23102 | 52 | 19/05/2006 | high | |||
| 85 | 23103 | 23371 | 269 | 25/05/2006 | high | |||
| 86 | 23372 | 23807 | 436 | 21/06/2006 | moderate | |||
| 87 | 23808 | 24176 | 369 | 02/08/2006 | low | |||
| 88 | 24177 | 24210 | 34 | 06/09/2006 | high | |||
| 89 | 24211 | 24394 | 184 | 11/09/2006 | low | |||
| 90 | 24395 | 24440 | 46 | 27/09/2006 | low | |||
| 91 | 24441 | 24627 | 187 | 02/10/2006 | low | |||
| 92 | 24630 | 24953 | 324 | 18/10/2006 | low | |||
| 93 | 24954 | 24969 | 16 | 17/11/2006 | high | |||
| 94 | 24970 | 25918 | 949 | 20/11/2006 | low | |||
| 95 | 25919 | 25966 | 48 | 23/02/2007 | extremely high | |||
| 96 | 25967 | 26095 | 129 | 01/03/2007 | low | |||
| 97 | 26096 | 26112 | 17 | 13/03/2007 | high | |||
| 98 | 26115 | 26130 | 16 | 14/03/2007 | low | |||
| 99 | 26131 | 26514 | 384 | 16/03/2007 | low | |||
| 100 | 26515 | 27461 | 947 | 23/04/2007 | low | |||
| 101 | 27462 | 27716 | 255 | 23/07/2007 | high | |||
| 102 | 27717 | 27735 | 19 | 15/08/2007 | extremely high | |||
| 103 | 27736 | 28521 | 786 | 17/08/2007 | moderate | |||
| 104 | 28522 | 28799 | 278 | 31/10/2007 | high | |||
| 105 | 28801 | 28818 | 18 | 28/11/2007 | low | |||
| 106 | 28819 | 28943 | 125 | 29/11/2007 | low | |||
| 107 | 28944 | 29030 | 87 | 11/12/2007 | high | |||
| 108 | 29031 | 29170 | 140 | 19/12/2007 | low | |||
| 109 | 29171 | 29278 | 108 | 03/01/2008 | high | |||
| 110 | 29279 | 29369 | 91 | 15/01/2008 | extremely high | |||
| 111 | 29371 | 29816 | 446 | 25/01/2008 | high | |||
| 112 | 29817 | 29967 | 151 | 07/03/2008 | extremely high | |||
| 113 | 29970 | 30206 | 237 | 24/03/2008 | moderate | |||
| 114 | 30207 | 30226 | 20 | 15/04/2008 | extremely high | |||
| 115 | 30227 | 30391 | 165 | 17/04/2008 | high | |||
| 116 | 30392 | 30986 | 595 | 02/05/2008 | high | |||
| 117 | 30987 | 31047 | 61 | 30/06/2008 | extremely high | |||
| 118 | 31050 | 31391 | 342 | 07/07/2008 | high | |||
| 119 | 31395 | 31557 | 163 | 14/08/2008 | moderate |
B.2 Consumer Services
| start | end | duration | start date | mean | std dev | cluster | ||
|---|---|---|---|---|---|---|---|---|
| 1 | 1 | 481 | 481 | 14/02/2000 | - | moderate | ||
| 2 | 482 | 627 | 146 | 04/04/2000 | extremely high | |||
| 3 | 630 | 700 | 71 | 24/04/2000 | moderate | |||
| 4 | 701 | 717 | 17 | 01/05/2000 | extremely high | |||
| 5 | 720 | 955 | 236 | 04/05/2000 | moderate | |||
| 6 | 956 | 972 | 17 | 26/05/2000 | extremely high | |||
| 7 | 975 | 1032 | 58 | 30/05/2000 | high | |||
| 8 | 1035 | 1050 | 16 | 07/06/2000 | low | |||
| 9 | 1051 | 1236 | 186 | 13/06/2000 | low | |||
| 10 | 1237 | 1323 | 87 | 29/06/2000 | moderate | |||
| 11 | 1324 | 1511 | 188 | 10/07/2000 | low | |||
| 12 | 1512 | 1528 | 17 | 27/07/2000 | extremely high | |||
| 13 | 1530 | 1585 | 56 | 31/07/2000 | low | |||
| 14 | 1586 | 1662 | 77 | 08/08/2000 | moderate | |||
| 15 | 1665 | 1946 | 282 | 15/08/2000 | low | |||
| 16 | 1947 | 2201 | 255 | 15/09/2000 | moderate | |||
| 17 | 2202 | 2220 | 19 | 10/10/2000 | extremely high | |||
| 18 | 2221 | 2293 | 73 | 12/10/2000 | high | |||
| 19 | 2295 | 2411 | 117 | 18/10/2000 | moderate | |||
| 20 | 2412 | 2501 | 90 | 31/10/2000 | low |
| start | end | duration | start date | mean | std dev | cluster | ||
|---|---|---|---|---|---|---|---|---|
| 21 | 2502 | 2549 | 48 | 08/11/2000 | extremely high | |||
| 22 | 2551 | 3028 | 478 | 14/11/2000 | moderate | |||
| 23 | 3029 | 3046 | 18 | 02/01/2001 | extremely high | |||
| 24 | 3047 | 3125 | 79 | 04/01/2001 | moderate | |||
| 25 | 3126 | 3457 | 332 | 11/01/2001 | low | |||
| 26 | 3458 | 3758 | 301 | 16/02/2001 | high | |||
| 27 | 3759 | 3774 | 16 | 20/03/2001 | extremely high | |||
| 28 | 3775 | 4020 | 246 | 22/03/2001 | extremely high | |||
| 29 | 4021 | 4245 | 225 | 19/04/2001 | moderate | |||
| 30 | 4246 | 4285 | 40 | 10/05/2001 | extremely low | |||
| 31 | 4286 | 4302 | 17 | 14/05/2001 | extremely high | |||
| 32 | 4305 | 4320 | 16 | 15/05/2001 | extremely low | |||
| 33 | 4321 | 5393 | 1073 | 21/05/2001 | moderate | |||
| 34 | 5394 | 5427 | 34 | 04/09/2001 | extremely high | |||
| 35 | 5490 | 5562 | 73 | 16/09/2001 | extremely high | |||
| 36 | 5565 | 5580 | 16 | 21/09/2001 | moderate | |||
| 37 | 5581 | 6001 | 421 | 25/09/2001 | high | |||
| 38 | 6002 | 6343 | 342 | 05/11/2001 | moderate | |||
| 39 | 6344 | 6359 | 16 | 07/12/2001 | extremely high | |||
| 40 | 6361 | 6808 | 448 | 13/12/2001 | low | |||
| 41 | 6809 | 8066 | 1258 | 28/01/2002 | moderate | |||
| 42 | 8067 | 8311 | 245 | 30/05/2002 | moderate | |||
| 43 | 8312 | 8531 | 220 | 24/06/2002 | high | |||
| 44 | 8532 | 8772 | 241 | 12/07/2002 | extremely high | |||
| 45 | 8775 | 8877 | 103 | 05/08/2002 | extremely high | |||
| 46 | 8880 | 9341 | 462 | 14/08/2002 | high | |||
| 47 | 9342 | 9507 | 166 | 27/09/2002 | extremely high | |||
| 48 | 9510 | 9525 | 16 | 14/10/2002 | high | |||
| 49 | 9526 | 9982 | 457 | 16/10/2002 | high | |||
| 50 | 9983 | 10004 | 22 | 29/11/2002 | extremely high | |||
| 51 | 10006 | 10066 | 61 | 03/12/2002 | high | |||
| 52 | 10067 | 11004 | 938 | 09/12/2002 | moderate | |||
| 53 | 11005 | 11280 | 276 | 12/03/2003 | high | |||
| 54 | 11281 | 11412 | 132 | 08/04/2003 | low | |||
| 55 | 11415 | 11920 | 506 | 21/04/2003 | moderate | |||
| 56 | 11925 | 12200 | 276 | 07/06/2003 | low | |||
| 57 | 12201 | 12282 | 82 | 03/07/2003 | high | |||
| 58 | 12285 | 12587 | 303 | 11/07/2003 | moderate | |||
| 59 | 12588 | 12881 | 294 | 11/08/2003 | low | |||
| 60 | 12882 | 12927 | 46 | 08/09/2003 | moderate | |||
| 61 | 12930 | 13031 | 102 | 11/09/2003 | low | |||
| 62 | 13032 | 13272 | 241 | 19/09/2003 | moderate | |||
| 63 | 13275 | 13949 | 675 | 10/10/2003 | low | |||
| 64 | 13951 | 14781 | 831 | 16/12/2003 | low | |||
| 65 | 14782 | 14897 | 116 | 10/03/2004 | moderate | |||
| 66 | 14898 | 15352 | 455 | 22/03/2004 | low | |||
| 67 | 15353 | 15507 | 155 | 04/05/2004 | moderate | |||
| 68 | 15510 | 15603 | 94 | 18/05/2004 | low | |||
| 69 | 15604 | 16136 | 533 | 27/05/2004 | low | |||
| 70 | 16137 | 16404 | 268 | 20/07/2004 | moderate | |||
| 71 | 16405 | 16422 | 18 | 13/08/2004 | high | |||
| 72 | 16425 | 17538 | 1114 | 16/08/2004 | low | |||
| 73 | 17539 | 18881 | 1343 | 02/12/2004 | extremely low | |||
| 74 | 18882 | 19092 | 211 | 11/04/2005 | low | |||
| 75 | 19095 | 19977 | 883 | 29/04/2005 | low | |||
| 76 | 19980 | 20066 | 87 | 25/07/2005 | extremely low | |||
| 77 | 20067 | 20876 | 810 | 02/08/2005 | low | |||
| 78 | 20877 | 20981 | 105 | 18/10/2005 | moderate | |||
| 79 | 20982 | 21001 | 20 | 27/10/2005 | high | |||
| 80 | 21002 | 21163 | 162 | 31/10/2005 | low | |||
| 81 | 21164 | 21181 | 18 | 14/11/2005 | moderate | |||
| 82 | 21182 | 21643 | 462 | 16/11/2005 | extremely low | |||
| 83 | 21644 | 21674 | 31 | 30/12/2005 | high | |||
| 84 | 21676 | 21691 | 16 | 05/01/2006 | low | |||
| 85 | 21692 | 22242 | 551 | 06/01/2006 | extremely low | |||
| 86 | 22243 | 22916 | 674 | 03/03/2006 | extremely low | |||
| 87 | 22920 | 22941 | 22 | 08/05/2006 | extremely low | |||
| 88 | 22942 | 23495 | 554 | 10/05/2006 | low | |||
| 89 | 23496 | 23787 | 292 | 03/07/2006 | moderate | |||
| 90 | 23790 | 25111 | 1322 | 31/07/2006 | low |
| start | end | duration | start date | mean | std dev | cluster | ||
|---|---|---|---|---|---|---|---|---|
| 91 | 25112 | 25274 | 163 | 05/12/2006 | extremely low | |||
| 92 | 25276 | 25375 | 100 | 20/12/2006 | extremely low | |||
| 93 | 25376 | 25933 | 558 | 29/12/2006 | extremely low | |||
| 94 | 25934 | 25966 | 33 | 26/02/2007 | high | |||
| 95 | 25967 | 26310 | 344 | 01/03/2007 | low | |||
| 96 | 26311 | 26381 | 71 | 03/04/2007 | extremely low | |||
| 97 | 26385 | 26644 | 260 | 10/04/2007 | low | |||
| 98 | 26645 | 26831 | 187 | 04/05/2007 | extremely low | |||
| 99 | 26832 | 26853 | 22 | 22/05/2007 | moderate | |||
| 100 | 26854 | 26926 | 73 | 24/05/2007 | extremely low | |||
| 101 | 26927 | 27075 | 149 | 01/06/2007 | low | |||
| 102 | 27076 | 27219 | 144 | 15/06/2007 | extremely low | |||
| 103 | 27220 | 27237 | 18 | 28/06/2007 | moderate | |||
| 104 | 27240 | 27296 | 57 | 29/06/2007 | extremely low | |||
| 105 | 27297 | 27325 | 29 | 06/07/2007 | low | |||
| 106 | 27326 | 27406 | 81 | 10/07/2007 | extremely low | |||
| 107 | 27407 | 27491 | 85 | 18/07/2007 | low | |||
| 108 | 27492 | 27735 | 244 | 25/07/2007 | high | |||
| 109 | 27736 | 28521 | 786 | 17/08/2007 | low | |||
| 110 | 28522 | 28829 | 308 | 31/10/2007 | moderate | |||
| 111 | 28831 | 28859 | 29 | 30/11/2007 | low | |||
| 112 | 28861 | 28943 | 83 | 04/12/2007 | extremely low | |||
| 113 | 28944 | 28964 | 21 | 11/12/2007 | high | |||
| 114 | 28966 | 29173 | 208 | 13/12/2007 | low | |||
| 115 | 29174 | 29351 | 178 | 03/01/2008 | high | |||
| 116 | 29352 | 29831 | 480 | 23/01/2008 | moderate | |||
| 117 | 29832 | 30042 | 211 | 10/03/2008 | high | |||
| 118 | 30045 | 30060 | 16 | 31/03/2008 | low | |||
| 119 | 30061 | 30731 | 671 | 02/04/2008 | moderate | |||
| 120 | 30732 | 31043 | 312 | 04/06/2008 | high | |||
| 121 | 31044 | 31110 | 67 | 07/07/2008 | extremely high | |||
| 122 | 31111 | 31487 | 377 | 16/07/2008 | high | |||
| 123 | 31488 | 31558 | 71 | 25/08/2008 | low |
B.3 Oil & Gas
| start | end | duration | start date | mean | std dev | cluster | ||
|---|---|---|---|---|---|---|---|---|
| 1 | 1 | 223 | 223 | 14/02/2000 | - | moderate | ||
| 2 | 224 | 251 | 28 | 06/03/2000 | extremely high | |||
| 3 | 256 | 616 | 361 | 09/03/2000 | high | |||
| 4 | 617 | 1001 | 385 | 24/04/2000 | moderate | |||
| 5 | 1002 | 1167 | 166 | 05/06/2000 | high | |||
| 6 | 1170 | 1251 | 82 | 22/06/2000 | moderate | |||
| 7 | 1252 | 1335 | 84 | 30/06/2000 | high | |||
| 8 | 1336 | 1496 | 161 | 11/07/2000 | moderate | |||
| 9 | 1497 | 1525 | 29 | 26/07/2000 | high | |||
| 10 | 1526 | 1542 | 17 | 31/07/2000 | extremely high | |||
| 11 | 1545 | 1736 | 192 | 03/08/2000 | low | |||
| 12 | 1737 | 2262 | 526 | 22/08/2000 | moderate | |||
| 13 | 2265 | 2337 | 73 | 16/10/2000 | moderate | |||
| 14 | 2340 | 2355 | 16 | 23/10/2000 | moderate | |||
| 15 | 2356 | 2698 | 343 | 26/10/2000 | moderate | |||
| 16 | 2699 | 2720 | 22 | 28/11/2000 | extremely high | |||
| 17 | 2721 | 3238 | 518 | 30/11/2000 | moderate | |||
| 18 | 3239 | 3256 | 18 | 23/01/2001 | extremely high | |||
| 19 | 3257 | 3376 | 120 | 29/01/2001 | moderate | |||
| 20 | 3377 | 3433 | 57 | 09/02/2001 | low | |||
| 21 | 3434 | 3459 | 26 | 14/02/2001 | high | |||
| 22 | 3460 | 3763 | 304 | 16/02/2001 | moderate | |||
| 23 | 3764 | 3781 | 18 | 20/03/2001 | extremely high | |||
| 24 | 3782 | 3942 | 161 | 23/03/2001 | high | |||
| 25 | 3945 | 4150 | 206 | 06/04/2001 | moderate | |||
| 26 | 4151 | 4167 | 17 | 01/05/2001 | extremely high | |||
| 27 | 4170 | 4931 | 762 | 02/05/2001 | moderate | |||
| 28 | 4932 | 5042 | 111 | 17/07/2001 | high | |||
| 29 | 5043 | 5296 | 254 | 27/07/2001 | moderate | |||
| 30 | 5311 | 5426 | 116 | 23/08/2001 | low | |||
| 31 | 5427 | 5551 | 125 | 10/09/2001 | extremely high | |||
| 32 | 5552 | 6086 | 535 | 21/09/2001 | moderate | |||
| 33 | 6087 | 6104 | 18 | 13/11/2001 | extremely high | |||
| 34 | 6106 | 6196 | 91 | 15/11/2001 | high | |||
| 35 | 6197 | 6343 | 147 | 26/11/2001 | moderate | |||
| 36 | 6344 | 6361 | 18 | 07/12/2001 | extremely high | |||
| 37 | 6362 | 7068 | 707 | 13/12/2001 | moderate | |||
| 38 | 7069 | 7482 | 414 | 22/02/2002 | low | |||
| 39 | 7484 | 7606 | 123 | 05/04/2002 | high | |||
| 40 | 7607 | 7796 | 190 | 17/04/2002 | low |
| start | end | duration | start date | mean | std dev | cluster | ||
|---|---|---|---|---|---|---|---|---|
| 41 | 7797 | 8531 | 735 | 03/05/2002 | moderate | |||
| 42 | 8532 | 8772 | 241 | 12/07/2002 | extremely high | |||
| 43 | 8775 | 9676 | 902 | 05/08/2002 | high | |||
| 44 | 9677 | 10343 | 667 | 30/10/2002 | moderate | |||
| 45 | 10344 | 10381 | 38 | 06/01/2003 | moderate | |||
| 46 | 10382 | 10452 | 71 | 09/01/2003 | low | |||
| 47 | 10453 | 10469 | 17 | 15/01/2003 | extremely high | |||
| 48 | 10486 | 10499 | 14 | 22/01/2003 | moderate | |||
| 49 | 10501 | 10649 | 149 | 23/01/2003 | moderate | |||
| 50 | 10651 | 10833 | 183 | 06/02/2003 | moderate | |||
| 51 | 10834 | 10993 | 160 | 25/02/2003 | low | |||
| 52 | 10994 | 11011 | 18 | 11/03/2003 | high | |||
| 53 | 11012 | 11129 | 118 | 13/03/2003 | moderate | |||
| 54 | 11131 | 11213 | 83 | 25/03/2003 | moderate | |||
| 55 | 11214 | 11299 | 86 | 01/04/2003 | moderate | |||
| 56 | 11300 | 11450 | 151 | 09/04/2003 | low | |||
| 57 | 11451 | 11771 | 321 | 24/04/2003 | low | |||
| 58 | 11772 | 12587 | 816 | 23/05/2003 | low | |||
| 59 | 12588 | 13468 | 881 | 11/08/2003 | low | |||
| 60 | 13469 | 13634 | 166 | 29/10/2003 | low | |||
| 61 | 13636 | 13651 | 16 | 14/11/2003 | moderate | |||
| 62 | 13652 | 13933 | 282 | 17/11/2003 | low | |||
| 63 | 13934 | 14297 | 364 | 12/12/2003 | low | |||
| 64 | 14298 | 14776 | 479 | 23/01/2004 | low | |||
| 65 | 14777 | 15400 | 624 | 10/03/2004 | low | |||
| 66 | 15401 | 15417 | 17 | 07/05/2004 | extremely high | |||
| 67 | 15420 | 15780 | 361 | 10/05/2004 | low | |||
| 68 | 15781 | 16256 | 476 | 16/06/2004 | low | |||
| 69 | 16257 | 16500 | 244 | 30/07/2004 | moderate | |||
| 70 | 16501 | 16781 | 281 | 24/08/2004 | low | |||
| 71 | 16782 | 17005 | 224 | 20/09/2004 | low | |||
| 72 | 17006 | 17022 | 17 | 11/10/2004 | extremely high | |||
| 73 | 17025 | 17160 | 136 | 13/10/2004 | low | |||
| 74 | 17161 | 17267 | 107 | 27/10/2004 | moderate | |||
| 75 | 17268 | 18400 | 1133 | 05/11/2004 | low | |||
| 76 | 18401 | 19276 | 876 | 24/02/2005 | moderate | |||
| 77 | 19277 | 19616 | 340 | 18/05/2005 | low | |||
| 78 | 19617 | 19965 | 349 | 20/06/2005 | moderate | |||
| 79 | 19966 | 20351 | 386 | 25/07/2005 | low | |||
| 80 | 20352 | 20627 | 276 | 29/08/2005 | moderate | |||
| 81 | 20628 | 20711 | 84 | 26/09/2005 | low | |||
| 82 | 20712 | 21002 | 291 | 03/10/2005 | high | |||
| 83 | 21003 | 23043 | 2041 | 31/10/2005 | moderate | |||
| 84 | 23044 | 23397 | 354 | 19/05/2006 | high | |||
| 85 | 23400 | 23761 | 362 | 22/06/2006 | moderate | |||
| 86 | 23762 | 24206 | 445 | 28/07/2006 | moderate | |||
| 87 | 24207 | 24477 | 271 | 08/09/2006 | moderate | |||
| 88 | 24480 | 25116 | 637 | 04/10/2006 | moderate | |||
| 89 | 25117 | 25378 | 262 | 05/12/2006 | low | |||
| 90 | 25379 | 25607 | 229 | 29/12/2006 | moderate | |||
| 91 | 25608 | 25931 | 324 | 25/01/2007 | low | |||
| 92 | 25932 | 25947 | 16 | 26/02/2007 | extremely high | |||
| 93 | 25948 | 26192 | 245 | 27/02/2007 | moderate | |||
| 94 | 26193 | 26586 | 394 | 22/03/2007 | low | |||
| 95 | 26587 | 27461 | 875 | 30/04/2007 | moderate | |||
| 96 | 27462 | 27732 | 271 | 23/07/2007 | high | |||
| 97 | 27735 | 27967 | 233 | 16/08/2007 | moderate | |||
| 98 | 27968 | 28335 | 368 | 10/09/2007 | moderate | |||
| 99 | 28336 | 28391 | 56 | 15/10/2007 | low | |||
| 100 | 28392 | 28416 | 25 | 18/10/2007 | extremely high | |||
| 101 | 28417 | 28797 | 381 | 22/10/2007 | high | |||
| 102 | 28798 | 28943 | 146 | 27/11/2007 | low | |||
| 103 | 28944 | 28967 | 24 | 11/12/2007 | high | |||
| 104 | 28968 | 29057 | 90 | 13/12/2007 | moderate | |||
| 105 | 29058 | 29111 | 54 | 21/12/2007 | low | |||
| 106 | 29112 | 29263 | 152 | 27/12/2007 | moderate | |||
| 107 | 29264 | 29354 | 91 | 14/01/2008 | extremely high | |||
| 108 | 29356 | 29876 | 521 | 24/01/2008 | moderate | |||
| 109 | 29877 | 29952 | 76 | 13/03/2008 | high | |||
| 110 | 29955 | 31012 | 1058 | 20/03/2008 | moderate | |||
| 111 | 31013 | 31291 | 279 | 02/07/2008 | high | |||
| 112 | 31292 | 31557 | 266 | 06/08/2008 | moderate |
B.4 Financials
| start | end | duration | start date | mean | std dev | cluster | ||
|---|---|---|---|---|---|---|---|---|
| 1 | 1 | 316 | 316 | 14/02/2000 | - | moderate | ||
| 2 | 317 | 702 | 386 | 15/03/2000 | high | |||
| 3 | 705 | 731 | 27 | 01/05/2000 | low | |||
| 4 | 732 | 970 | 239 | 05/05/2000 | high | |||
| 5 | 971 | 987 | 17 | 30/05/2000 | extremely high | |||
| 6 | 990 | 1076 | 87 | 02/06/2000 | high | |||
| 7 | 1077 | 1092 | 16 | 14/06/2000 | extremely high | |||
| 8 | 1095 | 1110 | 16 | 15/06/2000 | moderate | |||
| 9 | 1111 | 2156 | 1046 | 19/06/2000 | moderate | |||
| 10 | 2157 | 2370 | 214 | 05/10/2000 | high | |||
| 11 | 2371 | 2484 | 114 | 27/10/2000 | moderate | |||
| 12 | 2485 | 2806 | 322 | 07/11/2000 | high | |||
| 13 | 2807 | 2909 | 103 | 08/12/2000 | high | |||
| 14 | 2911 | 3036 | 126 | 20/12/2000 | moderate | |||
| 15 | 3037 | 3062 | 26 | 03/01/2001 | extremely high | |||
| 16 | 3063 | 3258 | 196 | 05/01/2001 | moderate | |||
| 17 | 3259 | 3463 | 205 | 29/01/2001 | low | |||
| 18 | 3464 | 3688 | 225 | 16/02/2001 | high | |||
| 19 | 3689 | 4005 | 317 | 13/03/2001 | high | |||
| 20 | 4020 | 4035 | 16 | 18/04/2001 | moderate | |||
| 21 | 4036 | 4302 | 267 | 20/04/2001 | moderate | |||
| 22 | 4305 | 4437 | 133 | 15/05/2001 | low | |||
| 23 | 4440 | 4870 | 431 | 31/05/2001 | moderate | |||
| 24 | 4871 | 4887 | 17 | 11/07/2001 | high | |||
| 25 | 4890 | 5011 | 122 | 12/07/2001 | low | |||
| 26 | 5012 | 5065 | 54 | 25/07/2001 | low | |||
| 27 | 5066 | 5276 | 211 | 30/07/2001 | low | |||
| 28 | 5277 | 5393 | 117 | 20/08/2001 | moderate | |||
| 29 | 5394 | 5562 | 169 | 04/09/2001 | extremely high | |||
| 30 | 5565 | 5580 | 16 | 21/09/2001 | moderate | |||
| 31 | 5581 | 6001 | 421 | 25/09/2001 | moderate | |||
| 32 | 6002 | 6359 | 358 | 05/11/2001 | moderate | |||
| 33 | 6361 | 6378 | 18 | 13/12/2001 | low | |||
| 34 | 6379 | 6536 | 158 | 14/12/2001 | low | |||
| 35 | 6537 | 6793 | 257 | 31/12/2001 | low | |||
| 36 | 6794 | 7126 | 333 | 25/01/2002 | moderate | |||
| 37 | 7127 | 7587 | 461 | 04/03/2002 | moderate | |||
| 38 | 7590 | 7824 | 235 | 15/04/2002 | low | |||
| 39 | 7825 | 7842 | 18 | 07/05/2002 | high | |||
| 40 | 7845 | 8025 | 181 | 08/05/2002 | moderate | |||
| 41 | 8026 | 8191 | 166 | 28/05/2002 | moderate | |||
| 42 | 8192 | 8606 | 415 | 12/06/2002 | high | |||
| 43 | 8607 | 8682 | 76 | 19/07/2002 | extremely high | |||
| 44 | 8685 | 8772 | 88 | 26/07/2002 | high | |||
| 45 | 8775 | 8821 | 47 | 05/08/2002 | high | |||
| 46 | 8822 | 9056 | 235 | 09/08/2002 | moderate | |||
| 47 | 9057 | 9091 | 35 | 30/08/2002 | extremely high | |||
| 48 | 9092 | 9341 | 250 | 05/09/2002 | high | |||
| 49 | 9342 | 9537 | 196 | 27/09/2002 | extremely high | |||
| 50 | 9540 | 9888 | 349 | 16/10/2002 | high | |||
| 51 | 9901 | 9914 | 14 | 21/11/2002 | low | |||
| 52 | 9916 | 10513 | 598 | 22/11/2002 | moderate | |||
| 53 | 10514 | 11263 | 750 | 23/01/2003 | moderate | |||
| 54 | 11264 | 11305 | 42 | 04/04/2003 | high | |||
| 55 | 11306 | 12487 | 1182 | 09/04/2003 | moderate | |||
| 56 | 12488 | 12507 | 20 | 31/07/2003 | high | |||
| 57 | 12510 | 12525 | 16 | 01/08/2003 | moderate | |||
| 58 | 12526 | 13439 | 914 | 05/08/2003 | low | |||
| 59 | 13441 | 14785 | 1345 | 28/10/2003 | low | |||
| 60 | 14786 | 14897 | 112 | 10/03/2004 | moderate | |||
| 61 | 14898 | 15116 | 219 | 22/03/2004 | low | |||
| 62 | 15117 | 15352 | 236 | 12/04/2004 | moderate | |||
| 63 | 15353 | 15507 | 155 | 04/05/2004 | moderate | |||
| 64 | 15510 | 15525 | 16 | 18/05/2004 | low | |||
| 65 | 15526 | 16404 | 879 | 20/05/2004 | low | |||
| 66 | 16405 | 16422 | 18 | 13/08/2004 | moderate | |||
| 67 | 16425 | 16766 | 342 | 16/08/2004 | low | |||
| 68 | 16767 | 16797 | 31 | 17/09/2004 | moderate | |||
| 69 | 16800 | 16815 | 16 | 21/09/2004 | low | |||
| 70 | 16816 | 16917 | 102 | 23/09/2004 | low |
| start | end | duration | start date | mean | std dev | cluster | ||
|---|---|---|---|---|---|---|---|---|
| 71 | 16920 | 17021 | 102 | 01/10/2004 | low | |||
| 72 | 17022 | 17142 | 121 | 13/10/2004 | moderate | |||
| 73 | 17145 | 17270 | 126 | 25/10/2004 | low | |||
| 74 | 17271 | 17845 | 575 | 05/11/2004 | low | |||
| 75 | 17846 | 18147 | 302 | 31/12/2004 | low | |||
| 76 | 18148 | 18313 | 166 | 31/01/2005 | low | |||
| 77 | 18314 | 18433 | 120 | 15/02/2005 | low | |||
| 78 | 18434 | 18778 | 345 | 28/02/2005 | low | |||
| 79 | 18779 | 18801 | 23 | 31/03/2005 | high | |||
| 80 | 18802 | 19272 | 471 | 04/04/2005 | low | |||
| 81 | 19275 | 19467 | 193 | 17/05/2005 | low | |||
| 82 | 19470 | 20081 | 612 | 06/06/2005 | low | |||
| 83 | 20082 | 21014 | 933 | 03/08/2005 | low | |||
| 84 | 21016 | 21777 | 762 | 01/11/2005 | low | |||
| 85 | 21778 | 21969 | 192 | 13/01/2006 | low | |||
| 86 | 21970 | 22053 | 84 | 03/02/2006 | low | |||
| 87 | 22054 | 22069 | 16 | 13/02/2006 | moderate | |||
| 88 | 22070 | 22795 | 726 | 15/02/2006 | low | |||
| 89 | 22796 | 22842 | 47 | 26/04/2006 | moderate | |||
| 90 | 22845 | 22905 | 61 | 01/05/2006 | low | |||
| 91 | 22906 | 22941 | 36 | 08/05/2006 | low | |||
| 92 | 22942 | 23844 | 903 | 10/05/2006 | low | |||
| 93 | 23845 | 23921 | 77 | 04/08/2006 | low | |||
| 94 | 23922 | 23940 | 19 | 11/08/2006 | moderate | |||
| 95 | 23941 | 24161 | 221 | 15/08/2006 | low | |||
| 96 | 24162 | 25933 | 1772 | 05/09/2006 | low | |||
| 97 | 25934 | 25966 | 33 | 26/02/2007 | high | |||
| 98 | 25967 | 26042 | 76 | 01/03/2007 | moderate | |||
| 99 | 26043 | 26172 | 130 | 08/03/2007 | moderate | |||
| 100 | 26175 | 26191 | 17 | 20/03/2007 | high | |||
| 101 | 26192 | 26216 | 25 | 22/03/2007 | low | |||
| 102 | 26217 | 26307 | 91 | 23/03/2007 | moderate | |||
| 103 | 26310 | 27128 | 819 | 02/04/2007 | low | |||
| 104 | 27129 | 27461 | 333 | 20/06/2007 | moderate | |||
| 105 | 27462 | 27732 | 271 | 23/07/2007 | high | |||
| 106 | 27735 | 28062 | 328 | 16/08/2007 | moderate | |||
| 107 | 28065 | 28311 | 247 | 18/09/2007 | low | |||
| 108 | 28312 | 28521 | 210 | 11/10/2007 | moderate | |||
| 109 | 28522 | 28541 | 20 | 31/10/2007 | extremely high | |||
| 110 | 28545 | 28796 | 252 | 01/11/2007 | high | |||
| 111 | 28797 | 28829 | 33 | 27/11/2007 | extremely high | |||
| 112 | 28831 | 28844 | 14 | 30/11/2007 | moderate | |||
| 113 | 28846 | 28943 | 98 | 03/12/2007 | moderate | |||
| 114 | 28944 | 28982 | 39 | 11/12/2007 | extremely high | |||
| 115 | 28983 | 29203 | 221 | 14/12/2007 | moderate | |||
| 116 | 29204 | 29237 | 34 | 07/01/2008 | extremely high | |||
| 117 | 29238 | 29831 | 594 | 11/01/2008 | high | |||
| 118 | 29832 | 30045 | 214 | 10/03/2008 | extremely high | |||
| 119 | 30046 | 30109 | 64 | 01/04/2008 | high | |||
| 120 | 30110 | 30176 | 67 | 07/04/2008 | moderate | |||
| 121 | 30177 | 30252 | 76 | 11/04/2008 | high | |||
| 122 | 30255 | 30741 | 487 | 18/04/2008 | moderate | |||
| 123 | 30742 | 31043 | 302 | 05/06/2008 | high | |||
| 124 | 31044 | 31122 | 79 | 07/07/2008 | extremely high | |||
| 125 | 31125 | 31470 | 346 | 16/07/2008 | high | |||
| 126 | 31471 | 31557 | 87 | 22/08/2008 | high |
B.5 Healthcare
| start | end | duration | start date | mean | std dev | cluster | ||
|---|---|---|---|---|---|---|---|---|
| 1 | 1 | 73 | 73 | 14/02/2000 | - | high | ||
| 2 | 74 | 133 | 60 | 18/02/2000 | extremely high | |||
| 3 | 136 | 149 | 14 | 28/02/2000 | high | |||
| 4 | 151 | 223 | 73 | 29/02/2000 | moderate | |||
| 5 | 224 | 495 | 272 | 06/03/2000 | very high | |||
| 6 | 496 | 544 | 49 | 05/04/2000 | moderate | |||
| 7 | 545 | 601 | 57 | 12/04/2000 | very high | |||
| 8 | 602 | 1525 | 924 | 18/04/2000 | high | |||
| 9 | 1526 | 1542 | 17 | 31/07/2000 | extremely high | |||
| 10 | 1545 | 1710 | 166 | 03/08/2000 | high | |||
| 11 | 1711 | 1825 | 115 | 21/08/2000 | low | |||
| 12 | 1826 | 1842 | 17 | 30/08/2000 | very high | |||
| 13 | 1845 | 1986 | 142 | 06/09/2000 | moderate | |||
| 14 | 1987 | 3031 | 1045 | 20/09/2000 | high | |||
| 15 | 3032 | 3091 | 60 | 03/01/2001 | very high |
| start | end | duration | start date | mean | std dev | cluster | ||
|---|---|---|---|---|---|---|---|---|
| 16 | 3092 | 3208 | 117 | 09/01/2001 | high | |||
| 17 | 3209 | 3239 | 31 | 19/01/2001 | very high | |||
| 18 | 3241 | 3256 | 16 | 26/01/2001 | high | |||
| 19 | 3257 | 3628 | 372 | 29/01/2001 | moderate | |||
| 20 | 3629 | 3761 | 133 | 06/03/2001 | high | |||
| 21 | 3762 | 3777 | 16 | 20/03/2001 | extremely high | |||
| 22 | 3778 | 4171 | 394 | 22/03/2001 | high | |||
| 23 | 4172 | 4297 | 126 | 03/05/2001 | moderate | |||
| 24 | 4298 | 4314 | 17 | 15/05/2001 | extremely high | |||
| 25 | 4315 | 4645 | 331 | 18/05/2001 | moderate | |||
| 26 | 4646 | 4662 | 17 | 20/06/2001 | very high | |||
| 27 | 4665 | 4680 | 16 | 21/06/2001 | moderate | |||
| 28 | 4681 | 4719 | 39 | 25/06/2001 | moderate | |||
| 29 | 4720 | 4740 | 21 | 27/06/2001 | very high | |||
| 30 | 4755 | 5082 | 328 | 01/07/2001 | high | |||
| 31 | 5085 | 5227 | 143 | 31/07/2001 | low | |||
| 32 | 5228 | 5296 | 69 | 15/08/2001 | high | |||
| 33 | 5311 | 5326 | 16 | 23/08/2001 | moderate | |||
| 34 | 5327 | 5393 | 67 | 24/08/2001 | moderate | |||
| 35 | 5394 | 5549 | 156 | 04/09/2001 | very high | |||
| 36 | 5550 | 5628 | 79 | 20/09/2001 | high | |||
| 37 | 5629 | 6025 | 397 | 28/09/2001 | high | |||
| 38 | 6026 | 6338 | 313 | 06/11/2001 | moderate | |||
| 39 | 6339 | 6354 | 16 | 07/12/2001 | extremely high | |||
| 40 | 6355 | 6622 | 268 | 12/12/2001 | moderate | |||
| 41 | 6623 | 6638 | 16 | 09/01/2002 | extremely high | |||
| 42 | 6639 | 6653 | 15 | 10/01/2002 | low | |||
| 43 | 6654 | 7437 | 784 | 11/01/2002 | moderate | |||
| 44 | 7439 | 7454 | 16 | 02/04/2002 | very high | |||
| 45 | 7455 | 7506 | 52 | 03/04/2002 | low | |||
| 46 | 7507 | 7627 | 121 | 09/04/2002 | moderate | |||
| 47 | 7628 | 7644 | 17 | 18/04/2002 | low | |||
| 48 | 7645 | 7689 | 45 | 19/04/2002 | moderate | |||
| 49 | 7690 | 8092 | 403 | 24/04/2002 | high | |||
| 50 | 8093 | 8424 | 332 | 03/06/2002 | high | |||
| 51 | 8425 | 8770 | 346 | 03/07/2002 | very high | |||
| 52 | 8773 | 8804 | 32 | 05/08/2002 | very high | |||
| 53 | 8805 | 9054 | 250 | 07/08/2002 | high | |||
| 54 | 9055 | 9089 | 35 | 30/08/2002 | very high | |||
| 55 | 9090 | 9564 | 475 | 04/09/2002 | high | |||
| 56 | 9565 | 9690 | 126 | 18/10/2002 | high | |||
| 57 | 9691 | 10062 | 372 | 01/11/2002 | high | |||
| 58 | 10064 | 10451 | 388 | 06/12/2002 | moderate | |||
| 59 | 10452 | 11217 | 766 | 15/01/2003 | high | |||
| 60 | 11219 | 11305 | 87 | 01/04/2003 | high | |||
| 61 | 11308 | 11550 | 243 | 09/04/2003 | high | |||
| 62 | 11551 | 11694 | 144 | 05/05/2003 | moderate | |||
| 63 | 11695 | 11714 | 20 | 16/05/2003 | very high | |||
| 64 | 11715 | 11889 | 175 | 19/05/2003 | high | |||
| 65 | 11890 | 11918 | 29 | 05/06/2003 | extremely high | |||
| 66 | 11923 | 12535 | 613 | 07/06/2003 | high | |||
| 67 | 12538 | 13374 | 837 | 05/08/2003 | moderate | |||
| 68 | 13375 | 13393 | 19 | 21/10/2003 | very high | |||
| 69 | 13394 | 13616 | 223 | 22/10/2003 | moderate | |||
| 70 | 13617 | 13634 | 18 | 12/11/2003 | very high | |||
| 71 | 13635 | 13814 | 180 | 13/11/2003 | moderate | |||
| 72 | 13815 | 14779 | 965 | 02/12/2003 | low | |||
| 73 | 14780 | 15042 | 263 | 10/03/2004 | moderate | |||
| 74 | 15043 | 15200 | 158 | 02/04/2004 | low | |||
| 75 | 15201 | 15595 | 395 | 20/04/2004 | moderate | |||
| 76 | 15598 | 16059 | 462 | 26/05/2004 | low | |||
| 77 | 16060 | 16404 | 345 | 13/07/2004 | moderate | |||
| 78 | 16408 | 16884 | 477 | 13/08/2004 | low | |||
| 79 | 16885 | 16960 | 76 | 29/09/2004 | high | |||
| 80 | 16963 | 16978 | 16 | 06/10/2004 | moderate | |||
| 81 | 16979 | 17227 | 249 | 07/10/2004 | moderate | |||
| 82 | 17228 | 17250 | 23 | 02/11/2004 | very high | |||
| 83 | 17251 | 17697 | 447 | 04/11/2004 | moderate | |||
| 84 | 17699 | 17714 | 16 | 16/12/2004 | very high | |||
| 85 | 17715 | 18346 | 632 | 17/12/2004 | low | |||
| 86 | 18347 | 19086 | 740 | 18/02/2005 | moderate | |||
| 87 | 19087 | 20709 | 1623 | 29/04/2005 | low | |||
| 88 | 20710 | 20889 | 180 | 03/10/2005 | moderate | |||
| 89 | 20890 | 20910 | 21 | 19/10/2005 | high | |||
| 90 | 20911 | 22810 | 1900 | 21/10/2005 | low |
| start | end | duration | start date | mean | std dev | cluster | ||
|---|---|---|---|---|---|---|---|---|
| 91 | 22813 | 22974 | 162 | 27/04/2006 | low | |||
| 92 | 22975 | 23632 | 658 | 12/05/2006 | moderate | |||
| 93 | 23633 | 23650 | 18 | 17/07/2006 | very high | |||
| 94 | 23653 | 23815 | 163 | 18/07/2006 | moderate | |||
| 95 | 23818 | 25471 | 1654 | 02/08/2006 | low | |||
| 96 | 25472 | 25931 | 460 | 11/01/2007 | low | |||
| 97 | 25932 | 25965 | 34 | 26/02/2007 | high | |||
| 98 | 25966 | 26949 | 984 | 01/03/2007 | low | |||
| 99 | 26950 | 27235 | 286 | 04/06/2007 | moderate | |||
| 100 | 27238 | 27436 | 199 | 29/06/2007 | low | |||
| 101 | 27437 | 27733 | 297 | 20/07/2007 | high | |||
| 102 | 27734 | 28090 | 357 | 16/08/2007 | moderate | |||
| 103 | 28093 | 28308 | 216 | 20/09/2007 | low | |||
| 104 | 28309 | 28468 | 160 | 11/10/2007 | moderate | |||
| 105 | 28469 | 28519 | 51 | 25/10/2007 | low | |||
| 106 | 28520 | 28872 | 353 | 31/10/2007 | moderate | |||
| 107 | 28874 | 28941 | 68 | 04/12/2007 | low | |||
| 108 | 28942 | 28962 | 21 | 11/12/2007 | high | |||
| 109 | 28964 | 29184 | 221 | 12/12/2007 | moderate | |||
| 110 | 29185 | 29202 | 18 | 04/01/2008 | very high | |||
| 111 | 29204 | 29321 | 118 | 07/01/2008 | moderate | |||
| 112 | 29322 | 29350 | 29 | 18/01/2008 | very high | |||
| 113 | 29351 | 29856 | 506 | 23/01/2008 | moderate | |||
| 114 | 29857 | 29920 | 64 | 12/03/2008 | high | |||
| 115 | 29923 | 30370 | 448 | 18/03/2008 | moderate | |||
| 116 | 30373 | 30666 | 294 | 30/04/2008 | moderate | |||
| 117 | 30667 | 31041 | 375 | 28/05/2008 | moderate | |||
| 118 | 31042 | 31058 | 17 | 07/07/2008 | extremely high | |||
| 119 | 31059 | 31315 | 257 | 09/07/2008 | high | |||
| 120 | 31318 | 31333 | 16 | 07/08/2008 | low | |||
| 121 | 31334 | 31555 | 222 | 08/08/2008 | moderate |
B.6 Industrials
| start | end | duration | start date | mean | std dev | cluster | ||
|---|---|---|---|---|---|---|---|---|
| 1 | 1 | 67 | 67 | 14/02/2000 | - | moderate | ||
| 2 | 68 | 284 | 217 | 18/02/2000 | high | |||
| 3 | 285 | 482 | 198 | 10/03/2000 | high | |||
| 4 | 483 | 602 | 120 | 04/04/2000 | extremely high | |||
| 5 | 603 | 701 | 99 | 18/04/2000 | high | |||
| 6 | 702 | 720 | 19 | 01/05/2000 | extremely high | |||
| 7 | 721 | 972 | 252 | 05/05/2000 | high | |||
| 8 | 973 | 990 | 18 | 30/05/2000 | extremely high | |||
| 9 | 991 | 1035 | 45 | 05/06/2000 | extremely high | |||
| 10 | 1036 | 1560 | 525 | 12/06/2000 | moderate | |||
| 11 | 1561 | 1812 | 252 | 07/08/2000 | low | |||
| 12 | 1813 | 1860 | 48 | 29/08/2000 | high | |||
| 13 | 1861 | 2157 | 297 | 08/09/2000 | moderate | |||
| 14 | 2158 | 2371 | 214 | 05/10/2000 | high | |||
| 15 | 2372 | 2502 | 131 | 27/10/2000 | moderate | |||
| 16 | 2503 | 2945 | 443 | 08/11/2000 | high | |||
| 17 | 2946 | 3011 | 66 | 22/12/2000 | moderate | |||
| 18 | 3012 | 3062 | 51 | 29/12/2000 | extremely high | |||
| 19 | 3063 | 3243 | 181 | 05/01/2001 | high | |||
| 20 | 3244 | 3374 | 131 | 26/01/2001 | moderate | |||
| 21 | 3375 | 3392 | 18 | 08/02/2001 | extremely low | |||
| 22 | 3393 | 3407 | 15 | 12/02/2001 | moderate | |||
| 23 | 3408 | 3659 | 252 | 13/02/2001 | high | |||
| 24 | 3660 | 3760 | 101 | 09/03/2001 | high | |||
| 25 | 3761 | 3781 | 21 | 20/03/2001 | extremely high | |||
| 26 | 3782 | 3870 | 89 | 23/03/2001 | high | |||
| 27 | 3871 | 4050 | 180 | 02/04/2001 | extremely high | |||
| 28 | 4051 | 4260 | 210 | 23/04/2001 | moderate | |||
| 29 | 4261 | 4286 | 26 | 11/05/2001 | low | |||
| 30 | 4287 | 4305 | 19 | 14/05/2001 | extremely high | |||
| 31 | 4306 | 4320 | 15 | 18/05/2001 | low | |||
| 32 | 4321 | 4870 | 550 | 21/05/2001 | moderate | |||
| 33 | 4871 | 4890 | 20 | 11/07/2001 | extremely high | |||
| 34 | 4891 | 4959 | 69 | 13/07/2001 | moderate | |||
| 35 | 4960 | 5283 | 324 | 19/07/2001 | moderate | |||
| 36 | 5284 | 5327 | 44 | 21/08/2001 | high | |||
| 37 | 5328 | 5394 | 67 | 24/08/2001 | moderate | |||
| 38 | 5395 | 5567 | 173 | 04/09/2001 | extremely high | |||
| 39 | 5568 | 6002 | 435 | 24/09/2001 | high | |||
| 40 | 6003 | 6427 | 425 | 05/11/2001 | moderate |
| start | end | duration | start date | mean | std dev | cluster | ||
|---|---|---|---|---|---|---|---|---|
| 41 | 6428 | 6537 | 110 | 19/12/2001 | low | |||
| 42 | 6538 | 6702 | 165 | 31/12/2001 | moderate | |||
| 43 | 6703 | 6943 | 241 | 16/01/2002 | high | |||
| 44 | 6944 | 7823 | 880 | 08/02/2002 | moderate | |||
| 45 | 7824 | 7845 | 22 | 07/05/2002 | extremely high | |||
| 46 | 7846 | 8082 | 237 | 09/05/2002 | moderate | |||
| 47 | 8083 | 8395 | 313 | 31/05/2002 | high | |||
| 48 | 8396 | 8775 | 380 | 01/07/2002 | extremely high | |||
| 49 | 8776 | 8792 | 17 | 06/08/2002 | high | |||
| 50 | 8793 | 9342 | 550 | 07/08/2002 | high | |||
| 51 | 9343 | 9540 | 198 | 27/09/2002 | extremely high | |||
| 52 | 9541 | 9556 | 16 | 17/10/2002 | high | |||
| 53 | 9557 | 10143 | 587 | 18/10/2002 | high | |||
| 54 | 10144 | 10454 | 311 | 16/12/2002 | moderate | |||
| 55 | 10455 | 10502 | 48 | 15/01/2003 | extremely high | |||
| 56 | 10503 | 11003 | 501 | 23/01/2003 | moderate | |||
| 57 | 11004 | 11223 | 220 | 12/03/2003 | high | |||
| 58 | 11224 | 11264 | 41 | 02/04/2003 | moderate | |||
| 59 | 11265 | 11282 | 18 | 04/04/2003 | extremely high | |||
| 60 | 11283 | 11892 | 610 | 08/04/2003 | moderate | |||
| 61 | 11893 | 11925 | 33 | 05/06/2003 | extremely high | |||
| 62 | 11926 | 12162 | 237 | 09/06/2003 | moderate | |||
| 63 | 12163 | 12210 | 48 | 30/06/2003 | high | |||
| 64 | 12211 | 12226 | 16 | 07/07/2003 | low | |||
| 65 | 12227 | 13275 | 1049 | 08/07/2003 | moderate | |||
| 66 | 13276 | 14736 | 1461 | 13/10/2003 | low | |||
| 67 | 14737 | 14782 | 46 | 05/03/2004 | low | |||
| 68 | 14783 | 14897 | 115 | 10/03/2004 | moderate | |||
| 69 | 14898 | 15557 | 660 | 22/03/2004 | moderate | |||
| 70 | 15558 | 16035 | 478 | 24/05/2004 | low | |||
| 71 | 16036 | 16137 | 102 | 12/07/2004 | low | |||
| 72 | 16138 | 16410 | 273 | 20/07/2004 | moderate | |||
| 73 | 16411 | 17230 | 820 | 16/08/2004 | low | |||
| 74 | 17231 | 17271 | 41 | 02/11/2004 | moderate | |||
| 75 | 17272 | 17716 | 445 | 05/11/2004 | low | |||
| 76 | 17717 | 17806 | 90 | 20/12/2004 | low | |||
| 77 | 17807 | 17847 | 41 | 29/12/2004 | low | |||
| 78 | 17848 | 18882 | 1035 | 31/12/2004 | low | |||
| 79 | 18883 | 19052 | 170 | 11/04/2005 | moderate | |||
| 80 | 19053 | 19283 | 231 | 27/04/2005 | low | |||
| 81 | 19284 | 20877 | 1594 | 18/05/2005 | low | |||
| 82 | 20878 | 20970 | 93 | 18/10/2005 | moderate | |||
| 83 | 20971 | 22845 | 1875 | 27/10/2005 | low | |||
| 84 | 22846 | 22872 | 27 | 02/05/2006 | low | |||
| 85 | 22873 | 22891 | 19 | 03/05/2006 | moderate | |||
| 86 | 22892 | 22941 | 50 | 05/05/2006 | low | |||
| 87 | 22942 | 22962 | 21 | 10/05/2006 | low | |||
| 88 | 22963 | 23730 | 768 | 11/05/2006 | moderate | |||
| 89 | 23731 | 23956 | 226 | 26/07/2006 | moderate | |||
| 90 | 23957 | 24207 | 251 | 16/08/2006 | low | |||
| 91 | 24208 | 24381 | 174 | 08/09/2006 | moderate | |||
| 92 | 24382 | 25579 | 1198 | 26/09/2006 | low | |||
| 93 | 25580 | 25934 | 355 | 23/01/2007 | low | |||
| 94 | 25935 | 25967 | 33 | 26/02/2007 | high | |||
| 95 | 25968 | 26311 | 344 | 01/03/2007 | low | |||
| 96 | 26312 | 26487 | 176 | 03/04/2007 | low | |||
| 97 | 26488 | 26952 | 465 | 19/04/2007 | low | |||
| 98 | 26953 | 27240 | 288 | 04/06/2007 | moderate | |||
| 99 | 27241 | 27432 | 192 | 02/07/2007 | low | |||
| 100 | 27433 | 27639 | 207 | 19/07/2007 | moderate | |||
| 101 | 27640 | 27735 | 96 | 08/08/2007 | high | |||
| 102 | 27736 | 28065 | 330 | 17/08/2007 | moderate | |||
| 103 | 28066 | 28312 | 247 | 19/09/2007 | low | |||
| 104 | 28313 | 28474 | 162 | 11/10/2007 | moderate | |||
| 105 | 28475 | 28522 | 48 | 26/10/2007 | low | |||
| 106 | 28523 | 29056 | 534 | 31/10/2007 | moderate | |||
| 107 | 29057 | 29174 | 118 | 21/12/2007 | moderate | |||
| 108 | 29175 | 29309 | 135 | 03/01/2008 | high | |||
| 109 | 29310 | 29377 | 68 | 17/01/2008 | extremely high | |||
| 110 | 29378 | 29424 | 47 | 25/01/2008 | moderate |
| start | end | duration | start date | mean | std dev | cluster | ||
|---|---|---|---|---|---|---|---|---|
| 111 | 29425 | 29832 | 408 | 30/01/2008 | moderate | |||
| 112 | 29833 | 29955 | 123 | 10/03/2008 | high | |||
| 113 | 29956 | 30152 | 197 | 24/03/2008 | moderate | |||
| 114 | 30153 | 30169 | 17 | 10/04/2008 | extremely high | |||
| 115 | 30170 | 30207 | 38 | 11/04/2008 | low | |||
| 116 | 30208 | 30255 | 48 | 15/04/2008 | high | |||
| 117 | 30256 | 30576 | 321 | 21/04/2008 | moderate | |||
| 118 | 30577 | 30632 | 56 | 19/05/2008 | moderate | |||
| 119 | 30633 | 30747 | 115 | 23/05/2008 | moderate | |||
| 120 | 30748 | 30825 | 78 | 05/06/2008 | high | |||
| 121 | 30826 | 31026 | 201 | 13/06/2008 | moderate | |||
| 122 | 31027 | 31097 | 71 | 03/07/2008 | extremely high | |||
| 123 | 31098 | 31557 | 460 | 15/07/2008 | moderate |
B.7 Consumer Goods
| start | end | duration | start date | mean | std dev | cluster | ||
|---|---|---|---|---|---|---|---|---|
| 1 | 1 | 211 | 211 | 14/02/2000 | - | high | ||
| 2 | 212 | 226 | 15 | 06/03/2000 | high | |||
| 3 | 227 | 244 | 18 | 07/03/2000 | extremely high | |||
| 4 | 245 | 473 | 229 | 08/03/2000 | extremely high | |||
| 5 | 474 | 490 | 17 | 03/04/2000 | extremely high | |||
| 6 | 491 | 602 | 112 | 04/04/2000 | extremely high | |||
| 7 | 603 | 676 | 74 | 18/04/2000 | extremely high | |||
| 8 | 677 | 867 | 191 | 28/04/2000 | high | |||
| 9 | 868 | 924 | 57 | 18/05/2000 | extremely high | |||
| 10 | 925 | 1016 | 92 | 24/05/2000 | high | |||
| 11 | 1017 | 1035 | 19 | 06/06/2000 | extremely high | |||
| 12 | 1036 | 1051 | 16 | 12/06/2000 | low | |||
| 13 | 1052 | 1530 | 479 | 13/06/2000 | high | |||
| 14 | 1531 | 1546 | 16 | 03/08/2000 | moderate | |||
| 15 | 1547 | 1917 | 371 | 04/08/2000 | moderate | |||
| 16 | 1918 | 2217 | 300 | 13/09/2000 | high | |||
| 17 | 2218 | 2355 | 138 | 11/10/2000 | extremely high | |||
| 18 | 2356 | 2879 | 524 | 26/10/2000 | high | |||
| 19 | 2880 | 2913 | 34 | 14/12/2000 | extremely high | |||
| 20 | 2914 | 3037 | 124 | 20/12/2000 | high | |||
| 21 | 3038 | 3062 | 25 | 03/01/2001 | extremely high | |||
| 22 | 3063 | 3271 | 209 | 05/01/2001 | high | |||
| 23 | 3272 | 3289 | 18 | 30/01/2001 | moderate | |||
| 24 | 3290 | 3404 | 115 | 31/01/2001 | moderate | |||
| 25 | 3405 | 3764 | 360 | 12/02/2001 | high | |||
| 26 | 3765 | 3781 | 17 | 20/03/2001 | extremely high | |||
| 27 | 3782 | 3947 | 166 | 23/03/2001 | extremely high | |||
| 28 | 3948 | 4148 | 201 | 09/04/2001 | high | |||
| 29 | 4149 | 4301 | 153 | 01/05/2001 | moderate | |||
| 30 | 4302 | 4320 | 19 | 15/05/2001 | extremely high | |||
| 31 | 4321 | 5185 | 865 | 21/05/2001 | moderate | |||
| 32 | 5186 | 5259 | 74 | 10/08/2001 | low | |||
| 33 | 5260 | 5427 | 168 | 17/08/2001 | high | |||
| 34 | 5428 | 5582 | 155 | 10/09/2001 | extremely high | |||
| 35 | 5583 | 6049 | 467 | 25/09/2001 | high | |||
| 36 | 6050 | 6532 | 483 | 08/11/2001 | moderate | |||
| 37 | 6533 | 6586 | 54 | 31/12/2001 | high | |||
| 38 | 6587 | 6899 | 313 | 07/01/2002 | moderate | |||
| 39 | 6900 | 6931 | 32 | 05/02/2002 | high | |||
| 40 | 6932 | 6946 | 15 | 08/02/2002 | moderate | |||
| 41 | 6947 | 7187 | 241 | 11/02/2002 | moderate | |||
| 42 | 7188 | 8067 | 880 | 08/03/2002 | moderate | |||
| 43 | 8068 | 8235 | 168 | 30/05/2002 | high | |||
| 44 | 8236 | 8307 | 72 | 17/06/2002 | low | |||
| 45 | 8308 | 8497 | 190 | 21/06/2002 | high | |||
| 46 | 8498 | 8776 | 279 | 10/07/2002 | extremely high | |||
| 47 | 8777 | 9027 | 251 | 06/08/2002 | high | |||
| 48 | 9028 | 9061 | 34 | 28/08/2002 | extremely high | |||
| 49 | 9062 | 9233 | 172 | 03/09/2002 | high | |||
| 50 | 9234 | 9466 | 233 | 18/09/2002 | extremely high | |||
| 51 | 9467 | 9693 | 227 | 10/10/2002 | high | |||
| 52 | 9694 | 10291 | 598 | 01/11/2002 | high | |||
| 53 | 10292 | 10307 | 16 | 31/12/2002 | extremely high | |||
| 54 | 10308 | 10514 | 207 | 02/01/2003 | moderate | |||
| 55 | 10515 | 11114 | 600 | 23/01/2003 | high | |||
| 56 | 11115 | 11266 | 152 | 21/03/2003 | extremely high | |||
| 57 | 11267 | 11520 | 254 | 07/04/2003 | high | |||
| 58 | 11521 | 11536 | 16 | 01/05/2003 | high | |||
| 59 | 11537 | 12193 | 657 | 02/05/2003 | moderate | |||
| 60 | 12194 | 12549 | 356 | 02/07/2003 | high |
| start | end | duration | start date | mean | std dev | cluster | ||
|---|---|---|---|---|---|---|---|---|
| 61 | 12550 | 12702 | 153 | 06/08/2003 | low | |||
| 62 | 12703 | 13727 | 1025 | 20/08/2003 | moderate | |||
| 63 | 13728 | 13877 | 150 | 24/11/2003 | low | |||
| 64 | 13878 | 14774 | 897 | 09/12/2003 | low | |||
| 65 | 14775 | 14896 | 122 | 09/03/2004 | high | |||
| 66 | 14897 | 14911 | 15 | 22/03/2004 | low | |||
| 67 | 14912 | 15203 | 292 | 23/03/2004 | low | |||
| 68 | 15204 | 15482 | 279 | 20/04/2004 | high | |||
| 69 | 15483 | 15895 | 413 | 17/05/2004 | low | |||
| 70 | 15896 | 15915 | 20 | 25/06/2004 | high | |||
| 71 | 15916 | 16137 | 222 | 29/06/2004 | low | |||
| 72 | 16138 | 16230 | 93 | 20/07/2004 | high | |||
| 73 | 16231 | 16764 | 534 | 29/07/2004 | low | |||
| 74 | 16765 | 16785 | 21 | 17/09/2004 | extremely high | |||
| 75 | 16786 | 16802 | 17 | 21/09/2004 | moderate | |||
| 76 | 16803 | 17230 | 428 | 22/09/2004 | moderate | |||
| 77 | 17231 | 17259 | 29 | 02/11/2004 | high | |||
| 78 | 17260 | 17748 | 489 | 04/11/2004 | low | |||
| 79 | 17749 | 17806 | 58 | 22/12/2004 | low | |||
| 80 | 17807 | 17847 | 41 | 29/12/2004 | low | |||
| 81 | 17848 | 18138 | 291 | 31/12/2004 | moderate | |||
| 82 | 18139 | 18239 | 101 | 31/01/2005 | low | |||
| 83 | 18240 | 18274 | 35 | 08/02/2005 | moderate | |||
| 84 | 18275 | 18892 | 618 | 11/02/2005 | low | |||
| 85 | 18893 | 18982 | 90 | 12/04/2005 | moderate | |||
| 86 | 18983 | 19275 | 293 | 20/04/2005 | high | |||
| 87 | 19276 | 20847 | 1572 | 18/05/2005 | moderate | |||
| 88 | 20848 | 21001 | 154 | 14/10/2005 | high | |||
| 89 | 21002 | 21496 | 495 | 31/10/2005 | low | |||
| 90 | 21497 | 21824 | 328 | 16/12/2005 | low | |||
| 91 | 21825 | 21961 | 137 | 19/01/2006 | moderate | |||
| 92 | 21962 | 22722 | 761 | 03/02/2006 | low | |||
| 93 | 22723 | 22767 | 45 | 19/04/2006 | moderate | |||
| 94 | 22768 | 22786 | 19 | 24/04/2006 | high | |||
| 95 | 22787 | 22906 | 120 | 26/04/2006 | low | |||
| 96 | 22907 | 22942 | 36 | 08/05/2006 | low | |||
| 97 | 22943 | 23291 | 349 | 10/05/2006 | moderate | |||
| 98 | 23292 | 23940 | 649 | 13/06/2006 | moderate | |||
| 99 | 23941 | 24147 | 207 | 15/08/2006 | low | |||
| 100 | 24148 | 24970 | 823 | 01/09/2006 | low | |||
| 101 | 24971 | 25004 | 34 | 20/11/2006 | low | |||
| 102 | 25005 | 25099 | 95 | 22/11/2006 | moderate | |||
| 103 | 25100 | 25376 | 277 | 04/12/2006 | low | |||
| 104 | 25377 | 25414 | 38 | 29/12/2006 | moderate | |||
| 105 | 25415 | 25934 | 520 | 05/01/2007 | low | |||
| 106 | 25935 | 25967 | 33 | 26/02/2007 | extremely high | |||
| 107 | 25968 | 26042 | 75 | 01/03/2007 | moderate | |||
| 108 | 26043 | 26082 | 40 | 08/03/2007 | low | |||
| 109 | 26083 | 26186 | 104 | 12/03/2007 | moderate | |||
| 110 | 26187 | 26217 | 31 | 21/03/2007 | low | |||
| 111 | 26218 | 26311 | 94 | 23/03/2007 | moderate | |||
| 112 | 26312 | 26382 | 71 | 03/04/2007 | low | |||
| 113 | 26383 | 26842 | 460 | 10/04/2007 | low | |||
| 114 | 26843 | 27219 | 377 | 23/05/2007 | moderate | |||
| 115 | 27220 | 27241 | 22 | 28/06/2007 | high | |||
| 116 | 27242 | 27492 | 251 | 02/07/2007 | moderate | |||
| 117 | 27493 | 27736 | 244 | 25/07/2007 | high | |||
| 118 | 27737 | 27975 | 239 | 17/08/2007 | high | |||
| 119 | 27976 | 28065 | 90 | 11/09/2007 | moderate | |||
| 120 | 28066 | 28392 | 327 | 19/09/2007 | low | |||
| 121 | 28393 | 28522 | 130 | 18/10/2007 | moderate | |||
| 122 | 28523 | 28801 | 279 | 31/10/2007 | high | |||
| 123 | 28802 | 28944 | 143 | 28/11/2007 | moderate | |||
| 124 | 28945 | 28966 | 22 | 11/12/2007 | extremely high | |||
| 125 | 28967 | 29142 | 176 | 13/12/2007 | moderate | |||
| 126 | 29143 | 29314 | 172 | 31/12/2007 | high | |||
| 127 | 29315 | 29353 | 39 | 18/01/2008 | extremely high | |||
| 128 | 29354 | 29862 | 509 | 23/01/2008 | high | |||
| 129 | 29863 | 29955 | 93 | 12/03/2008 | extremely high | |||
| 130 | 29956 | 30380 | 425 | 24/03/2008 | moderate | |||
| 131 | 30381 | 30702 | 322 | 01/05/2008 | moderate | |||
| 132 | 30703 | 31042 | 340 | 30/05/2008 | high | |||
| 133 | 31043 | 31320 | 278 | 07/07/2008 | high | |||
| 134 | 31321 | 31336 | 16 | 08/08/2008 | moderate | |||
| 135 | 31337 | 31557 | 221 | 11/08/2008 | high |
B.8 Technology
| start | end | duration | start date | mean | std dev | cluster | ||
|---|---|---|---|---|---|---|---|---|
| 1 | 1 | 282 | 282 | 14/02/2000 | - | high | ||
| 2 | 283 | 464 | 182 | 10/03/2000 | very high | |||
| 3 | 465 | 630 | 166 | 31/03/2000 | extremely high | |||
| 4 | 631 | 971 | 341 | 25/04/2000 | very high | |||
| 5 | 972 | 990 | 19 | 30/05/2000 | extremely high | |||
| 6 | 991 | 1482 | 492 | 05/06/2000 | high | |||
| 7 | 1483 | 1546 | 64 | 25/07/2000 | very high | |||
| 8 | 1547 | 1827 | 281 | 04/08/2000 | moderate | |||
| 9 | 1828 | 1917 | 90 | 30/08/2000 | high | |||
| 10 | 1918 | 2202 | 285 | 13/09/2000 | very high | |||
| 11 | 2203 | 2235 | 33 | 10/10/2000 | extremely high | |||
| 12 | 2236 | 2275 | 40 | 13/10/2000 | high | |||
| 13 | 2276 | 2295 | 20 | 17/10/2000 | extremely high | |||
| 14 | 2296 | 2824 | 529 | 19/10/2000 | very high | |||
| 15 | 2825 | 2879 | 55 | 11/12/2000 | very high | |||
| 16 | 2880 | 2942 | 63 | 14/12/2000 | extremely high | |||
| 17 | 2943 | 3031 | 89 | 22/12/2000 | very high | |||
| 18 | 3032 | 3047 | 16 | 03/01/2001 | extremely high | |||
| 19 | 3048 | 3242 | 195 | 04/01/2001 | very high | |||
| 20 | 3243 | 3295 | 53 | 26/01/2001 | moderate | |||
| 21 | 3296 | 3389 | 94 | 31/01/2001 | very high | |||
| 22 | 3390 | 3644 | 255 | 09/02/2001 | very high | |||
| 23 | 3645 | 3760 | 116 | 07/03/2001 | extremely high | |||
| 24 | 3761 | 3781 | 21 | 20/03/2001 | extremely high | |||
| 25 | 3782 | 3870 | 89 | 23/03/2001 | very high | |||
| 26 | 3871 | 4050 | 180 | 02/04/2001 | extremely high | |||
| 27 | 4051 | 4066 | 16 | 23/04/2001 | high | |||
| 28 | 4067 | 4757 | 691 | 24/04/2001 | very high | |||
| 29 | 4758 | 4811 | 54 | 02/07/2001 | moderate | |||
| 30 | 4812 | 4830 | 19 | 05/07/2001 | extremely high | |||
| 31 | 4831 | 4950 | 120 | 09/07/2001 | very high | |||
| 32 | 4951 | 5232 | 282 | 19/07/2001 | high | |||
| 33 | 5233 | 5283 | 51 | 15/08/2001 | high | |||
| 34 | 5284 | 5327 | 44 | 21/08/2001 | extremely high | |||
| 35 | 5328 | 5382 | 55 | 24/08/2001 | high | |||
| 36 | 5383 | 5565 | 183 | 29/08/2001 | extremely high | |||
| 37 | 5566 | 5775 | 210 | 24/09/2001 | very high | |||
| 38 | 5776 | 6076 | 301 | 15/10/2001 | very high | |||
| 39 | 6077 | 6094 | 18 | 13/11/2001 | high | |||
| 40 | 6095 | 7044 | 950 | 14/11/2001 | high | |||
| 41 | 7045 | 7217 | 173 | 20/02/2002 | very high | |||
| 42 | 7218 | 7484 | 267 | 13/03/2002 | moderate | |||
| 43 | 7485 | 7590 | 106 | 05/04/2002 | very high | |||
| 44 | 7591 | 7606 | 16 | 16/04/2002 | moderate | |||
| 45 | 7607 | 7752 | 146 | 17/04/2002 | moderate | |||
| 46 | 7753 | 7826 | 74 | 30/04/2002 | very high | |||
| 47 | 7827 | 7890 | 64 | 07/05/2002 | extremely high | |||
| 48 | 7891 | 7914 | 24 | 14/05/2002 | high | |||
| 49 | 7915 | 8106 | 192 | 15/05/2002 | high | |||
| 50 | 8107 | 9507 | 1401 | 04/06/2002 | very high | |||
| 51 | 9508 | 9540 | 33 | 14/10/2002 | extremely high | |||
| 52 | 9541 | 10068 | 528 | 17/10/2002 | very high | |||
| 53 | 10069 | 10188 | 120 | 09/12/2002 | high | |||
| 54 | 10189 | 10469 | 281 | 19/12/2002 | moderate | |||
| 55 | 10470 | 10502 | 33 | 16/01/2003 | extremely high | |||
| 56 | 10503 | 11189 | 687 | 23/01/2003 | high | |||
| 57 | 11190 | 11371 | 182 | 28/03/2003 | high | |||
| 58 | 11372 | 12201 | 830 | 16/04/2003 | moderate | |||
| 59 | 12202 | 12360 | 159 | 03/07/2003 | high | |||
| 60 | 12361 | 13122 | 762 | 21/07/2003 | moderate | |||
| 61 | 13123 | 13171 | 49 | 29/09/2003 | very high | |||
| 62 | 13172 | 13502 | 331 | 03/10/2003 | moderate | |||
| 63 | 13503 | 13604 | 102 | 03/11/2003 | low | |||
| 64 | 13605 | 14627 | 1023 | 11/11/2003 | moderate | |||
| 65 | 14628 | 14729 | 102 | 25/02/2004 | low | |||
| 66 | 14730 | 15324 | 595 | 04/03/2004 | moderate | |||
| 67 | 15325 | 15510 | 186 | 30/04/2004 | high | |||
| 68 | 15511 | 15530 | 20 | 19/05/2004 | moderate | |||
| 69 | 15531 | 15942 | 412 | 20/05/2004 | low | |||
| 70 | 15943 | 16346 | 404 | 30/06/2004 | moderate |
| start | end | duration | start date | mean | std dev | cluster | ||
|---|---|---|---|---|---|---|---|---|
| 71 | 16347 | 16361 | 15 | 09/08/2004 | moderate | |||
| 72 | 16362 | 16380 | 19 | 10/08/2004 | extremely high | |||
| 73 | 16381 | 16396 | 16 | 12/08/2004 | low | |||
| 74 | 16397 | 16572 | 176 | 13/08/2004 | low | |||
| 75 | 16573 | 16695 | 123 | 30/08/2004 | moderate | |||
| 76 | 16696 | 16901 | 206 | 13/09/2004 | low | |||
| 77 | 16902 | 16920 | 19 | 30/09/2004 | high | |||
| 78 | 16921 | 17621 | 701 | 04/10/2004 | low | |||
| 79 | 17622 | 17748 | 127 | 09/12/2004 | low | |||
| 80 | 17749 | 17847 | 99 | 22/12/2004 | low | |||
| 81 | 17848 | 18927 | 1080 | 31/12/2004 | low | |||
| 82 | 18928 | 19051 | 124 | 14/04/2005 | moderate | |||
| 83 | 19052 | 21052 | 2001 | 27/04/2005 | low | |||
| 84 | 21053 | 21779 | 727 | 03/11/2005 | low | |||
| 85 | 21780 | 21961 | 182 | 13/01/2006 | moderate | |||
| 86 | 21962 | 22947 | 986 | 03/02/2006 | low | |||
| 87 | 22948 | 23096 | 149 | 10/05/2006 | moderate | |||
| 88 | 23097 | 23232 | 136 | 24/05/2006 | low | |||
| 89 | 23233 | 24000 | 768 | 07/06/2006 | moderate | |||
| 90 | 24001 | 24295 | 295 | 21/08/2006 | low | |||
| 91 | 24296 | 24315 | 20 | 18/09/2006 | high | |||
| 92 | 24316 | 24332 | 17 | 20/09/2006 | low | |||
| 93 | 24333 | 25276 | 944 | 21/09/2006 | low | |||
| 94 | 25277 | 25379 | 103 | 20/12/2006 | low | |||
| 95 | 25380 | 25414 | 35 | 29/12/2006 | moderate | |||
| 96 | 25415 | 25697 | 283 | 05/01/2007 | low | |||
| 97 | 25698 | 25934 | 237 | 02/02/2007 | low | |||
| 98 | 25935 | 26011 | 77 | 26/02/2007 | moderate | |||
| 99 | 26012 | 26026 | 15 | 06/03/2007 | low | |||
| 100 | 26027 | 26311 | 285 | 07/03/2007 | low | |||
| 101 | 26312 | 26841 | 530 | 03/04/2007 | low | |||
| 102 | 26842 | 27255 | 414 | 23/05/2007 | low | |||
| 103 | 27256 | 27400 | 145 | 03/07/2007 | low | |||
| 104 | 27401 | 27712 | 312 | 17/07/2007 | moderate | |||
| 105 | 27713 | 27735 | 23 | 15/08/2007 | very high | |||
| 106 | 27736 | 27942 | 207 | 17/08/2007 | low | |||
| 107 | 27943 | 27975 | 33 | 06/09/2007 | high | |||
| 108 | 27976 | 28302 | 327 | 11/09/2007 | low | |||
| 109 | 28303 | 28602 | 300 | 10/10/2007 | moderate | |||
| 110 | 28603 | 28803 | 201 | 07/11/2007 | high | |||
| 111 | 28804 | 28944 | 141 | 28/11/2007 | low | |||
| 112 | 28945 | 28963 | 19 | 11/12/2007 | very high | |||
| 113 | 28964 | 29174 | 211 | 12/12/2007 | moderate | |||
| 114 | 29175 | 29324 | 150 | 03/01/2008 | high | |||
| 115 | 29325 | 29357 | 33 | 18/01/2008 | extremely high | |||
| 116 | 29358 | 29504 | 147 | 24/01/2008 | moderate | |||
| 117 | 29505 | 29521 | 17 | 06/02/2008 | very high | |||
| 118 | 29522 | 29832 | 311 | 08/02/2008 | moderate | |||
| 119 | 29833 | 29955 | 123 | 10/03/2008 | high | |||
| 120 | 29956 | 30317 | 362 | 24/03/2008 | moderate | |||
| 121 | 30318 | 30380 | 63 | 25/04/2008 | moderate | |||
| 122 | 30381 | 30747 | 367 | 01/05/2008 | moderate | |||
| 123 | 30748 | 31072 | 325 | 05/06/2008 | moderate | |||
| 124 | 31073 | 31095 | 23 | 10/07/2008 | very high | |||
| 125 | 31096 | 31245 | 150 | 15/07/2008 | moderate | |||
| 126 | 31246 | 31557 | 312 | 01/08/2008 | moderate |
B.9 Telecommunications
| start | end | duration | start date | mean | std dev | cluster | ||
|---|---|---|---|---|---|---|---|---|
| 1 | 1 | 162 | 162 | 14/02/2000 | - | moderate | ||
| 2 | 163 | 183 | 21 | 29/02/2000 | extremely high | |||
| 3 | 184 | 477 | 294 | 02/03/2000 | moderate | |||
| 4 | 478 | 630 | 153 | 03/04/2000 | extremely high | |||
| 5 | 631 | 701 | 71 | 25/04/2000 | moderate | |||
| 6 | 702 | 720 | 19 | 01/05/2000 | extremely high | |||
| 7 | 721 | 867 | 147 | 05/05/2000 | moderate | |||
| 8 | 868 | 956 | 89 | 18/05/2000 | high | |||
| 9 | 957 | 975 | 19 | 26/05/2000 | extremely high | |||
| 10 | 976 | 991 | 16 | 02/06/2000 | low | |||
| 11 | 992 | 1482 | 491 | 05/06/2000 | moderate | |||
| 12 | 1483 | 1515 | 33 | 25/07/2000 | extremely high | |||
| 13 | 1516 | 2067 | 552 | 31/07/2000 | moderate | |||
| 14 | 2068 | 2433 | 366 | 27/09/2000 | high | |||
| 15 | 2434 | 2582 | 149 | 02/11/2000 | moderate |
| start | end | duration | start date | mean | std dev | cluster | ||
|---|---|---|---|---|---|---|---|---|
| 16 | 2583 | 2598 | 16 | 16/11/2000 | extremely high | |||
| 17 | 2599 | 2879 | 281 | 17/11/2000 | moderate | |||
| 18 | 2880 | 2934 | 55 | 14/12/2000 | extremely high | |||
| 19 | 2935 | 3029 | 95 | 21/12/2000 | moderate | |||
| 20 | 3030 | 3047 | 18 | 02/01/2001 | extremely high | |||
| 21 | 3048 | 3228 | 181 | 04/01/2001 | high | |||
| 22 | 3229 | 3244 | 16 | 23/01/2001 | extremely high | |||
| 23 | 3245 | 3496 | 252 | 26/01/2001 | high | |||
| 24 | 3497 | 3761 | 265 | 22/02/2001 | high | |||
| 25 | 3762 | 3960 | 199 | 20/03/2001 | extremely high | |||
| 26 | 3961 | 4230 | 270 | 10/04/2001 | high | |||
| 27 | 4231 | 4246 | 16 | 09/05/2001 | low | |||
| 28 | 4247 | 4586 | 340 | 10/05/2001 | moderate | |||
| 29 | 4587 | 4605 | 19 | 14/06/2001 | extremely high | |||
| 30 | 4606 | 5394 | 789 | 18/06/2001 | moderate | |||
| 31 | 5395 | 5582 | 188 | 04/09/2001 | extremely high | |||
| 32 | 5583 | 5718 | 136 | 25/09/2001 | high | |||
| 33 | 5719 | 6050 | 332 | 09/10/2001 | moderate | |||
| 34 | 6051 | 6809 | 759 | 08/11/2001 | moderate | |||
| 35 | 6810 | 6931 | 122 | 28/01/2002 | high | |||
| 36 | 6932 | 7201 | 270 | 08/02/2002 | moderate | |||
| 37 | 7202 | 7527 | 326 | 12/03/2002 | moderate | |||
| 38 | 7528 | 7646 | 119 | 10/04/2002 | extremely high | |||
| 39 | 7647 | 7665 | 19 | 19/04/2002 | extremely high | |||
| 40 | 7666 | 8216 | 551 | 23/04/2002 | high | |||
| 41 | 8217 | 8235 | 19 | 13/06/2002 | extremely high | |||
| 42 | 8236 | 8337 | 102 | 17/06/2002 | high | |||
| 43 | 8338 | 8366 | 29 | 25/06/2002 | extremely high | |||
| 44 | 8367 | 8605 | 239 | 27/06/2002 | extremely high | |||
| 45 | 8606 | 8656 | 51 | 19/07/2002 | extremely high | |||
| 46 | 8657 | 8793 | 137 | 25/07/2002 | extremely high | |||
| 47 | 8794 | 8871 | 78 | 07/08/2002 | high | |||
| 48 | 8872 | 8925 | 54 | 14/08/2002 | extremely high | |||
| 49 | 8926 | 9042 | 117 | 20/08/2002 | high | |||
| 50 | 9043 | 9093 | 51 | 29/08/2002 | extremely high | |||
| 51 | 9094 | 9326 | 233 | 05/09/2002 | high | |||
| 52 | 9327 | 9707 | 381 | 26/09/2002 | extremely high | |||
| 53 | 9708 | 10307 | 600 | 04/11/2002 | high | |||
| 54 | 10308 | 10334 | 27 | 02/01/2003 | low | |||
| 55 | 10335 | 10368 | 34 | 03/01/2003 | extremely high | |||
| 56 | 10369 | 10469 | 101 | 08/01/2003 | high | |||
| 57 | 10470 | 10503 | 34 | 16/01/2003 | extremely high | |||
| 58 | 10504 | 11306 | 803 | 23/01/2003 | high | |||
| 59 | 11307 | 11407 | 101 | 09/04/2003 | moderate | |||
| 60 | 11408 | 11446 | 39 | 21/04/2003 | extremely high | |||
| 61 | 11447 | 11521 | 75 | 24/04/2003 | high | |||
| 62 | 11522 | 11628 | 107 | 01/05/2003 | high | |||
| 63 | 11629 | 12357 | 729 | 12/05/2003 | moderate | |||
| 64 | 12358 | 12454 | 97 | 18/07/2003 | high | |||
| 65 | 12455 | 12766 | 312 | 29/07/2003 | moderate | |||
| 66 | 12767 | 13032 | 266 | 27/08/2003 | low | |||
| 67 | 13033 | 13051 | 19 | 19/09/2003 | extremely high | |||
| 68 | 13052 | 13429 | 378 | 23/09/2003 | moderate | |||
| 69 | 13430 | 13471 | 42 | 27/10/2003 | low | |||
| 70 | 13472 | 13557 | 86 | 30/10/2003 | moderate | |||
| 71 | 13558 | 14125 | 568 | 06/11/2003 | low | |||
| 72 | 14126 | 14189 | 64 | 02/01/2004 | moderate | |||
| 73 | 14190 | 14206 | 17 | 08/01/2004 | extremely high | |||
| 74 | 14207 | 14221 | 15 | 14/01/2004 | moderate | |||
| 75 | 14222 | 15767 | 1546 | 15/01/2004 | moderate | |||
| 76 | 15768 | 16167 | 400 | 15/06/2004 | low | |||
| 77 | 16168 | 16200 | 33 | 22/07/2004 | extremely high | |||
| 78 | 16201 | 16216 | 16 | 27/07/2004 | low | |||
| 79 | 16217 | 16899 | 683 | 28/07/2004 | low | |||
| 80 | 16900 | 16920 | 21 | 30/09/2004 | high | |||
| 81 | 16921 | 17749 | 829 | 04/10/2004 | low | |||
| 82 | 17750 | 17847 | 98 | 22/12/2004 | low | |||
| 83 | 17848 | 22064 | 4217 | 31/12/2004 | low | |||
| 84 | 22065 | 22081 | 17 | 13/02/2006 | extremely high | |||
| 85 | 22082 | 23697 | 1616 | 16/02/2006 | low | |||
| 86 | 23698 | 23820 | 123 | 21/07/2006 | high | |||
| 87 | 23821 | 23890 | 70 | 03/08/2006 | moderate | |||
| 88 | 23891 | 24172 | 282 | 09/08/2006 | low | |||
| 89 | 24173 | 25589 | 1417 | 06/09/2006 | low | |||
| 90 | 25590 | 25623 | 34 | 23/01/2007 | high |
| start | end | duration | start date | mean | std dev | cluster | ||
|---|---|---|---|---|---|---|---|---|
| 91 | 25624 | 25941 | 318 | 26/01/2007 | low | |||
| 92 | 25942 | 25967 | 26 | 27/02/2007 | extremely high | |||
| 93 | 25968 | 26042 | 75 | 01/03/2007 | moderate | |||
| 94 | 26043 | 26268 | 226 | 08/03/2007 | low | |||
| 95 | 26269 | 26952 | 684 | 29/03/2007 | low | |||
| 96 | 26953 | 27075 | 123 | 04/06/2007 | moderate | |||
| 97 | 27076 | 27243 | 168 | 15/06/2007 | moderate | |||
| 98 | 27244 | 27447 | 204 | 02/07/2007 | low | |||
| 99 | 27448 | 27735 | 288 | 20/07/2007 | high | |||
| 100 | 27736 | 28096 | 361 | 17/08/2007 | moderate | |||
| 101 | 28097 | 28300 | 204 | 21/09/2007 | low | |||
| 102 | 28301 | 28410 | 110 | 10/10/2007 | moderate | |||
| 103 | 28411 | 28892 | 482 | 22/10/2007 | moderate | |||
| 104 | 28893 | 28933 | 41 | 06/12/2007 | low | |||
| 105 | 28934 | 28951 | 18 | 10/12/2007 | extremely high | |||
| 106 | 28952 | 28966 | 15 | 12/12/2007 | moderate | |||
| 107 | 28967 | 29204 | 238 | 13/12/2007 | moderate | |||
| 108 | 29205 | 29353 | 149 | 07/01/2008 | extremely high | |||
| 109 | 29354 | 29481 | 128 | 23/01/2008 | high | |||
| 110 | 29482 | 29609 | 128 | 05/02/2008 | moderate | |||
| 111 | 29610 | 29627 | 18 | 15/02/2008 | extremely high | |||
| 112 | 29628 | 30123 | 496 | 20/02/2008 | high | |||
| 113 | 30124 | 30366 | 243 | 08/04/2008 | moderate | |||
| 114 | 30367 | 30525 | 159 | 30/04/2008 | moderate | |||
| 115 | 30526 | 30700 | 175 | 14/05/2008 | moderate | |||
| 116 | 30701 | 30750 | 50 | 30/05/2008 | extremely high | |||
| 117 | 30751 | 31111 | 361 | 06/06/2008 | high | |||
| 118 | 31112 | 31557 | 446 | 16/07/2008 | high |
B.10 Utilities
| start | end | duration | start date | mean | std dev | cluster | ||
|---|---|---|---|---|---|---|---|---|
| 1 | 1 | 74 | 74 | 14/02/2000 | - | low | ||
| 2 | 75 | 313 | 239 | 18/02/2000 | high | |||
| 3 | 314 | 336 | 23 | 14/03/2000 | extremely high | |||
| 4 | 337 | 482 | 146 | 16/03/2000 | high | |||
| 5 | 483 | 615 | 133 | 04/04/2000 | extremely high | |||
| 6 | 616 | 631 | 16 | 24/04/2000 | low | |||
| 7 | 632 | 1080 | 449 | 25/04/2000 | high | |||
| 8 | 1081 | 1242 | 162 | 15/06/2000 | moderate | |||
| 9 | 1243 | 1275 | 33 | 29/06/2000 | extremely high | |||
| 10 | 1276 | 1527 | 252 | 05/07/2000 | moderate | |||
| 11 | 1528 | 1551 | 24 | 31/07/2000 | extremely high | |||
| 12 | 1552 | 1711 | 160 | 04/08/2000 | low | |||
| 13 | 1712 | 1752 | 41 | 21/08/2000 | low | |||
| 14 | 1753 | 1791 | 39 | 23/08/2000 | high | |||
| 15 | 1792 | 1810 | 19 | 28/08/2000 | low | |||
| 16 | 1811 | 1830 | 20 | 29/08/2000 | extremely high | |||
| 17 | 1831 | 2190 | 360 | 06/09/2000 | high | |||
| 18 | 2191 | 2222 | 32 | 10/10/2000 | high | |||
| 19 | 2223 | 2322 | 100 | 12/10/2000 | moderate | |||
| 20 | 2323 | 2418 | 96 | 20/10/2000 | high | |||
| 21 | 2419 | 3029 | 611 | 01/11/2000 | moderate | |||
| 22 | 3030 | 3048 | 19 | 02/01/2001 | extremely high | |||
| 23 | 3049 | 3224 | 176 | 04/01/2001 | extremely high | |||
| 24 | 3225 | 3244 | 20 | 22/01/2001 | extremely high | |||
| 25 | 3245 | 3762 | 518 | 26/01/2001 | high | |||
| 26 | 3763 | 3781 | 19 | 20/03/2001 | extremely high | |||
| 27 | 3782 | 3934 | 153 | 23/03/2001 | extremely high | |||
| 28 | 3935 | 3960 | 26 | 06/04/2001 | extremely high | |||
| 29 | 3961 | 4095 | 135 | 10/04/2001 | high | |||
| 30 | 4096 | 4305 | 210 | 26/04/2001 | moderate | |||
| 31 | 4306 | 4321 | 16 | 18/05/2001 | low | |||
| 32 | 4322 | 4360 | 39 | 21/05/2001 | low | |||
| 33 | 4361 | 4572 | 212 | 23/05/2001 | high | |||
| 34 | 4573 | 4651 | 79 | 13/06/2001 | extremely high | |||
| 35 | 4652 | 4977 | 326 | 21/06/2001 | moderate | |||
| 36 | 4978 | 4998 | 21 | 20/07/2001 | extremely high | |||
| 37 | 4999 | 5239 | 241 | 24/07/2001 | high | |||
| 38 | 5240 | 5382 | 143 | 16/08/2001 | low | |||
| 39 | 5383 | 5555 | 173 | 29/08/2001 | extremely high | |||
| 40 | 5556 | 5592 | 37 | 21/09/2001 | low |
| start | end | duration | start date | mean | std dev | cluster | ||
|---|---|---|---|---|---|---|---|---|
| 41 | 5593 | 5625 | 33 | 25/09/2001 | extremely high | |||
| 42 | 5626 | 5687 | 62 | 28/09/2001 | high | |||
| 43 | 5688 | 6242 | 555 | 04/10/2001 | high | |||
| 44 | 6243 | 6344 | 102 | 29/11/2001 | moderate | |||
| 45 | 6345 | 6362 | 18 | 07/12/2001 | extremely high | |||
| 46 | 6363 | 6558 | 196 | 13/12/2001 | high | |||
| 47 | 6559 | 6674 | 116 | 03/01/2002 | low | |||
| 48 | 6675 | 6725 | 51 | 14/01/2002 | high | |||
| 49 | 6726 | 6811 | 86 | 18/01/2002 | low | |||
| 50 | 6812 | 6886 | 75 | 29/01/2002 | high | |||
| 51 | 6887 | 7917 | 1031 | 05/02/2002 | moderate | |||
| 52 | 7918 | 8487 | 570 | 15/05/2002 | high | |||
| 53 | 8488 | 8659 | 172 | 09/07/2002 | extremely high | |||
| 54 | 8660 | 8735 | 76 | 25/07/2002 | extremely high | |||
| 55 | 8736 | 9057 | 322 | 01/08/2002 | high | |||
| 56 | 9058 | 9402 | 345 | 30/08/2002 | extremely high | |||
| 57 | 9403 | 9466 | 64 | 03/10/2002 | extremely high | |||
| 58 | 9467 | 9590 | 124 | 10/10/2002 | extremely high | |||
| 59 | 9591 | 9826 | 236 | 22/10/2002 | extremely high | |||
| 60 | 9827 | 10082 | 256 | 14/11/2002 | high | |||
| 61 | 10083 | 10331 | 249 | 10/12/2002 | low | |||
| 62 | 10332 | 10352 | 21 | 03/01/2003 | extremely high | |||
| 63 | 10353 | 10893 | 541 | 07/01/2003 | high | |||
| 64 | 10894 | 11476 | 583 | 03/03/2003 | moderate | |||
| 65 | 11477 | 11513 | 37 | 28/04/2003 | low | |||
| 66 | 11514 | 11530 | 17 | 30/04/2003 | extremely high | |||
| 67 | 11531 | 11697 | 167 | 01/05/2003 | low | |||
| 68 | 11698 | 11925 | 228 | 16/05/2003 | high | |||
| 69 | 11926 | 12549 | 624 | 09/06/2003 | moderate | |||
| 70 | 12550 | 13593 | 1044 | 06/08/2003 | low | |||
| 71 | 13594 | 13649 | 56 | 11/11/2003 | low | |||
| 72 | 13650 | 13728 | 79 | 14/11/2003 | moderate | |||
| 73 | 13729 | 14339 | 611 | 24/11/2003 | low | |||
| 74 | 14340 | 14416 | 77 | 27/01/2004 | moderate | |||
| 75 | 14417 | 14436 | 20 | 04/02/2004 | low | |||
| 76 | 14437 | 14786 | 350 | 05/02/2004 | low | |||
| 77 | 14787 | 14905 | 119 | 10/03/2004 | moderate | |||
| 78 | 14906 | 15106 | 201 | 22/03/2004 | low | |||
| 79 | 15107 | 15138 | 32 | 12/04/2004 | extremely high | |||
| 80 | 15139 | 15385 | 247 | 14/04/2004 | low | |||
| 81 | 15386 | 15405 | 20 | 06/05/2004 | extremely high | |||
| 82 | 15406 | 15437 | 32 | 10/05/2004 | high | |||
| 83 | 15438 | 15600 | 163 | 12/05/2004 | moderate | |||
| 84 | 15601 | 16331 | 731 | 27/05/2004 | low | |||
| 85 | 16332 | 17127 | 796 | 06/08/2004 | low | |||
| 86 | 17128 | 17177 | 50 | 22/10/2004 | moderate | |||
| 87 | 17178 | 17230 | 53 | 28/10/2004 | low | |||
| 88 | 17231 | 17271 | 41 | 02/11/2004 | high | |||
| 89 | 17272 | 17354 | 83 | 05/11/2004 | low | |||
| 90 | 17355 | 18359 | 1005 | 12/11/2004 | low | |||
| 91 | 18360 | 19227 | 868 | 18/02/2005 | moderate | |||
| 92 | 19228 | 19246 | 19 | 12/05/2005 | extremely high | |||
| 93 | 19247 | 19932 | 686 | 16/05/2005 | low | |||
| 94 | 19933 | 20160 | 228 | 20/07/2005 | high | |||
| 95 | 20161 | 20722 | 562 | 11/08/2005 | low | |||
| 96 | 20723 | 21138 | 416 | 04/10/2005 | high | |||
| 97 | 21139 | 22544 | 1406 | 11/11/2005 | low | |||
| 98 | 22545 | 23468 | 924 | 31/03/2006 | moderate | |||
| 99 | 23469 | 23987 | 519 | 29/06/2006 | low | |||
| 100 | 23988 | 25919 | 1932 | 18/08/2006 | low | |||
| 101 | 25920 | 25949 | 30 | 23/02/2007 | extremely high | |||
| 102 | 25950 | 26011 | 62 | 27/02/2007 | high | |||
| 103 | 26012 | 26296 | 285 | 06/03/2007 | low | |||
| 104 | 26297 | 26842 | 546 | 02/04/2007 | low | |||
| 105 | 26843 | 27473 | 631 | 23/05/2007 | high | |||
| 106 | 27474 | 27735 | 262 | 24/07/2007 | extremely high | |||
| 107 | 27736 | 27915 | 180 | 17/08/2007 | high | |||
| 108 | 27916 | 29266 | 1351 | 05/09/2007 | moderate | |||
| 109 | 29267 | 29324 | 58 | 15/01/2008 | high | |||
| 110 | 29325 | 29356 | 32 | 18/01/2008 | extremely high | |||
| 111 | 29357 | 29477 | 121 | 24/01/2008 | high | |||
| 112 | 29478 | 29729 | 252 | 05/02/2008 | moderate | |||
| 113 | 29730 | 29944 | 215 | 28/02/2008 | high | |||
| 114 | 29945 | 31037 | 1093 | 20/03/2008 | moderate | |||
| 115 | 31038 | 31175 | 138 | 07/07/2008 | extremely high | |||
| 116 | 31176 | 31381 | 206 | 24/07/2008 | high | |||
| 117 | 31382 | 31557 | 176 | 14/08/2008 | low |
References
- [1] J. C. Wong, H. Lian, and S. A. Cheong, “Detecting macroeconomic phases in the Dow Jones Industrial Average time series”, Physica A, vol. 388, no. 21, pp. 4635–4645, 2009.
- [2] Formerly Taqtic, SIRCA, https://taqtic.sirca.org.au/TaqTic/. Now available as Thomson Reuters Datascope Tick History, https://tickhistory.datascope.reuters.com/.
- [3] E. G. Carlstein, H.-G. Müller, and D. Siegmund, Change-Point Problems, Lecture Notes-Monograph Series, vol. 23. Institute of Mathematical Statistics, 1994.
- [4] J. Chen and A. K. Gupta, Parametric Statistical Change Point Analysis. Birkhäuser, 2000.
- [5] N. R. Pal and S. K. Pal, “A review on image segmentation techniques”, Pattern Recognition, vol. 26, no. 9, pp. 1277–1294, 1993.
- [6] Y. J. Zhang, “A survey on evaluation methods for image segmentation”, Pattern Recognition, vol. 29, no. 8, pp. 1335–1346, 1996.
- [7] Jerome V. Braun and Hans-Georg Müller, “Statistical Methods for DNA Sequence Segmentation”, Statistical Science 13(2), 142–162 (1998).
- [8] M. Lexa, V. Snášel and I. Zelinka, “Data-mining protein structure by clustering, segmentation and vvolutionary algorithms”, Studies in Computational Intelligence, vol. 204, pp. 221–248, 2009.
- [9] R. E. Quandt, “The estimation of the parameters of a linear regression system obeying two separate regimes”, Journal of the American Statistical Association, vol. 53, no. 284, pp. 873–880, 1958.
- [10] R. E. Quandt, “Tests of the hypothesis that a linear regression system obeys two separate regimes”, Journal of the American Statistical Association, vol. 55, no. 290, pp. 324–330, 1960.
- [11] J. Huizinga and F. S. Mishkin, “Monetary policy regime shifts and the unusual behavior of real interest rates”, NBER Working Paper 1678, 1985. Available at http://www.nber.org/papers/w1678.pdf.
- [12] R. E. Quandt, “A new approach to estimating switching regressions”, Journal of the American Statistical Association, vol. 67, no. 338, 1972.
- [13] S. M. Goldfeld and R. E. Quandt, “A Markov model for switching regressions”, Journal of Econometrics, vol. 1, no. 1, pp. 3–15, 1973.
- [14] J. D. Hamilton, “A new approach to the economic analysis of nonstationary time series and the business cycle”, Econometrica, vol. 57, no. 2, pp. 357–384, 1989.
- [15] J. Driffill, “Changes in regime and the term structure”, Journal of Economics Dynamics and Control, vol. 16, no. 1, pp. 165–173, 1992.
- [16] D. W. K. Andrews and R. C. Fair, “Inference in nonlinear econometric models with structural change”, The Review of Economic Studies, vol. 55, no. 4, pp. 615–639, 1988.
- [17] D. W. K. Andrews, “Tests for parameter instability and structural change with unknown change point”, Econometrica, vol. 61, no. 4, pp. 821–856, 1993.
- [18] J. Bai, “Least squares estimation of a shift in linear processes”, Journal of Time Series Analysis, vol. 15, no. 5, pp. 453–472, 1994.
- [19] J. Bai, “Least absolute deviation estimation of a shift”, Econometric Theory, vol. 11, no. 3, pp. 403–436, 1995.
- [20] T. T.-L. Chong, “Partial parameter consistency in a misspecified structural change model”, Economics Letters, vol. 49, no. 4, pp. 351–357, 1995.
- [21] C. R. Loader, “Change point estimation using nonparametric regression”, Annals of Statistics, vol. 24, no. 4, pp. 1667–1678, 1996.
- [22] J. Bai, “Estimation of a change point in multiple regression models”, The Review of Economics and Statistics, vol. 79, no. 4, pp. 551–563, 1997.
- [23] R. L. Lumsdaine and D. H. Papell, “Multiple Trend Breaks and the Unit-Root Hypothesis”, Review of Economics and Statistics, vol. 79, no. 2, pp. 212–218, 1997.
- [24] J. Bai and P. Perron, “Estimating and Testing Linear Models with Multiple Structural Changes”, Econometrica, vol. 66, no. 1, pp. 47–78, 1998.
- [25] M. Lavielle and E. Moulines, “Least-squares estimation of an unknown number of shifts in a time series”, Journal of Time Series Analysis, vol. 21, no. 1, pp. 33–59, 2000.
- [26] T. T.-L. Chong, “Structural change in AR(1) models”, Econometric Theory, vol. 17, no. 1, pp. 87–155, 2001.
- [27] B. E. Hansen, “The new econometrics of structural change: dating breaks in U.S. labor productivity”, The Journal of Economic Perspectives, vol. 15, no. 4, pp. 117–128, 2001.
- [28] E. Zivot and D. W. K. Andrews, “Further evidence on the Great Crash, the oil-price shock, and the unit-root hypothesis”, Journal of Business and Economic Statistics, vol. 20, no. 1, pp. 25–44, 2002.
- [29] J. Bai and P. Perron, “Computation and analysis of multiple structural change models”, Journal of Applied Econometrics, vol. 18, no. 1, pp. 1–21, 2003.
- [30] P. Perron and X. Zhu, “Structural breaks with deterministic and stochastic trends”, Journal of Econometrics, vol. 129, no. 1–2, pp. 65–119, 2005.
- [31] W. Guo and M. E. Wohar, “Identifying regime changes in market volatility”, Journal of Financial Research, vol. 29, no. 1, pp. 79–93, 2006.
- [32] J. L. Carrion-i-Silvestre, D. Kim, and P. Perron, “GLS-based unit root tests with multiple structural breaks under both the null and the alternative hypotheses”, Econometric Theory, vol. 25, no. 6, pp. 1754–1792, 2009.
- [33] C.-J. Kim and C. R. Nelson, “Has the US economy become more stable? A Bayesian approach based on a Markov-switching model of business cycle”, Review of Economics and Statistics, vol. 81, no. 4, pp. 608–616, 1999.
- [34] R. C. Merton, “The impact on option pricing of specification error in the underlying stock price returns”, The Journal of Finance, vol. 31, no. 2, pp. 333–350, 1976.
- [35] R. C. Merton, “Option pricing when underlying stock returns are discontinuous”, Journal of Financial Economics, vol. 3, no. 1–2, pp. 125–144, 1976.
- [36] C. A. Ball and W. N. Torous, “A simplified jump process for common stock returns”, Journal of Financial and Quantitative Analysis, vol. 18, no. 1, pp. 53–65, 1983.
- [37] C. A. Ball and W. N. Torous, “On jumps in common stock prices and their impact on call option pricing”, Journal of Finance, vol. 40, no. 1, pp. 155–173, 1985.
- [38] P. Jorion, “On jump processes in the foreign exchange and stock markets”, Review of Financial Studies, vol. 1, no. 4, pp. 427–445, 1988.
- [39] J. M. Poterba and L. H. Summers, “The persistence of volatility and stock market fluctuations”, The American Economic Review, vol. 76, no. 5, pp. 1142–1151, 1986.
- [40] C. G. Lamoureux and W. D. Lastrapes, “Persistence in variance, structural change, and the GARCH model”, Journal of Business & Economic Statistics, vol. 8, no. 2, pp. 225–234, 1990.
- [41] J. J. Murphy, Technical Analysis of the Financial Markets, 2nd Edition, New York Institute of Finance, 1999.
- [42] F.-L. Chung, T.-C. Fu, R. Luk, and V. Ng, “Evolutionary time series segmentation for stock data mining”, Proceedings of the IEEE International Conference on Data Mining 2002 (9–12 Dec 2002, Maebashi City, Japan), pp. 83–90, 2002.
- [43] J. Jiang, Z. Zhang, and H. Wang, “A new segmentation algorithm to stock time series based on PIP approach”, Proceedings of the Third IEEE International Conference on Wireless Communications, Networking and Mobile Computing 2007 (21–25 Sep 2007, Shanghai, China), pp. 5609–5612, 2007.
- [44] J. Xie and W.-Y. Yan, “Pattern-based characterization of time series”, International Journal of Information and Systems Science, vol. 3, no. 3, pp. 479–491, 2007.
- [45] Z. Zhang, J. Jiang, X. Liu, W. C. Lau, H. Wang, S. Wang, X. Song, and D. Xu, “Pattern recognition in stock data based on a new segmentation algorithm”, Lecture Notes in Computer Science, vol. 14798, pp. 520–525, 2007.
- [46] G. Vaglica, F. Lillo, E. Moro, and R. N. Mantegna, “Scaling laws of strategic behavior and size heterogeneity in agent dynamics”, Physical Review E, vol. 77, no. 3, 036110, 2008.
- [47] B. Tóth, F. Lillo, and J. D. Farmer, “Segmentation algorithm for nonstationary compound Poisson processes”, arXiv:1001.2549, 14 Jan 2010.
- [48] P. Bernaola-Galván, R. Román-Roldán, and J. L. Oliver, “Compositional segmentation and long-range fractal correlations in DNA sequences”, Physical Review E, vol. 53, no. 5, pp. 5181–5189, 1996.
- [49] R. Román-Roldán, P. Bernaola-Galván, and J. L. Oliver, “Sequence compositional complexity of DNA through an entropic segmentation method”, Physical Review Letters, vol. 80, no. 6, pp. 1344–1347, 1998.
- [50] J. Lin, “Divergence measures based on the Shannon entropy”, IEEE Trans. Infor. Theory, vol. 37, no. 1, pp. 145–151, 1991.
- [51] S.-A. Cheong, P. Stodghill, D. J. Schneider, S. W. Cartinhour, and C. R. Myers, “Extending the recursive Jensen-Shannon segmentation of biological sequences”, q-bio/0904.2466.
- [52] W. Li, “New stopping criteria for segmenting DNA sequences”, Physical Review Letters, vol. 86, no. 25, pp. 5815–5818, 2001.
- [53] W. Li, “DNA segmentation as a model selection process”, Proceedings of the International Conference on Research in Computational Molecular Biology (RECOMB), pp. 204–210, 2001.
- [54] S.-A. Cheong, P. Stodghill, D. J. Schneider, S. W. Cartinhour, and C. R. Myers, “The context sensitivity problem in biological sequence segmentation”, q-bio/0904.2668.
- [55] R. K. Azad, J. S. Rao, W. Li, and R. Ramaswamy, “Simplifying the mosaic description of DNA sequences”, Physical Review E, vol. 66, no. 3, 031913, 2002.
- [56] B. Mirkin, Mathematical Classification and Clustering, Kluwer (AA Dordrecht, The Netherlands), 1996.
- [57] Classification and Clustering for Knowledge Discovery, edited by S. K. Halgamuge and L. P. Wang, Springer (Berlin, Germany), 2005.
- [58] A. Jain, M. Murty, and P. Flynn, “Data clustering: A review”, ACM Computing Surveys, vol. 31, no. 3, pp. 264–323, 1999.
- [59] J. MacQueen, “Some methods for classification and analysis of multivariate observations”, Proceedings of the 5th Berkeley Symposium on Mathematical Statistics and Probability, vol. 1, pp. 281–297, 1967.
- [60] S. P. Lloyd, “Least squares quantization in PCM”, IEEE Transactions on Information Theory, vol. 28, no. 2, pp. 129–137, 1982.
- [61] P. H. A. Sneath, “The application of computers to taxonomy”, Journal of General Microbiology, vol. 17, pp. 201–226, 1957.
- [62] S. C. Johnson, “Hierarchical clustering schemes”, Psychometrika, vol. 32, no. 3, pp. 241–254, 1967.
- [63] J. J. van Wijk and E. R. van Selow, “Cluster and calendar based visualization of time series data”, Proceedings of the 1999 IEEE Symposium on Information Visualization (Oct 24–29, 1999, San Francisco, California, USA), pp. 4–9, 1999.
- [64] T. C. Fu, F. L. Chung, R. Luk, and C.-M. Ng, “Financial time series indexing based on low resolution clustering”, Proceedings of the ICDM 2004 Workshop on Temporal Data Mining: Algorithms, Theory and Applications (Nov 1–4, 2004, Brighton, UK), pp. 4–13, 2004.
- [65] F. B. Baker, “Numerical taxonomy for educational researchers”, Review of Educational Research, vol. 42, no. 3, pp. 345–358, 1972.
- [66] F. B. Baker, “Stability of two hierarchical grouping techniques case 1: sensitivity to data errors”, Journal of the American Statistical Association, vol. 69, no. 346, pp. 440–445, 1974.
- [67] G. A. Churchill, “Stochastic models for heterogeneous DNA sequences”, Bulletin of Mathematical Biology, vol. 51, no. 1, pp. 79–94, 1989.
- [68] G. A. Churchill, “Hidden Markov chains and the analysis of genome structure”, Computers & Chemistry, vol. 16, no. 2, pp. 107–115, 1992.
- [69] L. Bize, F. Muri, F. Samson, F. Rodolphe, S. D. Ehrlich, B. Prum, and P. Bessières, “Search gene transfers on Bacillus subtilis using hidden Markov models”, in Proceedings of the Third Annual International Conference on Research in Computational Molecular Biology (RECOMB 1999, Lyon, France, April 11–14, 1999), edited by S. Istrail, P. Pevzner, and M. Waterman, pp. 43–49, ACM Press (New York, NY, USA, 1999).
- [70] L. Peshkin and M. S. Gelfand, “Segmentation of yeast DNA using hidden Markov models”, Bioinformatics, vol. 15, no. 12, pp. 980–986, 1999.
- [71] R. J. Boys, D. A. Henderson, and D. J. Wilkinson, “Detecting homogeneous segments in DNA sequences by using hidden Markov models”, Applied Statistics, vol. 49, no. 2, pp. 269–285, 2000.
- [72] P. Nicolas, L. Bize, F. Muri, M. Hoebeke, F. Rodolphe, S. D. Ehrlich, B. Prum, and P. Bessières, “Mining Bacillus subtilis chromosome heterogenuities using hidden Markov models”, Nucleic Acids Research, vol. 30, no. 6, pp. 1418–1426, 2002.
- [73] R. J. Boys and D. A. Henderson, “A Bayesian approach to DNA sequence segmentation”, Biometrics, vol. 60, pp. 573–588, 2004.
- [74] N. Frank, B. González-Hermosillo, and H. Hesse, “Transmission of liquidity shocks: Evidence from the 2007 Subprime Crisis”, IMF Working Paper WP/08/200, August 2008. Available from http://www.banquefrance.eu/fr/publications/telechar/seminaires/2008/Hermosillo-gonzales.pdf.
- [75] R. K. Green, “Imperfect information and the housing finance crisis: A descriptive overview”, Journal of Housing Economics, vol. 17, pp. 262–271, 2008.
- [76] S. Lohr, “In modeling risk, the human factor was left out”, The New York Times, 5 November 2008.
- [77] A. W. Lo, “Hedge funds, systemic risk, and the financial crisis of 2007–2008”, written testimony prepared for the US House of Representatives Committee on Oversight and Government Reform, 13 November 2008.
- [78] A. W. Lo, “Regulatory reform in the wake of the financial crisis of 2007–2008”, Journal of Financial Economic Policy, vol. 1, no. 1, pp. 4–43, 2009.
- [79] S. Neven, “Subprime crisis: the layout of a puzzle”, Masters in Economics and Business thesis, Erasmus University (Rotterdam, the Netherlands), 11 May 2009.
- [80] C. Tudor, “Understanding the roots of the US Subprime Crisis and its subsequent effects”, The Romanian Economic Journal, no. 31, pp. 115–148, 2009.
- [81] H. A. David and H. N. Nagaraja, Order Statistics, third edition. Wiley, 2003.
- [82] B. C. Arnold, N. Balakrishnan, and H. N. Nagaraja, A First Course in Order Statistics, Society for Industrial and Applied Mathematics, 2008.
- [83] Investopedia, “What does a cut in interest rates mean for the stock market?”, http://www.investopedia.com/ask/answers/132.asp.