Aerodynamical Effects in Snow Crystal Growth
K. G. Libbrecht111e-mail address: kgl@caltech.edu
Department of Physics, California Institute of Technology
Pasadena, California 91125
Abstract: We review several aspects of aerodynamics that affect the growth, morphology, and symmetry of snow crystals. We derive quantitative estimates for aerodynamical forces that orient falling snow crystals, estimate how air flow around snow crystals affects their growth rates (the ventilation effect), and examine how the combination of orientation and growth modification can stabilize or destabilize different growth behaviors. Special attention is given to the formation of triangular snow crystals, since it appears that aerodynamical effects are responsible for producing this unusual morphology, both in nature and in the laboratory.
1 Introduction
Complex patterns and structures often emerge spontaneously when crystals grow, yielding a great variety of faceted, branched, and other forms. This is readily seen, for example, in the well-known morphological diversity found in naturally occurring mineral crystals [1]. Suppressing structure formation is often desired when growing large commercial crystals, but exploiting the phenomenon provides a possible route for using nanoscale self-assembly as a manufacturing tool [2]. Whether the goal is to reduce, enhance, control, or simply understand structure formation, there has been considerable interest from a number of fronts in characterizing the detailed physical mechanisms that produce ordered structures from disordered precursors during solidification [3, 4].
The molecular dynamics involved in the condensation of disordered molecules into a regular crystalline lattice is remarkably complex, involving a number of many-body effects over different length scales and time scales [5]. As a result, calculating dynamical properties like crystal growth rates from first principles is generally not yet possible. Predicting growth morphologies has also proven quite difficult, with few overarching theories connecting the many disparate physical mechanisms that govern growth behaviors. A principal challenge is developing the theoretical tools that connect detailed two-body molecular interactions to many-body crystal growth dynamics.
A well-known and oft-studied example of structure formation during crystal growth is the formation of ice crystals from water vapor. In the atmosphere these are called snow crystals, and they fall from the clouds with a remarkable diversity of morphologies, including simple plate-like and columnar forms, elaborately branched plates, hollow columns, capped columns, and many others [6]. Surprisingly, a number of easily observed aspects of snow crystal growth – for example, that the growth morphology depends strongly on temperature – have not yet been adequately explained at even a basic qualitative level (for a review, see [7]). We have been studying the detailed physics of snow crystals as a case study in crystal growth, with the hope that developing a comprehensive mechanistic model for this remarkably rich physical system will shed light on the more general problem of structure formation during solidification [7].
The growth and morphology of snow crystals are mainly determined by two processes – the diffusion of water molecules through the surrounding air, and the surface molecular dynamics (also called attachment kinetics) that describes how water molecules join the crystalline lattice. Diffusion leads to a growth instability that produces dendritic branching and other complex structures, while attachment kinetics promotes the growth of smooth, faceted structures. The two effects in concert yield the observed rich variety of faceted and branched snow crystal morphologies. The physics of particle diffusion is well understood, and numerical methods have been developed to solve the diffusion equation and model the morphologies of growing crystals [8, 9, 10]. What is missing is an accurate parameterization of the attachment kinetics that goes into these models, and without this one cannot explain many aspects of the growth of snow crystals [7].
While diffusion and attachment kinetics are the dominant physical mechanisms that describe snow crystal growth, several other processes can be important as well, including: 1) the diffusion of latent heat generated at the growing ice surface, 2) nucleation dynamics that may lead to twinned or other polycrystalline structures, 3) chemical impurities on the ice surface that affect the attachment kinetics, and 4) air flow around a growing crystal that affect particle diffusion and thus alter growth rates. To obtain a complete picture of snow crystal growth, and to accurately interpret experimental observations, we must examine all the relevant physical processes involved.
The present paper focuses on how aerodynamics affects snow crystal growth and morphologies. This subject has been examined by a number of researchers in the past (e.g. [11, 12, 13, 14]), and we examine four main areas here:
Crystal Orientation - how aerodynamic forces orient falling snow crystals. We present derivations of quantitative estimates for the various forces involved and estimate when air turbulence prevents snow crystal orientation.
The Ventilation Effect - how crystal growth rates are altered by air flow. From the theory for diffusion-limited growth, we derive quantitative estimates for changes in growth as a function of air flow, and we examine under what circumstances aerodynamics is an important factor.
Snow Crystal Symmetry - how aerodynamics can stabilize growth rates to promote the growth of symmetrical snow crystals. We look at how aerodynamics affects the formation of flat snow crystal plates, stellar snow crystals with arms of equal length, and other morphologies.
Triangular Snow Crystals - how aerodynamics can produce a growth instability that promotes the formation of triangular snow crystals. We describe a model in which aerodynamical effects result in the formation of snow crystals with trigonal morphologies that are readily seen in the laboratory and in nature.
Our goal with this paper is to review the most relevant theoretical tools and empirical results that describe how aerodynamics affects snow crystal growth. While analytical and computational methods have been developed that model fluid flow in great detail, we focus here on simple derivations and rough approximations that give one an overarching physical understanding for which processes are most important in different circumstances.
2 Crystal Orientation
The orientation of objects moving through fluids has been extensively studied for many decades, and here we outline some basic results most relevant to the case of snow crystals growing in air.
2.1 Aerodynamic Drag
At low Reynolds number, when there is no turbulence in the flow, we have Stokes drag [15]
where is the flow velocity, is the dynamic viscosity of the air, and is the hydrodynamic radius of the object. For a spherical object, is equal to the radius of the sphere. (See Appendix I for values of various physical quantities.)
At high Reynolds number, the fluid flow becomes turbulent and the drag is proportional to the square of the velocity [15]
where is the projected area of the object, is the air density, and is a dimensionless drag coefficient. There is considerable variation in a thin disk has a high value of while a streamlined body (essentially the cross-section of a fish) has [16].
Note that we can derive the formula for turbulent drag in a crude fashion rather simply from Newton’s law. If we assume that air striking our object essentially comes to a halt, then
which equals the above expression up to the numerical factor .
At intermediate velocities one can use the formula for with the assumption that depends on the Reynolds number and detailed parameterizations for are available [14]. For a rough approximation we can take the total drag force as the sum of the two components above, and for a disk this becomes (assuming
where is the disk radius. The two components of are equal when where we take
2.2 Terminal velocity
The terminal velocity comes from equating
where is the mass of a falling snow crystal and is the gravitational acceleration. (We assume .) Using both components of yields a quadratic equation for For small crystals we can ignore and the terminal velocity of a thin disk of thickness becomes
For larger crystals we can ignore , giving
The transition from Stokes to turbulent drag produces a shift from to which occurs near
In the high-Reynolds-number regime, Nakaya ([17], page 114) found fall velocities of close 30 cm/sec for plane dendritic crystals, independent of for diameters ranging from 1.5 to 5 mm. Nakaya also observed ([17], page 107) that these crystals had typical thicknesses of 9-15 m, although disks with the same radius and mass would have effective thicknesses of order 5-6 m ([17], page 115). These data agree reasonably well with the expressions above, given the uncertainty in crystal thicknesses.
For the case of a falling spherical snow crystal, the low Reynolds number case gives
while at high Reynolds number we have
and the transition between these two behaviors occurs near
2.3 Horizontal Alignment
Aerodynamic forces often align falling snow crystals relative to the horizontal plane; that is, plates tend to fall with their faces parallel to the ground and columns fall with their long axes parallel to the ground. We examine the case of thin plates here; the columnar case would be handled similarly.
When the Reynolds number exceeds approximately , the horizontal alignment of a falling plate is no longer stable, and a variety of fluttering and tumbling modes occur [18] . Using Equation 2.2 for the terminal velocity, the criterion gives
so we see that aerodynamic fluttering and tumbling instabilities are likely to occur only for the largest snow crystals. Before these full-blown instabilities develop, however, rocking or twirling motions are often observed [18] that produce deviations from horizontal that can be substantial and time-dependent.
For small crystals with low Reynolds numbers, the limit to horizontal alignment comes mainly from motion of the air, especially atmospheric turbulence. (Brownian motion is likely less important than turbulence except in the most stable laboratory conditions.) One effect of moving air is that small snow crystals are simply carried along with the air. If a crystal moves exactly with the air, however, then there is no relative motion of the air with respect to the crystal, and thus no force that aligns the crystal. Thus a perfectly steady wind will move a crystal, but will not change its alignment. If air motion is going to affect alignment, then there must be a relative velocity between the air and the crystal. In Appendix II we examine two models of atmospheric turbulence and use them to calculate properties of
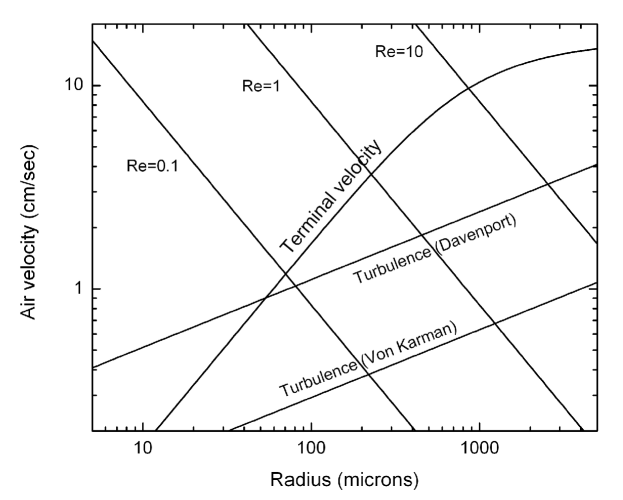
The results from our turbulence models for thin plate crystals are shown in Figure 1. Here we plot the terminal velocity along with the root-mean-square value of arising from air turbulence. When becomes smaller than , then aerodynamic forces will tend to align the crystals relative to the turbulent air motion, and they will no longer be aligned with the horizontal plane.
When falling snow crystals have simple, faceted morphologies and are aligned to the horizontal plane, then conditions are favorable for the formation of light pillars and some types of atmospheric halos [19]. Halo observers have found that crystals smaller than m show little horizontal alignment in the atmosphere [20, 21], and this agrees with the results shown in Figure 1 (albeit with considerable uncertainty in the turbulence models). Remarkably, crystal alignments within one degree of horizontal have been inferred from halo observations [20], but only in very rare circumstances.
3 The Ventilation Effect
When there is air flowing around a snow crystal, its growth rate increases as the flow enhances particle and heat diffusion in the neighborhood of the crystal. The increase in crystal growth is often called the ventilation effect (for a review, see [11]). In this paper we will ignore heat diffusion, since it is typically less important than particle diffusion in limiting snow crystal growth [7]. Removing latent heat generated by solidification becomes a relatively more important factor in laboratory experiments at lower pressures, but here we are mainly concerned with aerodynamic effects at pressures one might encounter under normal atmospheric conditions.
To examine how air flow affects particle diffusion, consider that the timescale for water molecules to diffuse a distance through the air is
where is the diffusion constant (see Appendix I). A growing crystal significantly reduces the supersaturation in its vicinity only out to distances comparable to the overall crystal size [7], so we typically take in the above expression to be the approximate size of the crystal. The timescale for air to flow past an object of size is
where is the velocity of the flow. For a snow crystal growing in air, and when the growth is limited by particle diffusion, we would expect the flow to significantly affect the growth only when or equivalently when or (where we have used ; see Appendix I).
3.1 The Spherical Case
To a rough approximation, the effect of a slow relative velocity between a growing crystal and the surrounding air can be modeled by moving the far-away boundary condition from infinity to some finite outer boundary at which the supersaturation is With no air motion we revert to and This is clearly a crude model, since it does not include any asymmetries resulting from the air flow, but it is useful for determining the magnitude of the ventilation effect under different conditions. Assuming this change in effective boundary, we can solve the spherically symmetric case exactly. The supersaturation becomes
which satisfies the diffusion equation, and the outer boundary condition gives
while inner boundary condition becomes
where is the crystal growth velocity, is the attachment coefficient, is the water vapor density in saturated air, is the solid density, and is a constant term [7]. Solving these equations for and yields
where
and
If then we can take and this expression reverts to the usual result for a growing spherical crystal [7]. If then the growth is mainly limited by attachment kinetics and we have
In this case the growth is independent of as we would expect. If so the growth is primarily diffusion limited, then we have
which is larger than the usual result for diffusion-limited growth by a factor of .
From the discussion of timescales above, the change in caused by air flow can be approximated by taking
for the spherical case, which gives the growth enhancement factor
| (3) |
where is a dimensionless geometrical factor. Thus the growth rate is increased by a factor of when the flow velocity is small and the growth is mainly diffusion-limited. Detailed modeling and experiments with spherical water drops suggests when [11].
For higher the enhancement factor contains a term proportional to instead of again based on numerous calculations and experiments relating to the growth and evaporation of spherical water droplets [11]. Thus we have a rough approximation for the growth enhancement factor
which applies to the spherical case when the growth is mainly diffusion limited. This semi-empirical result is of limited use for snow crystal growth, since snow crystals are generally not very spherical and their growth is often substantially limited by attachment kinetics.
3.2 Dendrite Growth
The growth of a snow crystal dendrite must be considered differently, since there is no isolated far-away boundary as there is with the spherical case. Assuming a simple parabolic shape (a reasonable first approximation to a dendrite tip), with pure diffusion-limited growth, the diffusion equation can be solved to give the tip growth velocity
where here is the radius of curvature of the dendrite tip and is the distance to the outer boundary in parabolic coordinates [22, 7]. If we assume the air flow is directed into the dendrite tip along the symmetry axis, and thus take following the discussion above, then
where the latter expression assumes As an example, if we take m for the dendrite tip radius, then increases from to when the air velocity increases from cm/sec to cm/sec, which increases by roughly 25 percent. This is in reasonable agreement with measurements ([12], Figure 8).
It is interesting to compare this result with the spherical case; that is, a sphere with m growing in the presence of flows with cm/sec and cm/sec. In the spherical case the outer boundary goes from m to m, producing a mere 2% increase in growth rate, even assuming a rather large . For the dendrite case, changing from the same m to m produces a growth increase of 25% – more than an order of magnitude larger. Physically, this demonstrates how much the main body of a parabolic dendrite affects growth near the tip. Even a low-velocity flow directed at the dendrite tip effectively removes a large part of the dendrite body from the diffusion problem and thus substantially increases the tip growth rate.
4 Snow Crystal Symmetry
Given the various calculations described above, we now examine how aerodynamics can affect the symmetry of growing snow crystals. In many instances the alignment of falling crystals combines with the ventilation effect to balance the growth of different parts of a crystal, thus enhancing its overall symmetry. Although this symmetry-enhancing effect is relatively weak, it often has noticeable effects.
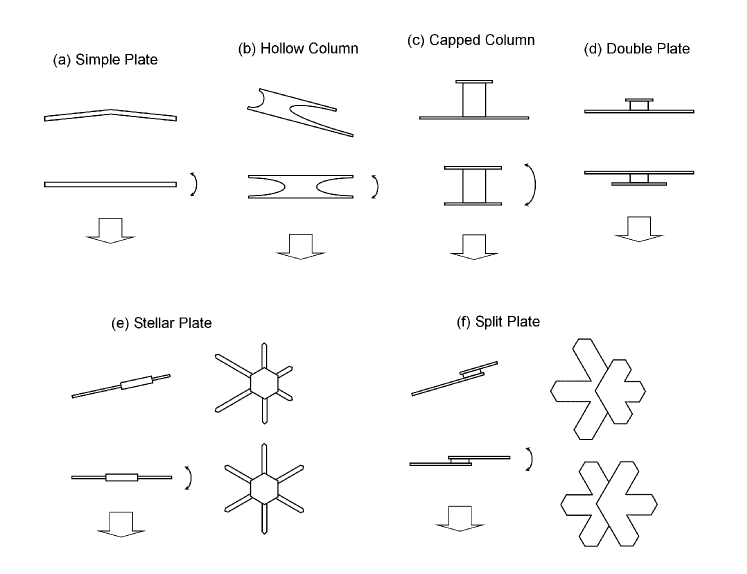
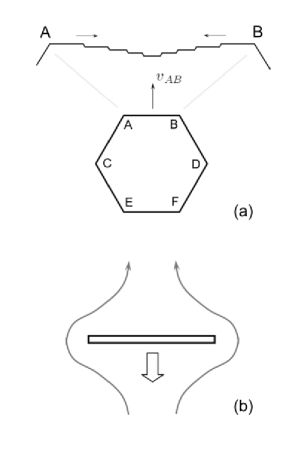
In Figure 2 we show several different snow crystal types (described in [6]) that are influenced by aerodynamics. To illustrate the discussion, this figure includes drawings that show how these crystals grow in the real world along with drawings showing how they might grow in a fictional “negative” world, where the aligning effects of aerodynamics have the opposite sign compared to the real world. We consider each case in Figure 2:
Simple Plates. In Figure 2a, a falling hexagonal plate crystal is aligned with respect to the horizontal plane, so the crystal sees a flow of air directed at its lower face. This flow enhances diffusion via the ventilation effect so the lower face grows more rapidly than the top face. Since the outer parts of the basal faces grow more rapidly than the center of the plate (because the edges stick out farther into the supersaturated air), this causes the plate to grow with a slightly conical shape, as shown in the top diagram in Figure 2a. In our fictional negative world, aerodynamics keeps the plate aligned with its starting orientation, so it continues growing in the shape of a shallow cone.
In the real world, however, the conical shape drawn in Figure 2a is aerodynamically unstable and the crystal soon flips over, causing the point of the nascent cone to face downward. Subsequent growth then tends to reverse the initial conical shape. Aerodynamic alignment and ventilation effect thus cause the crystal to flip numerous times as it grows, resulting in a plate that is very close to being perfectly flat. This scenario of a constantly flipping plate has been witnessed in observations of growing crystals where an applied airflow was used to counter the downward drift from gravity [13].
We see here that aerodynamic effects enhance the symmetry of the crystal – in this case ensuring that the plate remains flat. The ventilation effect first results in the preferential growth of the lower face of the plate, thus breaking the symmetry, but this in turn produces an aerodynamic instability that flips the crystal and restores symmetry.
Hollow Columns. If we consider the growth of a hollow column along its length (see Figure 2b), we see that there is no initial symmetry breaking growth that favors one end over the other. Nevertheless, random perturbations will lead to small differences as the crystal grows. In our negative world, the longer end would tip downward and the ventilation effect would cause this end to grow faster in comparison to the opposite end. The result would be a growth instability favoring asymmetrical growth. In the real world, however, aerodynamic forces cause the initially longer end to tip upward (because the center of the crystal is heavier than the hollow ends). Then the ventilation effect favors the short end, and the net effect is to restore symmetry between the two ends.
We see another effect with the growth of the sides of the column. As the column falls with its axis horizontal, the ventilation effect causes the lower parts of the crystal to grow more rapidly than the upper parts. Eventually the crystal becomes sufficiently asymmetrical that it flips over, thus reducing growth on the heavy side. Again with the radial growth of columns, we see that aerodynamic forces and the ventilation effect conspire to enhance the morphological symmetry of the crystal.
Capped Columns. A capped column may align (depending on its different dimensions) with one end-plate facing downward, as shown in Figure 2c. In our negative world, the lower plate would grow more rapidly and would soon dominate over the upper plate. In the real world, any asymmetry in growth causes an aerodynamic instability that flips the column over. As with the previous examples, multiple flips again promote the growth of a symmetrical crystal. This behavior has also been seen experimentally [13].
Double Plates. If the two ends of a capped column are close together, then a diffusion-induced instability may win out over aerodynamic effects, causing one plate to dominate over the other. This time our negative and real worlds do not produce such different results, as shown in Figure 2d. The crystal falls with the dominant plate facing down in the negative case, and the secondary plate is almost completely shielded from additional growth. In the real world, the smaller plate faces downward, so the ventilation effect favors its growth. The dominant plate still overshadows its smaller companion from the standpoint of vapor diffusion, so symmetry is not preserved, in contrast to the capped column case.
Stellar Plates. If the center of a stellar plate is more massive (per unit area) than the outer parts, then aerodynamic forces will cause the plate to tip if it grows asymmetrically. In our negative world, the longer branches would tip downward and the ventilation effect would favor their growth, resulting in a growth instability that increases the asymmetry of the crystal.
In the real world, however, the long branches would tip upward, where their growth would slow relative to the shorter branches. This would tend to restore the symmetry of the crystal, as shown in Figure 2e, and the crystal orientation would remain flat as it falls.
This symmetry-restoring effect is likely very weak, and it would be especially weak in the case of a fern-like stellar dendrite, which typically does not have a heavy core. In the absence of a heavier center, the crystal would continue to orient close to horizontally even if some branches were longer than others, as long as the overall shape is roughly disk-like.
It should be emphasized that in the absence of any of the aerodynamical effects described here, the six arms of a stellar plate crystal would still grow symmetrically. The standard model for the formation of stellar crystals, in which the arms all grow nearly identically because they experience essentially identical time-dependent conditions during their growth [7], adequately explains the occasionally high degree of six-fold symmetry observed in these crystals.
Split Plates. A split plate crystal is a short capped column where one end-plate dominates on one side of the crystal and the other end-plate dominates on the other side [6], as illustrated in Figure 2f. The heavy center, along with the separation between the two plates, leads to a relatively strong aerodynamic instability in these crystals. In our negative world, the crystal would quickly become asymmetrical, as shown in the Figure. In the real world, however, the crystal flips as soon as one side grows appreciably larger than the other. As with the other examples, repeated flips result in a crystal with good symmetry.
Close inspection of symmetrical stellar snow crystals reveals that a surprising number are actually split plates [6]. Aerodynamic affects may well play a substantial role in enhancing the symmetry of these initially asymmetrical crystals, thus explaining why split plates often look so much like normal stellar plates.
5 Triangular Snow Crystals
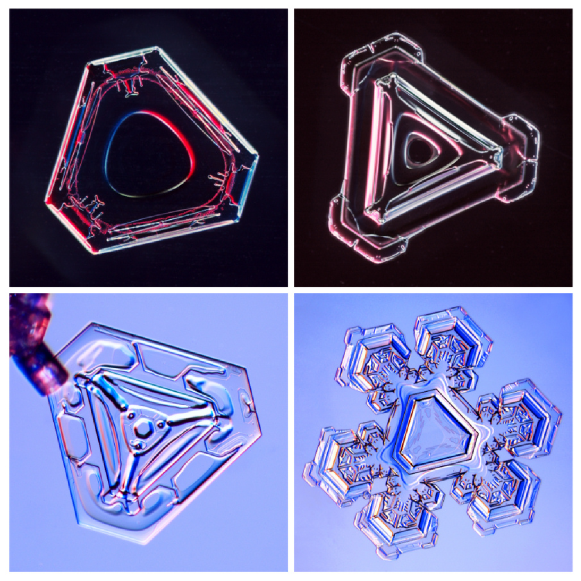
An especially interesting application of aerodynamic effects in snow crystal growth is the explanation of triangular snow crystals [24]. Figure 3 shows several examples that illustrate some typical characteristics of this morphological type. The most common occurrence is a small plate-like crystal that has the overall shape of a truncated equilateral triangle, often with a variety of surface markings on the basal faces [6]. Some truncated triangular plates sprout branches as they grow larger, as shown in the lower right example in Figure 3.
Observers of natural snow crystals have reported the occurrence of triangular snow crystals for nearly two centuries. The first documented observation (to my knowledge) was by William Scoresby in 1820 [25], and Wilson Bentley and W. J. Humphreys presented several dozen examples with triangular morphologies in their well-known 1931 compilation of snow crystal photographs [26]. Although triangular crystals are usually small and relatively rare, they are visually distinctive and fairly easy to find in nature. Some especially large and cleanly faceted triangular crystals have been recorded at the South Pole [20, 21].
5.1 Laboratory-Grown Crystals
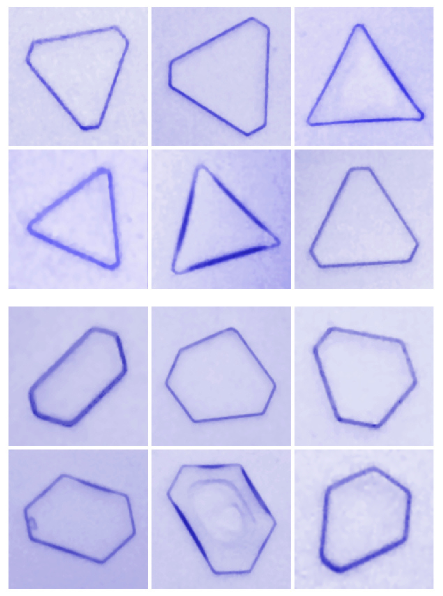
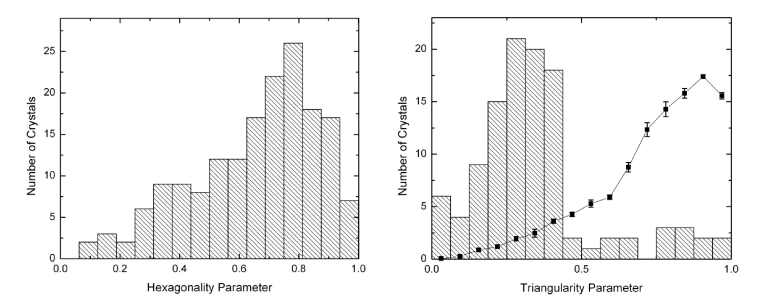
Triangular morphologies have been observed occasionally in laboratory studies of snow crystals that have been grown while falling in air (e.g. [27, 24]), and some examples are shown in Figure 4. To examine the distribution of different morphologies in a systematic fashion, Libbrecht and Arnold [24] defined a “hexagonality” parameter for faceted snow crystal plates, where and are the lengths of the shortest and longest prism facets, respectively. is close to unity when a plate is nearly hexagonal, while is smaller for any of a variety of odd-shaped plates. Figure 5 shows the measured distribution for an unbiased sample of their data. Crystals with appeared nearly hexagonal to the eye, and this plot confirms that simple plate-like crystals are mostly hexagonal in shape.
Libbrecht and Arnold also defined a “triangularity” parameter , where and are the lengths of the third and fourth smallest facets, respectively. This parameter is small if, and only if, the morphology is that of a truncated triangle, and if, and only if, the morphology is nearly that of an equilateral triangle. Figure 5 shows the distribution using “extreme” crystals (defined as those with . That the distribution is skewed to lower values reflects that fact that most of the extreme crystals were shaped like truncated triangles.
Libbrecht and Arnold then used Monte Carlo simulations to investigate the null hypothesis that their observations were due entirely to random variations in the growth rates of the different prism facets, yielding the line in Figure 5. In these simulations, random fluctuations in the growth rates of the six facets produced a variety of odd shapes, including trapezoidal, diamond-shaped, and other forms. However, as seen in Figure 5, the simulations did not show a preponderance of triangular crystals over other non-hexagonal shapes, in stark contrast to the data.
These considerations provide convincing evidence that, at least under some growth conditions, triangular morphologies are substantially more abundant than one would expect from random fluctuations in the growth of hexagonal plates. Once can then conclude that some non-random mechanism is responsible for the growth of snow crystal plates with three-fold symmetry. In particular, this mechanism must somehow coordinate the growth of the facets so that they alternate between slow and fast growth around the crystal.
5.2 An Aerodynamic Model
Libbrecht and Arnold proposed an aerodynamic model to explain the growth of triangular snow crystals, both in the lab and in nature [24], which we examine here. To begin, first consider the case of a thin hexagonal plate crystal, as shown in Figure 6. The crystal has six prism facets, and each grows outward at some perpendicular growth velocity (in Figure 6, for example, is the growth velocity of the facet). For a symmetrical crystal, all six prism facets are the same length and all six growth velocities are equal.
The growth of a faceted crystal is limited partially by water vapor diffusion through the surrounding air and partially by attachment kinetics at the crystal surface. The two effects together result in facet surfaces that are slightly concave at the molecular level, as shown in Figure 6, although they may appear perfectly flat optically [5]. Nucleation of new molecular terraces occurs near the corners (points and in Figure 6), where the supersaturation is highest. The molecular steps then propagate inward, traveling more slowly near the facet centers where the supersaturation is lower. The combined effects of surface attachment kinetics and diffusion-limited growth thus automatically establish the concave shape of each facet surface.
The perpendicular growth velocity of the facet is primarily determined by the nucleation rates near points and . In the symmetrical case, the rates at and are equal, giving the picture shown in Figure 6. If the nucleation rate were slightly greater at , then the picture would be distorted and the facet surface would be tilted slightly relative to the ice lattice. If the nucleation rate at were substantially greater than at , then terraces generated at would propagate all the way across a vicinal surface from to [5]. In general, we see that is determined by the greater of the two nucleation rates at and .
As a growing crystal falls, air resistance causes the basal faces to become oriented perpendicular to the fall velocity, as shown in Figure 6. Air flowing around the falling crystal tends to increase growth via the ventilation effect, and the airflow produces an effective increase in supersaturation where the edges stick out farthest and the resulting flow is the fastest. In the case of a falling plate, this aerodynamic effect mostly increases the growth of the thin edges of the plate (i. e., the prism facets).
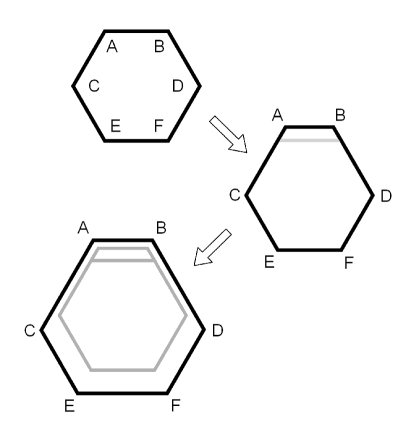
With this overall picture in mind, we now consider the case shown in Figure 7. Here we start with a hexagonal plate and assume a small growth perturbation somewhere on the facet that breaks the six-fold symmetry and makes greater than the other five facet growth rates. This perturbation could come from a crystal dislocation, a step-generating chemical impurity on the surface, a piece of dust, or perhaps some other mechanism. Regardless of the origin of the initial symmetry-breaking perturbation, the larger growth rate initially results in the distorted crystal shape shown as the second stage in Figure 7.
Once this initial asymmetry appears, the additional material produces an increased aerodynamic drag on one side of the plate. This in turn changes the orientation of the falling crystal in such a way that the points and tip downward, toward the fall direction. Relative to the original horizontal orientation, air flowing around the tilted crystal now increases the supersaturation at points and while decreasing it at and . As a result, the nucleation rates at points and increase. Air turbulence will upset the horizontal orientation of the crystal, but it will enhance this ventilation effect. Whatever the source of a relative velocity between crystal and air, aerodynamic forces will align the crystal relative to the flow.
The growth rate of a facet is determined mainly by the greater of the nucleation rates at its two corners (from the discussion of Figure 6 above), and for our tilted crystal we see that the nucleation rates at and must be greater than at and . Thus we must have that to a rough approximation, and furthermore these velocities must all be greater than and (while is somewhat ill-determined throughout because of the assumed growth perturbation). After a period of additional growth in these conditions, shown in the last stage of Figure 7, we find that the length of facet has increased relative to and . This means that , , and are now the three shortest facets, so the crystal has begun to assume a slight triangular shape.
For small crystals like those grown in the laboratory, the ventilation effect produces only a rather small change in growth rates of the different facets. From Figure 1 we see that the Reynolds number for small laboratory-grown crystals is roughly so the enhancement factor from Equation 3 gives at most about a 10 percent difference in growth rates for the different facets. This enhancement factor alone is probably too small to explain the triangular morphologies seen, but several other effects can further augment the differences between the facets. First, once aerodynamics produces the shape shown in the last stage of Figure 7, the shorter facets (, , and in this case) stick out farther into the supersaturated air, so the Mullins-Sekerka instability [5] tends to increase , , and relative to the other three facets. An important aspect of this instability is that it takes less mass to grow a surface of reduced size, so overall mass flow considerations in diffusion-limited growth tend to increase the growth of the shorter facets. Second, airflow is faster around the shorter facets, because they stick out farther, and this also increases their growth relative to the longer facets via the ventilation effect. Third, if the condensation coefficient is a strong function of supersaturation, as is often the case, then even rather small changes in effective supersaturation from the ventilation effect could result in substantial changes in relative growth rates.
The end result in this model is that an initial symmetry-breaking perturbation results in a growth morphology that becomes more triangular with time. Only one initial perturbation is necessary, and no coordination intrinsic to the molecular structure of the crystal need be present. The coordination of the growth rates of alternating facets is initiated by the aerodynamics of the falling crystal.
An interesting feature of this model is that a triangular plate morphology is both aerodynamically stable and stable against additional growth perturbations. Once a plate takes the form of an equilateral triangle , subsequent growth perturbations cannot change this morphology, as long as the plate remains faceted. This is not true for hexagonal plates, so even small initial perturbations would eventually result in triangular shapes. This triangular growth instability is weak, however, so it would likely not be a dominant effect under typical conditions.
To understand this model in a more quantitative sense, we would have to perform more accurate calculations of the ventilation effect for thin, plate-like crystals. No other explanations for triangular snow crystals have been proposed to date (to my knowledge), but the approximate analytic methods described above are simply too crude to verify that aerodynamic effects will indeed produce these morphologies. By combining more sophisticated fluid mechanics calculations (e.g. see [14]) with numerical methods for calculating crystal growth [8, 9, 10], it should be possible to explore this question further.
6 Summary
The results presented above are intended as a brief summary of aerodynamical effects that are relevant for understanding snow crystal growth. Some aspects of aerodynamics are quite well understood, while others are not. Aerodynamic drag is quite well known, so calculations of terminal velocities and related quantities are straightforward. Convection and turbulence are more complex, however, so calculations involving these phenomena are considerably more uncertain.
Combining airflow and diffusion-limited growth to determine growth rates (the ventilation effect) is difficult for complex snow crystals, in part because their growth is limited by attachment kinetics in addition to diffusion. Nevertheless, approximate enhancement factors are useful in simple cases. For flow at low Reynolds number, it appears quite feasible to combine basic computational fluid dynamics with diffusion-limited growth in interesting cases. An especially promising route would be to use cellular automata, as this is a very powerful technique for modeling faceted crystal growth in 2D and 3D [8, 9, 10]. Adding low-velocity flows to these calculations, and comparing with laboratory measurements, would likely allow a number of interesting avenues to be explored.
The formation of triangular plate-like crystals is a particularly interesting phenomenon to investigate further, since it appears that aerodynamic effects are central in promoting the formation of this morphology. Simple trigonal plates appear much more readily in some conditions than others [24], but why this is the case is an open question. Additional measurements at different temperatures and supersaturations would shed light on this. More directly, in situ observations of electrodynamically levitated crystals [28] could be used to examine the transition from hexagonal to triangular forms in real time, and imposing different airflows around levitated crystals could test many aspects of the aerodynamic model in detail.
7 Appendix I – Some Relevant Physical Quantities
Air Density. The density of ordinary air is
where is the air pressure. The density of ice is
Diffusion Constant. The diffusion constant for water vapor (or other light molecules) in air near room temperature is
which increases roughly linearly with absolute temperature [29].
Air Viscosity. The dynamic viscosity of air is
at room temperature. The viscosity is roughly independent of pressure as long as the molecular mean free path is short compared to other lengths in the system. In air the molecular mean free path is roughly 0.1 m. The viscosity increases slowly as the temperature increases; at -10 C (263 K) the viscosity is kg/(m-sec) [30].
8 Appendix II – The Turbulence Spectrum
When looking at the effects of aerodynamics on snow crystal growth, we would like to know the motion of a crystal and the relative velocity between the crystal and the air. One source of motion and relative velocity is gravity, which produces the terminal velocity of a falling crystal we calculated above. Another source of motion and relative velocity is from wind and turbulence.
To examine the effects of turbulence, first consider a snow crystal suspended in a parcel of air that is oscillating in time with position and velocity given by and The drag force will cause the crystal to oscillate at the same frequency, so we write the crystal amplitude and velocity as and The relative velocity of the crystal with respect to the air is then Using the known drag force, we have (dropping the
and from we have
with the relative velocity
For we see and In this case the crystal simply moves along with the air. At high frequencies, the inertia of the crystal is more important and and For a spherical crystal, the transition frequency between these regimes is
For a thin disk oriented such that , we have
In both cases we have for , while for we have
8.1 The Von Karman Model
Two models are often used to describe the spectrum of atmospheric turbulence – the Von Karman spectrum and the Davenport spectrum [31]. Both models display a Kolmogorov behavior over a broad frequency range. The Von Karman model gives the power spectral density of the wind velocity as [31]
where is in (m/sec)Hz, is the frequency in Hz, is the mean wind speed in m/sec, is the turbulence intensity (between 0 and 1; typically around 0.2), and is the outer scale of the turbulence in meters (around 80 in the open air). Integrating this expression over frequency gives
For we can write the power spectral density for the relative air/crystal velocity as
where and The low-frequency knee in occurs at Hz, and taking m/sec for a typical (light) wind velocity gives mHz. Since we can assume over frequencies we are interested in and write
Integrating this from to gives the mean-squared relative air/crystal velocity arising from turbulence
where is in (m/sec)2 and we used and for the last expression. Our final result for the Von Karman turbulence model becomes
8.2 The Davenport Model
For comparison, we also evaluate the Davenport model [31], which gives
where the notation is similar to that used above, except now and is a roughness coefficient for open terrain). Integrating this gives
The low-frequency knee occurs at Hz, which is again around 1 mHz. For we can write
where again we have assumed over frequencies of interest. Integrating this as we did above gives
We see that in the Davenport model is roughly 3 times larger than for the Von Karman model, reflecting the fact that turbulence models are not without considerable uncertainty. Using the expressions above for , we have
| (4) | |||||
where again is the mean wind velocity. The uncertainty in the constants in these expressions reflects the differences in the two turbulence models.
References
- [1] Prinz, M., Harlow, G., and Peters, J., “Simon & Schuster’s Guide to Rocks & Minerals,” Publisher:Simon & Schuster (1978).
- [2] Imai, H., “Self-organized Formation of Hierarchical Structures,” Publisher:Springer-Verlag (2007).
- [3] Kolasinski, K. W., “Solid structure formation during the liquid/solid phase transition,” Curr. Opin. Solid State & Mater. Sci., 11, 76-85 (2007).
- [4] Ben-Jacob, E., and Garik, P., “Ordered shapes in nonequilibrium growth,” Physica D, 38, 16-28 (1989).
- [5] Saito, Y., “Statistical Physics of Crystal Growth,” Publisher:World Scientific (1996).
- [6] Libbrecht, K. G., “Ken Libbrecht’s Field Guide to Snowflakes,” Publisher:Voyageur Press (2006).
- [7] Libbrecht, K. G., “The physics of snow crystals,” Rep. Prog. Phys., 68, 855-895 (2005).
- [8] K. G. Libbrecht, “Physically derived rules for simulating faceted crystal growth using cellular automata,” arXiv:0807.2616 (2008).
- [9] Gravner, J. and Griffeath, D., “Modeling snow crystal growth II: A mesoscopic lattice map with plausible dynamics,” Physica D 237, 385-404 (2008).
- [10] Gravner, J. and Griffeath, D., “Modeling snow-crystal growth: A three-dimensional mesoscopic approach,” Phys. Rev. E 79, 011601 (2009).
- [11] Pruppacher, H. R., and Klett, J. D., “Microphysics of clouds and precipitation,” Publisher: Kluwer Academic Publishers (1997).
- [12] Keller, V. W. and Hallett, J., “Influence of air velocity on the habit of ice crystal growth from the vapor,” J. Cryst. Growth 60, 91-106 (1982).
- [13] Fukuta, N. and Takahashi, T., “The growth of atmospheric ice crystals: A summary of findings in vertical supercooled cloud tunnel studies,” J. Atmos. Sci. 56, 1963-79 (1999).
- [14] Wang, P. K., “Shape and microdynamics of ice particles and their effects in cirrus clouds,” Adv. Geophys. 45, 1-258 (2002).
- [15] http://en.wikipedia.org/wiki/Drag_(physics) (2009).
- [16] http://en.wikipedia.org/wiki/Drag_coefficient (2009).
- [17] Nakaya, U., “Snow Crystals: Natural and Artificial,” Publisher:Harvard University Press (1954).
- [18] Field, S. B., et al., “Chaotic dynamics of falling disks,” Nature 388, 252-4 (1997).
- [19] Lynch, D. K. and Livingston, W., “Light and Color in Nature,” Publisher:Cambridge University Press (2001).
- [20] Tape, W. “Atmospheric Halos,” Publisher:American Geophysical Union (1994).
- [21] Tape, W. and Moilanen, J., “Atmospheric Halos and the Search for Angle X,” Publisher:American Geophysical Union (2005).
- [22] Libbrecht, K. G. and Tanusheva, V. M., “Cloud chambers and crystal growth: Effects of electrically enhanced diffusion on dendrite formation from neutral molecules,” Phys. Rev. E 59, 3253-3261 (1999).
- [23] Libbrecht, K. G., “Snowflakes,” Publisher:Voyageur Press (2008).
- [24] Libbrecht, K. G. and Arnold, H. M., “Aerodynamic Stability and the Growth of Triangular Snow Crystals,” arXiv:0911.4267 (2009).
- [25] Scoresby, W. “An Account of the Arctic Regions with a History and Description of the Northern Whale-Fishery,” Publisher:Archibald Constable Publishing (1820).
- [26] Bentley, W. A., and Humphreys, W. J., “Snow Crystals,” Publisher:McGraw-Hill (1931).
- [27] Yamashita, A., “On the trigonal growth of ice crystals,” J. Meteor. Soc. Japan 51, 307-316 (1973).
- [28] Swanson, B. D., Bacon, M. J.; Davis, E. J., et al., “Electrodynamic trapping and manipulation of ice crystals,” Quart. J. Roy. Meteor. Soc., 125, 1039-1058 (1999).
- [29] http://cambridge.org/us/engineering/author/nellisandklein/downloads/examples/EXAMPLE_9.2-1.pdf (2009).
- [30] http://en.wikipedia.org/wiki/Dynamic_viscosity (2009).
- [31] Bely, P.-Y., “The design and construction of large optical telescopes,” Publisher:Springer (2003).
- [32] Reif, F., “Fundamentals of statistical and thermal physics,” Publisher:McGraw-Hill (1965).