Abstract
We investigate the nonlinear response of photonic crystal waveguides with suppressed two-photon absorption. A moderate decrease of the group velocity ( c/6 to c/15, a factor of 2.5) results in a dramatic ( 30) enhancement of three-photon absorption well beyond the expected scaling, . This non-trivial scaling of the effective nonlinear coefficients results from pulse compression, which further enhances the optical field beyond that of purely slow-group velocity interactions. These observations are enabled in mm-long slow-light photonic crystal waveguides owing to the strong anomalous group-velocity dispersion and positive chirp. Our numerical physical model matches measurements remarkably.
Non-trivial scaling of self-phase modulation and three-photon absorption in III-V photonic crystal waveguides
Chad Husko1,2∗, Sylvain Combrié1, Quynh Vy Tran1, Fabrice Raineri3,4, Chee Wei Wong2, Alfredo De Rossi1∗
1Thales Research and Technology, Route Départementale 128, 91767 Palaiseau, France
2 Optical Nanostructures Laboratory, Columbia University, New York, NY 10027 USA
3 Laboratoire de Photonique et de Nanostructures (CNRS UPR 20), Route de Nozay, 91460 Marcoussis, France
4 Université D. Diderot, 75205 Paris, France
cah2116@columbia.edu, alfredo.derossi@thalesgroup.com
OCIS codes: (130.5296) Photonic crystal waveguides, (190.4180) Multiphoton processes, (190.3270) Kerr effect, (190.4400) Nonlinear optics, materials, (250.4390) Nonlinear optics, integrated optics
References and links
- [1] S. Harris, “Electromagnetically Induced Transparency,” Physics Today 50, 36 (1997).
- [2] L. Hau, S. Harris, Z. Dutton, and C. Behroozi, “Light speed reduction to 17 metres per second in an ultracold atomic gas,” Nature 397, 594 (1999).
- [3] J. Longdell, E. Fraval, M. Sellars, and N. Manson, “Stopped light with storage times greater than one second using electromagnetically induced transparency in a solid,” Phys. Rev. Lett. 95, 63601 (2005).
- [4] L. Deng and M. Payne, “Inhibiting the onset of the three-photon destructive interference in ultraslow propagation-enhanced four-wave mixing with dual induced transparency,” Phys. Rev. Lett. 91, 243902 (2003).
- [5] X. Yang, M. Yu, D.-L. Kwong, and C. W. Wong, “All-optical analogue to electromagnetically induced transparency in multiple coupled photonic crystal cavities,” Phys. Rev. Lett. 102, 173902 (2009).
- [6] T. Baba, “Slow light in photonic crystals,” Nat. Photonics 2, 465 (2008).
- [7] T. F. Krauss, “Why do we need slow light?” Nat. Photonics 2, 448 (2008).
- [8] Y. Vlasov, M. O’Boyle, H. Hamann, and S. McNab, “Active control of slow light on a chip with photonic crystal waveguides,” Nature 438, 65 (2005).
- [9] M. A. Foster, R. Salem, D. F. Geraghty, A. C. Turner-Foster, M. Lipson, and A. L. Gaeta, “Silicon-chip-based ultrafast optical oscilloscope,” Nature 456, 81 (2008).
- [10] M. Pelusi, F. Luan, T. Vo, M. Lamont, S. Madden, D. A. Bulla, D.-Y. Choi, B. Luther-Davies, and B. Eggleton, “Photonic-chip-based radio-frequency spectrum analyser with terahertz bandwidth,” Nat. Photonics 3, 139 (2009).
- [11] J. Topolancik, B. Ilic, and F. Vollmer, “Experimental Observation of Strong Photon Localization in Disordered Photonic Crystal Waveguides,” Phys. Rev. Lett. 99, 253901 (2007).
- [12] R. Engelen, D. Mori, T. Baba, and L. Kuipers, “Two regimes of slow-light losses revealed by adiabatic reduction of group velocity,” Phys. Rev. Let. 101, 103901 (2008).
- [13] A. Baron, A. Ryasnyanskiy, N. Dubreuil, P. Delaye, Q. Tran, S. Combrié, A. De Rossi, R. Frey, and G. Roosen, “Light localization induced enhancement of third order nonlinearities in a GaAs photonic crystal waveguide,” Opt. Express 17, 552 (2009).
- [14] M. Soljačić and J. D. Joannopoulos, “Enhancement of nonlinear effects using photonic crystals,” Nat. Materials 3, 211 (2004).
- [15] J. F. McMillan, M. Yu, D.-L. Kwong, and C. W. Wong, “Observations of spontaneous Raman scattering in silicon slow-light photonic crystal waveguides,” Appl. Phys. Lett. 93, 251105 (2008).
- [16] Y. Okawachi, M. Bigelow, J. E. Sharping, Z. Zhu, A. Schweinsberg, D. J. Gauthier, R. W. Boyd, and A. L. Gaeta, “Tunable All-Optical Delays via Brillouin Slow Light in an Optical Fiber,” Phys. Rev. Lett. 94, 153902 (2005).
- [17] G. A. Siviloglou, S. Suntsov, R. El-Ganainy, R. Iwanow, G. I. Stegeman, D. N. Christodoulides, R. Morandotti, D. Modotto, A. Locatelli, C. D. Angelis, F. Pozzi, C. R. Stanley, and M. Sorel, “Enhanced third-order nonlinear effects in optical AlGaAs nanowires,” Opt. Express 14, 9327 (2006).
- [18] C. Monat, B. Corcoran, M. Ebnali-Heidari, C. Grillet, B. Eggleton, T. White, L. O’Faolain, and T. F. Krauss, “Slow light enhancement of nonlinear effects in silicon engineered photonic crystal waveguides,” Opt. Express 17, 2944 (2009).
- [19] K. Inoue, H. Oda, N. Ikeda, and K. Asakawa, “Enhanced third-order nonlinear effects in slow-light photonic-crystal slab waveguides of line defect,” Opt. Express 17, 7206 (2009).
- [20] T. Carmon and K. J. Vahala, “Visible continuous emission from a silica microphotonic device by third-harmonic generation,” Nat. Physics 3, 430 (2007).
- [21] P. P. Markowicz, H. Tiryaki, H. Pudavar, P. N. Prasad, N. N. Lepeshkin, and R. W. Boyd, “Dramatic Enhancement of Third-Harmonic Generation in Three-Dimensional Photonic Crystals,” Phys. Rev. Lett. 92, 083903 (2004).
- [22] B. Corcoran, C. Monat, C. Grillet, D. Moss, B. Eggleton, T. White, L. O’Faolain, and T. F. Krauss, “Green light emission in silicon through slow-light enhanced third-harmonic generation in photonic-crystal waveguides,” Nat. Photonics 3, 206 (2009).
- [23] S. Combrié, Q. V. Tran, E. Weidner, A. De Rossi, S. Cassette, P. Hamel, Y. Jaouen, R. Gabet, and A. Talneau, “Investigation of group delay, loss and disorder in a Photonic Crystal Waveguide by Low-Coherence Reflectometry,” Appl. Phys. Lett. 90, 231104 (2007).
- [24] G. Stegeman, “Material figures of merit and implications to all-optical waveguide switching,” Proc. SPIE 1852, 75 (1993).
- [25] J. Kang, A. Villeneuve, M. Sheik-Bahae, G. Stegeman, K. Al-Hemyari, J. S. Aitchison, and C. N. lronside, “Limitation due to three-photon absorption on the useful spectral range for nonlinear optics in AlGaAs below half band gap,” Appl. Phys. Lett. 65, 147 (1994).
- [26] A. Villeneuve, C. C. Yang, G. I. Stegeman, C.-H. Lin, and H.-H. Lin, “Ultrafast all-optical switching in semiconductor nonlinear directional couplers at half the band gap,” Appl. Phys. Lett. 62, 2465 (1993).
- [27] J. Aitchison, D. C. Hutchings, J. U. Kang, G. I. Stegeman, and A. Villeneuve, “The Nonlinear Optical Properties of AlGaAs at the Half Band Gap,” IEEE J. Quantum Electron. 33, 341 (1997).
- [28] S. Combrié, S. Bansropun, M. Lecomte, O. Parillaud, S. Cassette, H. Benisty, and J. Nagle, “Optimization of an inductively coupled plasma etching process of GaInP/GaAs based material for photonic band gap applications,” J. Vac. Sci. Technol. B 23, 1521 (2005).
- [29] Q. Tran, S. Combrié, P. Colman, and A. De Rossi, “Photonic crystal membrane waveguides with low insertion losses ,” Appl. Phys. Lett. 95, 061105 (2009).
- [30] E. Weidner, S. Combrie, A. De Rossi, Q. Tran, and S. Cassette, “Nonlinear and bistable behavior of an ultrahigh-Q GaAs photonic crystal nanocavity,” Appl. Phys. Lett. 90, 101118 (2007).
- [31] A. Parini, P. Hamel, A. De Rossi, S. Combrié, Q. Tran, Y. Gottesman, R. Gabet, A. Talneau, Y. Jaou n, and G. Vadal , “Time-Wavelength Reflectance Maps of Photonic Crystal Waveguides: A New View on Disorder-Induced Scattering,” IEEE J. of Lightwave Tech. 26, 3794 (2008).
- [32] S. G. Johnson and J. D. Joannopoulos, “Block-iterative frequency-domain methods for Maxwell’s equations in a planewave basis,” Opt. Express 8, 173 (2001).
- [33] Rigorous intensity autocorrelation measurements of the pulse were carried out at each wavelength and current setting.
- [34] E. Kuramochi, M. Notomi, S. Hughes, A. Shinya, T. Watanabe, and L. Ramunno, “Disorder-induced scattering loss of line-defect waveguides in photonic crystal slabs,” Phys. Rev. B 72, 161318 (2005).
- [35] B.S. Wherrett, “Scaling rules for multiphoton interband absorption in semiconductors,” J. Opt. Soc. Am. B 1, 67 (1984).
- [36] S. Huges, L. Ramunno, J. F. Young, and J. Sipe, “Extrinsic Optical Scattering Loss in Photonic Crystal Waveguides: Role of Fabrication Disorder and Photon Group Velocity,” Phys. Rev. Lett. 94, 033903 (2005).
- [37] S. Combrié, E. Weidner, A. De Rossi, S. Bansropun, S. Cassette, A. Talneau, and H. Benisty, “Detailed analysis by Fabry-Perot method of slab photonic crystal line-defect waveguides and cavities in aluminium-free material system,” Opt. Express 14, 7353 (2006).
- [38] A group-index dependent effective area for the slow-light PhCWG is included in the fifth-order nonlinear scaling, with defined as: .
- [39] J. I. Dadap, N. C. Panoiu, X. Chen, I. Hsieh, X. Liu, C. Chou, E. Dulkeith, S. J. McNab, F. Xia, W. M. J. Green, L. Sekaric, Y. A. Vlasov, and R. M. Osgood, Jr, “Nonlinear-optical phase modification in dispersion-engineered Si photonic wires,” Opt. Express 16, 1280 (2008).
- [40] W. Ding, C. Benton, A. Gorbach, W. Wadsworth, J. Knight, D. Skryabin, M.Gnan, M. Sorrel, and R. M. De La Rue, “Solitons and spectral broadening in long silicon-on-insulator photonic wires,” Opt. Express 16, 3310 (2008).
- [41] G. P. Agrawal, Nonlinear Fiber Optics (Academic, 2007).
- [42] N. A. R. Bhat and J. Sipe, “Optical pulse propagation in nonlinear photonic crystals,” Phys. Rev. E 64, 056604 (2001).
- [43] The vector definition is applicable to materials with large indices of refraction and tight confinement such as PhCWGs: . The scalar definition is the typical: .
- [44] M. Sheik-Bahae, D. Hagan, and E. W. Van Stryland, “Dispersion and band-gap scaling of the electronic Kerr effect in solids associated with two-photon absorption,” Phys. Rev. Lett. 65, 96 (1990).
- [45] The often cited linear loss definition, (linear) , is not applicable in our current experiment to estimate . We derive a more appropriate definition for when three-photon absorption, as opposed to linear loss, is the dominant loss term: , to be detailed elsewhere.
- [46] S. Kubo, D. Mori, and T. Baba, “Low-group-velocity and low-dispersion slow light in photonic crystal waveguides,” Opt. Lett. 32, 2981 (2007).
1 Introduction
Slow-light nonlinearities have been remarkably observed through quantum coherence and interference in atomic systems, with group velocities of tens of meters per second and sub-100 kHz bandwidths[1, 2, 3, 4]. In solid-state systems such as photonic crystal cavities [5] or waveguides [6, 7, 8], modest slow group velocities of down to c/300 in comparison has been achieved but possess THz bandwidths for chip-scale optical signal processing [9, 10]. The strong ab-initio structural dispersion in slow-light photonic crystals waveguides (PhCWGs) not only gives rise to localized modes[11, 12, 13], but also dramatic enhancement of resonant and non-resonant nonlinearities[14, 15]. Third-order processes have also recently been observed for slow-light [16], self-phase modulation (SPM) [17, 18, 19], and third-harmonic generation in optical microstructures [20, 21, 22]. Here we present the first observations of self-phase modulation limited only by three-photon-absorption as well as evidence for pulse compression in slow-light GaInP photonic crystal waveguides. In contrast to previous self-phase modulation work in PhCWG[13, 18, 19], which was limited by the third-order two-photon absorption (TPA), here the nonlinear loss term is the fifth-order three-photon absorption. The different orders of the desirable and undesirable nonlinearities, along with tight modal confinement of the photonic crystal, lead to the observation of novel optical effects. Remarkably the three-photon absorption process demonstrates a 30-fold enhancement, and departs from the expected () scaling, even when taking into account slow-light disorder scattering. Pulse compression was further observed in our positive chirp due to the interaction of the Kerr effect with anomalous group velocity dispersion(GVD). These series of measurements show excellent match with our numerical simulations including group-velocity-dependent nonlinearities and losses, and measured group velocity dispersion through optical low-coherence reflectometry [23].
The origin of slow-light in photonic crystals arises from coherent Bragg reflections due to the in-plane periodic PhCWG lattice, leading to an ultra-flat dispersion of the transverse electric (TE) field. At these so-called slow-light frequencies, the light effectively travels slowly through the lattice via multiple Bragg reflections, leading to an enhanced local field density. The local field enhancement scales inversely with the group velocity, thus decreasing the threshold of intensity-dependent nonlinear effects such as Kerr, multi-photon absorption, or Raman scattering [6, 14, 15]. The combination of the engineered group velocity enhancement, along with the small modal effective area of PhCWGs ( m2), yields outstanding control over the optical modes.
The optical Kerr-effect has long been studied for its utility in nonlinear all-optical devices [14, 24]. In addition to the desirable Kerr term, each material also has a nonlinear multi-photon absorption term. This fundamental material property induces several detrimental effects, such as: (a) limiting the Kerr-induced phase-shift, also called self-phase modulation (SPM); (b) inducing nonlinear and free-carrier absorption losses; (c) distorting the pulse via free-carrier dispersion; as well as (d) restricting the spectral range of any potential nonlinear optical devices such as all-optical switches[25]. In fact, several early studies point out that the wavelength range of the two-photon absorption (TPA) tail depends strongly on the quality of the molecular beam epitaxy (MBE) sample growth [25, 26, 27]. These fundamental obstacles must be overcome in order to achieve practical nonlinear devices, such as all-optical switches, on-chip. With this insight, we selected the material system GaInP (=1.9 eV) for its desirable nonlinear properties. With an energy bandgap at least 300 meV above the TPA range (), the GaInP sample investigated here is well outside the range of potential defect states and the sole nonlinear loss mechanism is three-photon absorption (ThPA). Importantly, ThPA is negligible at the optical intensities required for the Kerr-effects ( phase-shifts) observed experimentally in this paper. The complete suppression of TPA and small impact of ThPA on the GaInP PhCWG open the possibility of a significant spectral window for all-optical signal processing[25].
2 Experiment
2.1 Sample details and linear characterization
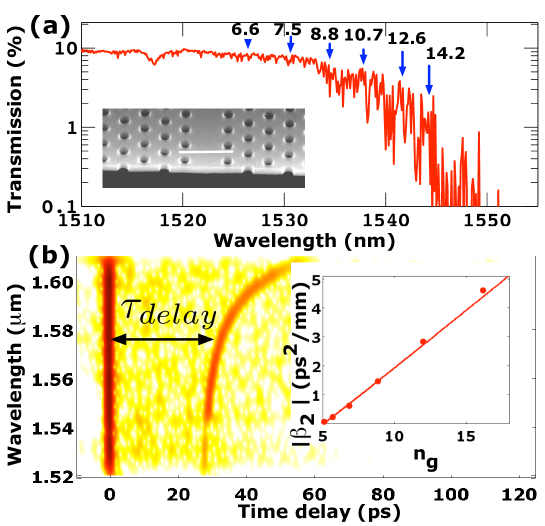
Our PhCWG sample is a W1 GaInP membrane of 190 nm thickness, with a hexagonal lattice constant of 480 nm, hole radius , and 1.5 mm length. The fabrication has been described elsewhere [28] and the linear PhCWG transmission is illustrated in Figure 1(a). We carefully designed integrated mode-adapters [29] to reduce losses to 5 dB/facet at 1526 nm [30] and suppress Fabry-Perot oscillations, though disordered propagation due to the lattice is clearly seen at the slow-light onset region [31]. Optical low-coherence reflectometry [23, 31] [Fig. 1(b)] was used to extract the group indices. and the group velocity dispersion (GVD) [Fig. 1(b) inset] computed using complete 3D planewave expansion [32], with measurement-consistent group indices.
2.2 Nonlinear characterization - three-photon absorption
For the nonlinear measurements, we employed a wavelength-tunable mode-locked fiber laser (PriTel) with 3 to 5 ps pulses [33] (characterized with autocorrelator) at 22 MHz with transverse-electric (electric-field in-plane) polarization. The output pulse monitored with a spectrum analyzer and an oscilloscope. The peak power coupled to the PhCWG is defined as: , where the input peak power (output power ) includes the objective loss (2 dB), mode mismatch (2 dB) [29], with the coupling coefficient, . The insertion loss due to disorder varies with slow-light [34]; the values of which are extracted directly from Eqn. 1 below.
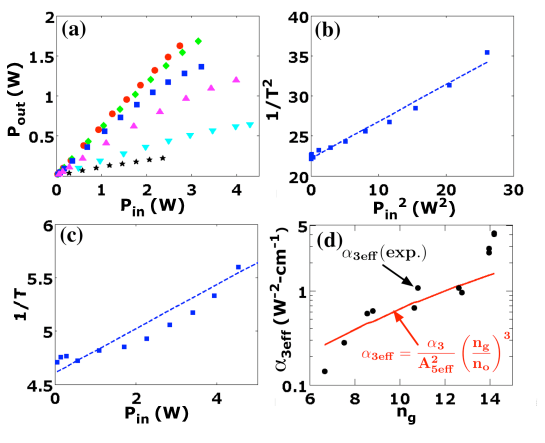
In Fig. 2(a), we first examined at different group velocities and same input power range to illustrate the enhanced nonlinear absorption processes. At the largest group velocities, is linear while at smaller group velocities the output power begins to saturate, indicating the distinct onset and slow-light enhancement of ThPA, an intensity dependent loss mechanism, in the slow-light regime. The nonlinear propagation equation () with symmetric input-output coupling gives:
| (1) |
where includes the 5th-order modal effective area, and . The bulk coefficient, , was calculated from a well-cited model[35], experimentally verified for the similar AlGaAs material in Ref. [27].
In Fig. 2(b), we illustrate an example plot of versus to extract the effective nonlinear ThPA coefficient and coupling factor at a particular group index of 8.8. We note the material-dispersion of the nonlinear susceptibilities is negligible within our measurement range. An example two-photon absorption ( versus ) analysis [27] [Fig.2(c)] shows clear mismatch of the experimental data (blue squares) with the TPA fit (dashed line). Similar fits occur for all group velocities investigated, thus confirming the sample experiences only three-photon absorption. We note that, for the group velocities we examined, the linear loss coefficient has been observed to scale [12, 34, 36] approximately as , with our measured values of 1 dB/mm at 1526 nm [37]. In the semilog plot of Fig. 2(d), we illustrate the extracted three-photon values in the slow-light regime. In this first observation of three-photon absorption in PhCWGs, we further emphasize that a surprising 30-fold enhancement in three-photon coefficient from 0.15 to 4 was observed with increasing only from 6.6 to 14.2. While the field enhancement of nonlinear absorption due to slow-light can be predicted from the material() and device parameters () and is known to obey a prescribed trend[14], here the deviation in the shape of the trajectory with group index () is markedly different than the scaling predicted from exclusively slow-light effects, an indication that some other field enhancement effect is involved. Moreover, this enhancement is by far faster than the predicted scaling from the definition of the ThPA coefficient [38], enhancement expected from simple slow-light effects. We now further elaborate on this point in terms of pulse self-phase modulation due to the optical Kerr effect.
2.3 Nonlinear characterization - Kerr-effect
To further illuminate this nontrivial scaling, we measured the output spectra at different slow group velocities [1526, 1534, and 1538 nm in Figs. 3(a), (b), and (c) respectively]. At increased input intensities, the pulses undergo stronger Kerr self-phase modulation with the associated spectral broadening. In each plot, we show examples of low (dot-dashed black line) and high (2 W; solid blue line) power spectra. For group indices less than 10, a clear increase in spectral width was observed with increasing group index, while maintaining the same coupled peak power. The fine-peaked structure in the pulse spectra is due to disorder-enhanced scattering [31]. The high-power spectra exhibit symmetric double-peak structures characteristic of Kerr-induced SPM, where the pulse spectral symmetry rules out free-carrier dispersion generated by ThPA [18] or third-order dispersion [39, 40].
| Parameter | Value | Value | Value | Value. |
|---|---|---|---|---|
| Wavelength | ||||
| Pulse duration (FWHM) | ||||
| Chirp | ||||
| Time-bandwidth product | ||||
| Peak Power | ||||
| Group index | ||||
| GVD | ||||
| Eff. ThPA | ||||
| SPM gain |
To further quantify our experimental results, we performed numerical simulations of the nonlinear Schrödinger equation[41]:
| (2) |
where is the pulse envelope amplitude with , [ps2/mm] the GVD parameter, is the propagation direction, and defined in a moving reference frame. The effective nonlinear coefficients are defined according to Ref. [42, 43] and modes from planewave expansion [32]. We computed for the fifth-order nonlinearity, ThPA, and for the third-order Kerr nonlinearity. Our calculations show that over the wavelength range and waveguide geometry examined here. The third-order area ranged from and for the wavelengths examined, an increase far smaller than the slow-light scaling. Assuming a conservative absorbed energy per pulse due to ThPA of 20%, for a (4 ps) this corresponds to pJ or less distributed along the full length of the waveguide (1.5 mm). At the repetition rate (22 MHz) of the laser, the average absorbed power would then be on the order of tens of W. Thus at the power levels used in the experiment, free-carrier effects contribute negligibly to the pulse dynamics in the GaInP material. Positive chirped (chirp parameter ) hyperbolic-secant input pulses[41], such as those generated by the mode-locked fiber laser in the experiment, are used. The variation of the chirp over the wavelength range is a characteristic property of the laser. A Kerr coefficient of [44], scaled with , along with the experimentally-extracted values of are used in our model. Table 1 summarizes the measured parameters in our model, with the peak power within of measured values (uncertainty from chirp and pulsewidth).
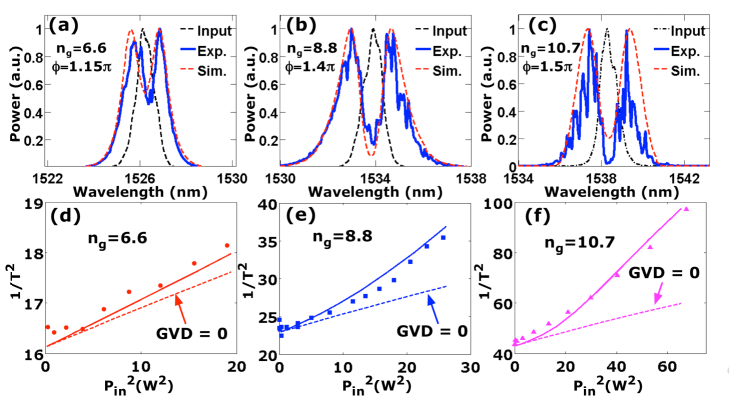
The resulting simulated spectra with chirp and GVD at three different group indices, =6.6, 8.8, and 10.7 in Figs. 3(a), (b), and (c), respectively, show remarkable matches with our measurements. To examine the effects of chirp and GVD on ThPA, in Fig. 3(d), (e), and (f) we demonstrate 1/T2 versus generated strictly from experimental parameters. The complete physical model not only describes the higher-order nonlinear absorption (1/T2 versus ), but also captures its scaling to larger values in both slope and curvature at lower group velocities. The inclusion of anomalous GVD in the model, and thus the possibility of pulse compression, not only reproduces the slight upward bending, but also rigorously and correctly predicts the increase of the effective absorption beyond the scaling. We note that higher order dispersion is still negligible. The slight upward bending in vs. plot is the signature of pulse-compression. We emphasize that despite this small bending, the fit for are quite good for all values examined. We also examined the case where GVD is set to zero as the dotted line in Figs. 3(d-f). The strong deviation between the simulation when GVD is zero and experimental data clearly demonstrate that GVD is interacting strongly with the nonlinear effects. We also simulated the absence slow-light effects, that is . In all cases, the curves were well below the experimental data, and nearly overlapped the zero GVD simulation data. These are not included here for figure clarity.
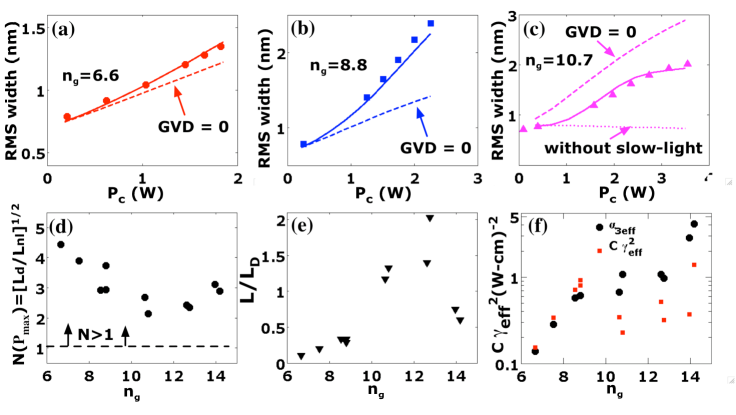
To further examine the impact of pulse compression on the slow-light Kerr nonlinearity, we quantified the measured SPM-induced spectra broadening with: , where is the lineshape. Illustrative measurements of spectral broadening at =6.6, 8.8, and 10.7 for increasing coupled power are shown in Fig. 4(a), (b), and (c), respectively. While SPM alone (dashed line) produces a linear slope that has a slight downward curvature due to higher-order absorption for large , the spectral widths including the effects of GVD mark a significant departure from a linear slope, as observed both experimentally (markers) and numerically(solid line). Fig. 4(c) in particular demonstrates a saturation of the spectral broadening at larger input powers. This is confirmed to arise from a combination of ThPA and GVD in the numerical model. We additionally plot the case without slow-light effects as the dashed line. Clearly slow-light has a strong impact on the spectral broadening, as the behavior is completely linear. Similar results occur at the other wavelengths.
2.4 Discussion of non-trivial scaling
Thus far we have observed trends in both our ThPA and Kerr measurements that do not obey conventional slow-light scalings. Clearly a field enhancement effect beyond slow-light enhancement is occurring in the sample. Based on the necessity of including GVD in our modeling, and with knowledge that pulse compression (resulting from the interaction of the Kerr self-phase modulation and anomalous dispersion) causes increased peak power of an optical pulse [41], we investigated pulse compression as a source of the additional local field in our PhCWG. We first computed the dispersion length, , ( 14 mm at 1526 nm and 1.3 mm at 1538 nm) and the nonlinear length, , ( 1.3 mm at 1526 nm and 0.45 mm at 1538 nm) [41] at the various pulse center frequencies of our slow-light experiments. The results, , are plotted in Fig. 4(d). For and , pulse compression is possible[41]. There is, however, an additional criterium to observe pulse compression. The requirement is that the pulse must propagate a minimum distance compared to , the dispersion length, and depends on . This implies that the physical device length must be comparable to , typically at least [41]. Figure 4(e) demonstrates the second key parameter, the ratio, for the experimental data. While is always greater than one, the dispersion length here decreases such that increases from to as goes from 6.6 to 12.6. Thus while the pulses of the lowest three group indices experience some compression ( and ), the larger values experience more compression since they possess both and ratios of . Thus both criteria have been met. This accounts for the faster than predicted scaling of .
We now utilize the extracted broadening data to determine the effective SPM coefficient from the nonlinear phase and spectral broadening: . Here the effective length is limited only by ThPA and hence must be defined differently from the typical linear loss parameter [45]. The enhancement of the three-photon absorption and SPM broadening are related through the field enhancement factor, , relating the propagating pulse power to the electric field energy density: . We thus have and , implying that scales as . In Fig. 4(f), we examine (black circles) and (red squares; scaled by a constant ) – the curves are remarkably similar, highlighting unambiguously that the non-trivial scalings of Kerr and ThPA have a common physical origin, that of strong field enhancement consistent with pulse compression.
3 Conclusion
We have demonstrated nonlinear scaling of the nonlinear enhancement beyond the limits of slow-light photonic crystal waveguides. This non-trivial scaling has been analyzed with experimental data of both self-phase modulation and three-photon absorption and further reinforced with a nonlinear propagation model. The origin of this non-trivial scaling beyond the slow-light regime is derived from an additional local field enhancement due to pulse compression. As Kerr is a third-order effect in field, while ThPA is a weaker fifth-order nonlinear effect, dispersion engineering to include pulse compression can greatly reduce the threshold of SPM, while carefully managing ThPA and its undesirable properties. The ability to engineer PhCWG dispersion[8], such as with low group velocity dispersion [46] to precisely control the pulsewidth, while completely suppressing TPA, make GaInP PhCWGs promising for compact broadband ultra-fast optics.
Acknowledgments
This work was supported by the European Commission (project GOSPEL), the Fulbright Grant (C. Husko), the National Science Foundation, and the New York State Foundation for Science, Technology and Innovation. We thank R. Gabet and Y. Jaouën (Telecom ParisTech) for OLCR setup and acknowledge discussions with J. F. McMillan.