The low wind expansion velocity of metal-poor carbon stars in the Halo and the Sagittarius stream††thanks: Based on observations made at the James Clerk Maxwell Telescope under program M08AU01††thanks: Based on observations made at the Very Large Telescope at Paranal Observatory under the program 082.D-0836
Abstract
We report the detection, from observations using the James Clerk Maxwell Telescope, of CO J 3 2 transition lines in six carbon stars, selected as members of the Galactic Halo and having similar infrared colors. Just one Halo star had been detected in CO before this work. Infrared observations show that these stars are red (J-K 3), due to the presence of large dusty circumstellar envelopes. Radiative transfer models indicates that these stars are losing mass with rather large dust mass-loss rates in the range 1–3.3 M⊙yr-1, similar to what can be observed in the Galactic disc. We show that two of these stars are effectively in the Halo, one is likely linked to the stream of the Sagittarius Dwarf Spheroidal galaxy (Sgr dSph), and the other three stars certainly belong to the thick disc. The wind expansion velocities of the observed stars are low compared to carbon stars in the thin disc and are lower for the stars in the Halo and the Sgr dSph stream than in the thick disc. We discuss the possibility that the low expansion velocities result from the low metallicity of the Halo carbon stars. This implies that metal-poor carbon stars lose mass at a rate similar to metal-rich carbon stars, but with lower expansion velocities, as predicted by recent theoretical models. This result implies that the current estimates of mass-loss rates from carbon stars in Local Group galaxies will have to be reconsidered.
keywords:
circumstellar matter – infrared: stars — carbon stars — AGB stars — stars: mass loss1 Introduction
Stars with initial masses in the range 0.8–8 M⊙ end their life with a phase of catastrophic mass-loss. During the asymptotic giant branch (AGB) phase, they develop a superwind leading to mass-loss rates up to 10-4M⊙ yr-1. This superwind enriches the ISM with newly synthesized elements.
The mass-loss mechanism of AGB stars is likely due to pulsations from the star and radiation pressure on dust grains. Shocks due to pulsation extend the atmosphere, so that the material ejected by the star becomes dense and cold enough for dust to form. Due to its opacity, dust absorbs the radiation from the star and is driven away by radiation pressure, carrying the gas along through friction. Theoretical models (Winters et al. 2000), show that the mass loss evolves from a pulsation driven regime characterized by a low mass-loss rate and a slow expansion velocity to a dust-driven regime with a high mass-loss rate and a high expansion velocity (5km.s-1).
Studying the effect of metallicity on the mass-loss process is important to understand the formation of dust around AGB stars in the early Universe. At low metallicity, less seeds are present for dust formation, so one might expect dust formation to be less efficient and thus the mass-loss rates to be lower.
Theoretical work by Bowen & Willson (1991) predicts that for metallicities below [Fe/H] dust-driven winds fail, and the wind must stay pulsation-driven. However, observational evidence for any metallicity dependence is still very limited (Zijlstra 2004). More recent observational (Groenewegen et al. 2007) and theoretical works (Wachter et al. 2008; Mattsson et al. 2008) indicate that the mass-loss rates from carbon stars in metal-poor environments are similar to our Galaxy.
To obtain the first observational evidence on mass-loss rates at low metallicity, we have carried out several surveys with the Spitzer Space Telescope of stars in nearby dwarf galaxies. These show significant mass-loss rates down to Z=1/25 Z⊙ (Lagadec et al. 2007b; Matsuura et al. 2007; Sloan et al. 2009), but only for carbon-rich stars. The current evidence indicates that oxygen-rich stars have lower mass-loss rates at lower metallicities. For carbon stars, no evidence for a dependency of mass-loss rate on metallicity has yet been uncovered. Consequently, (Lagadec & Zijlstra 2008) have proposed that the carbon-rich dust plays an important role in triggering the AGB superwind.
The main uncertainty arises from the unknown expansion velocity. This parameter is needed to convert the density distribution to a mass-loss rate. The expansion velocity is also in itself a powerful tool. Hydrodynamical simulations (Winters et al. 2000), have shown that radiation-driven winds have expansion velocity in excess of 5 km s-1, while pulsation-driven winds are slower.
There is some evidence that expansion velocities are lower at low metallicity, from measurement of OH masers (Marshall et al. 2004). However, OH masers are found only in oxygen-rich stars, which appear to have suppressed mass-loss at low metallicities. We lack equivalent measurements for metal-poor carbon-rich stars, which do reach substantial mass-loss rates. For these, the only available velocity tracer is CO. Currently, extra-galactic stars are too distant for CO measurements. However, there are a number of carbon stars in the Galactic Halo, which are believed to have similarly low metallicity. One CO measurement exists for a Galactic Halo star: its expansion velocity has been estimated to be 3.2 km s-1 through the 12CO transition (Groenewegen et al. 1997). This is much lower than typical expansion velocities, which are in the range 10-40 km s-1 for stars with similar colours, and thus optical depths (Fig.1).
A large number of metal-poor carbon stars have recently been discovered in the Galactic Halo (Totten & Irwin 1998; Mauron et al. 2004, 2005, 2007). These stars may have been stripped from the Sagittarius Dwarf Spheroidal galaxy (Sgr dSph), which has a metallicity of [Fe/H] (Van de Bergh 2000). These stars are the closest metal-poor carbon stars known, and they are bright enough to be detected in CO using ground-based millimeter telescopes.
We have carried out observations of six Halo carbon stars in the CO J transition. Here, we report the results of these observations.

2 Sample selection
Mauron et al. (2004, 2005, 2007) and Mauron (2008) have discovered 100 carbon stars in the Galactic Halo, adding to the sample of 50 described by Totten & Irwin (1998). All of these stars are spectroscopically confirmed carbon stars. Only the brightest can be detected in the sub-millimeter range. We selected the six stars with the highest IRAS 12m flux observable with the James Clerk Maxwell Telescope (JCMT, Mauna Kea, Hawaii). The emission from an AGB star at 12m is due to thermal emission from the dust in the envelope. Thus one expects the stars with the largest 12m flux to be the brightest in CO. All the observed stars have 34 and have thus a similar dust optical depth and a large circumstellar dusty envelope.
Table 1 describes the observational properties of the selected stars. One of these stars, IRAS 12560+1656 (Beichman et al. 1990), is the only Halo carbon star that had previously been detected in CO J (by Groenewegen et al. 1997).
| IRAS name | Other name | RA | Dec | K | JK | f8.59 | f13.04 | f17.65 | f12 | [12] | Z |
|---|---|---|---|---|---|---|---|---|---|---|---|
| (J2000) | mag | mag | Jy | Jy | Jy | Jy | mag | kpc | |||
| IRAS 041880122 | CGS 6075 | 04 21 27.25 | 01 29 13.4 | 6.420 | 3.280 | 4.99 | 2.67 | 1.64 | 3.37 | 2.31 | -2.63 |
| IRAS 084270338 | CGS 6306 | 08 45 22.27 | 03 27 11.2 | 6.255 | 3.410 | - | - | - | 6.50 | 1.60 | 2.03 |
| IRAS 113081020 | CGS 3052 | 11 33 24.57 | 10 36 58.6 | 4.568 | 3.830 | - | - | - | 57.37 | -0.77 | 1.41 |
| IRAS 163390317 | CGS 3716 | 16 36 31.70 | 03 23 37.5 | 6.098 | 3.906 | 12.49 | 10.83 | 5.60 | 14.57 | 0.72 | 1.73 |
| IRAS 125601656 | CGS 6500 | 12 58 33.50 | 16 40 12.0 | 7.820 | 3.480 | - | - | - | 0.77 | 3.91 | 8.96 |
| IRAS 181204530 | 18 13 29.6 | 45 31 17.0 | 6.710 | 3.809 | - | - | - | 7.86 | 1.39 | 2.20 | |
3 Observations and data reduction
We observed the CO J 3 2 (345 GHz) line emission from the six selected carbon stars from the JCMT using the heterodyne focal-plane array receiver (HARP; Smith et al. 2008). Observations were carried with a bandwidth of 1 GHz and a frequency resolution of 0.977 MHz, giving a velocity coverage of 400 km s-1. To increase the signal-to-noise ratio of our observations, we used a 30” beam switch to keep one detector on the source at all times. We used the Starlink software to reduce the resulting data. Fig. 2 shows the six CO 3–2 lines we detected.
We obtained mid-infrared photometric observations of two stars from our sample using VISIR (Lagage et al. 2004) on the VLT. The observations were taken using four filters centred at 8.59m (PAH1, =0.42m), 11.25m (PAH2, =0.59m), 13.04m (NeII 2, =0.22m) and 17.65m (Q1, =0.83m). We used the standard mid-infrared chop-and-nod technique to remove the background emission from the telescope and sky. Standard stars were observed just after each observation for flux calibration. The data were reduced using the IDL routines developed and described by Lagadec et al. (2008).
| Adopted name | peak | VLSR | FWHM | flux | rms | Integration time | |
|---|---|---|---|---|---|---|---|
| K | km.s-1 | km.s-1 | km.s-1 | K. km.s-1 | K | mn | |
| IRAS 04188+0122 | 0.04 | 4.8 | 11.5 | 17.3 | 0.77 | 0.009 | 616 |
| IRAS 08427+0338 | 0.03 | 20.9 | 16.5 | 17.4 | 0.55 | 0.010 | 45 |
| IRAS 11308-1020 | 0.79 | 20.8 | 11.5 | 12.9 | 10.86 | 0.049 | 90 |
| IRAS 16339-0317 | 0.19 | -83.1 | 8.5 | 12.6 | 2.59 | 0.030 | 182 |
| IRAS 12560+1656 | 0.03 | 88.6 | 3. | 4.5 | 0.14 | 0.008 | 453 |
| IRAS 18120+4530 | 0.08 | -268.0 | 6.5 | 8.3 | 0.72 | 0.019 | 227 |

4 CO line properties
Fig. 2 shows that the six lines we detected have parabolic profiles, which arise when the envelopes of the observed stars are spherical, unresolved by the telescope, have a constant expansion velocity exp, and the CO 3–2 line is optically thick (Knapp & Morris 1985). This can be described as:
| (1) |
where is the peak emission temperature, is the expansion velocity of the envelope, and VC the velocity of the line. We fitted this function to the observed data with a least-squares technique. Table 2 lists the resulting properties of the observed lines. The CO lines detected for IRAS 12560+1656 is rather weak, but can be considered as a real detection as it was already detected in another transition by Groenewegen et al. (1997).
Fig. 1 shows the distribution of expansion velocities for our sample. As expected, the flux measured in the CO 3–2 line correlates strongly with the IRAS 12m flux (Fig. 4). The best linear fit to the data is obtained for:
| (2) |
5 Dust mass-loss rates
Two techniques are usually used to estimate dust mass-loss rates from AGB stars: by measuring the near- and mid-infrared flux of the stars (Whitelock et al. 1994, 2006; Lagadec et al. 2008) or by using radiative transfer models. We apply both methods here. We estimated the mass-loss rates by measuring the Ks[12] colour, where Ks is the 2MASS 2.16m magnitude and [12] the IRAS 12m magnitude, according to the relation from Whitelock et al. (2006):
| (3) | |||||
where [12] is the IRAS 12m magnitude assuming a zero-magnitude flux of 28.3 Jy.
| Target | Luminosity | Teff | Tin | SiC/AMC | (0.55m) | Distance | ||
|---|---|---|---|---|---|---|---|---|
| (L | (10-8M⊙yr-1) | (K) | (K) | (10-8M⊙yr-1) | kpc | |||
| IRAS 04188+0122 | 8221 | 1.0 | 2800 | 1200 | 0.1 | 10. | 1.6 | 6.2 |
| IRAS 08427+0338 | 10124 | 1.8 | 2800 | 1200 | 0. | 10. | 2.5 | 5.6 |
| IRAS 11308-1020 | 16793 | 2.9 | 2800 | 1200 | 0. | 10. | 3.9 | 2.4 |
| IRAS 16339-0317 | 6976 | 1.8 | 2800 | 1200 | 0. | 17.8 | 4.0 | 4.8 |
| IRAS 12560+1656 | 7563 | 0.4 | 2800 | 1200 | 0. | 10. | 1.4 | 11.4 |
| IRAS 18120+4530 | 13391 | 1.4 | 2800 | 1200 | 0.1 | 10. | 3.9 | 6.5 |
We obtained an alternative estimate of the dust mass-loss rates using a radiative transfer model. We used the radiative transfer code DUSTY (Ivezić & Elitzur 1997). This code solves the 1-dimensional problem of radiation transport in a dusty environment. For all of our models, we assume that the irradiation comes from a point source (the central star) at the centre of a spherical dusty envelope. The circumstellar envelope is filled with material from a radiatively driven wind. All of the stars are carbon-rich, and the dust consists of amorphous carbon. We did not add SiC to our model, except for IRAS 04188+0122 and IRAS 16339-0317, for which a fit was impossible without SiC. Optical properties for these dust grains are taken from Hanner (1988) and Pegourié (1988) for amorphous carbon and SiC, respectively. The grain size distribution is taken as a typical MRN distribution, with a grain size varying from 0.0005 to 0.25m distributed according to a power law with n() with =3.5 (Mathis et al. 1977). The outer radius of the dust shell was set to 103 times the inner radius; this parameter has a negligible effect on our models.
To model the emission from the central star, we used a hydrostatic model including molecular opacities (Loidl et al. 2001; Groenewegen et al. 2007). Our aim was to fit the spectral energy distribution, defined by the 2MASS photometry (J, H and K), our VISIR mid-infrared data, and the IRAS photometry (at 12 and 25m) to estimate the dust mass-loss rates. We fixed the dust temperature at inner radius (1220K), the mass ratio of SiC to amorphous (0 ) carbon dust and the effective temperature of the central star, Teff (2800K), unless a satisfactory fit could not be obtained with these parameters.
DUSTY gives total (gas+dust) mass-loss rates assuming a gas-to-dust ratio of 200. Estimating the gas-to-dust ratio of these stars is beyond the scope of this paper and will be the subject of a forthcoming paper using CO observations of these stars in other transitions and Spitzer spectra. We thus prefer to estimate dust mass-loss rates. The dust mass-loss rate can be obtained by dividing by the gas-to-dust mass ratio, assuming that the gas and dust expansion velocities are the same. Here we prefer to talk about dust mass-loss rates as inputs from our models as we are fitting infrared colours, and thus dust emission. The expansion velocity is an output for the DUSTY models, and we scaled our results using the expansion velocities we measured. Table 3 gives the results of the fits. The IRAS 12m flux is an outlier for IRAS 163390317. This is certainly due to variability or to the fact that the aperture of the IRAS satellite is larger than the VISIR one.


6 Discussion
6.1 Mass loss and evolution
The detection of resolved CO lines in our six targets indicate that all of these stars are losing mass. Our VISIR observations, as well as IRAS and 2MASS observations, show that these stars are very red, which indicates the presence of circumstellar dust. To study the impact of the mass loss on the evolution of the studied stars, we compared the measured mass-loss rates with nuclear reaction rates and the classical single-scattering limit (see e.g., van Loon et al. 1999 and Lagadec et al. 2008).
Fig.5 shows the total (gas+dust) mass-loss rate as a function of the absolute magnitude. The absolute magnitude is taken from our DUSTY models. The total mass-loss rate is also an output from our DUSTY models, assuming a typical gas-to-dust mass ratio of 200. The dotted line shows the rate at which mass is consumed by nuclear burning and the dashed line the classical single-scattering limit as described by Lagadec et al. (2008). This shows that no multiple scattering is needed to explain the observed dust mass-loss rates. The mass-loss rates we measure are also well above the nuclear burning rate line, indicating that the evolution of these stars will be governed by the mass-loss process. Similar conclusions were drawn from observations of metal-poor AGB stars in the LMC, Fornax and Sgr dSph (van Loon et al. 1999, Lagadec et al. 2008).

6.2 Distances
| Adopted name | l | b | Period | D1 | D2 | D3 | D |
|---|---|---|---|---|---|---|---|
| days | kpc | kpc | kpc | kpc | |||
| IRAS 04188+0122 | 192.1775 | -31.9867 | 359 | 7.3 | 6.0 | 6.4 | 6.50.6 |
| IRAS 08427+0338 | 223.4859 | +26.8173 | 288 | 6.6 | 5.3 | 5.1 | 5.50.8 |
| IRAS 11308-1020 | 273.6969 | +47.7772 | - | 2.8 | 2.1 | - | 2.50.5 |
| IRAS 16339-0317 | 012.7346 | +27.7944 | - | 5.6 | 4.2 | - | 4.91.0 |
| IRAS 12560+1656 | 312.2528 | +79.4127 | - | 13.3 | 10.7 | - | 12.01.9 |
| IRAS 18120+4530 | 073.0530 | +25.3482 | 408 | 7.6 | 5.7 | 6.7 | 6.70.9 |
Most of the methods to determine mass-loss rates rely on an accurate distance to the observed stars. To determine these distances, we applied three methods. Two are based on near-infrared colours; the third is the period-luminosity relationship.
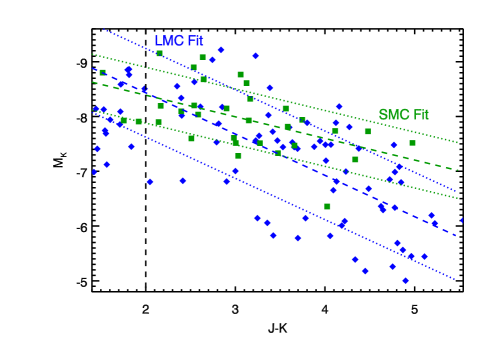
The first method uses the infrared colours of the observed stars, using the relation between MK and JK determined by Sloan et al. (2008). They found from a sample of carbon stars in the Small Magellanic Cloud (SMC) that:
| (4) |
Mauron et al. (2008) compared the near-infrared 2MASS photometry of stars in the Halo and the Large Magellanic Cloud (LMC) and found a different relationship from the one above between JK and MK. Their relation gives fainter MK values at a given JK colour than that of Sloan et al., with the difference increasing with redder colours. We have recalibrated the relation for the LMC, using the samples of stars confirmed to be carbon-rich with the Infrared Spectrograph on Spitzer by Zijlstra et al. (2006), Buchanan et al. (2006), Leisenring et al. (2008), and Sloan et al. (2008). We find that:
| (5) |
for JK colours greater than 2.0. This calibration of the JK relation is our second method. Fig. 6 compares the SMC and LMC calibrations of the relation between MK and JK.
The scatter in the LMC sample is 0.81 magnitudes about the fitted line, compared to 0.51 magnitudes for the SMC sample. The two fitted lines yield nearly identical distances at JK = 2, but as the colour grows redder, the samples diverge from each other. At JK = 5, the difference in is a full magnitude. For the colours in our sample, the two methods yield results differening by 0.41 to 0.64 magnitudes, comparable to the spread in the SMC sample. The different slopes in the two samples may result from their different metallicities, but that is only speculation on our part.
The third method utilises the period-luminosity relation for carbon Miras described by Feast et al. (2006):
| (6) |
With an uncertainty of 0.24 magnitudes. We derived the bolometric magnitudes using the equation for bolometric correction derived by Whitelock et al. (2006), after converting all of the photometry to the SAAO system as described by Lagadec et al. (2008):
| (7) | |||||
Table 4 presents the obtained distances, D1, D2 and D3 respectively. For those stars without periods, the final estimated distance is the average of D1 and D2. For those stars with periods, the D1 and D2 values bracket D3 in two of the three cases. Consequently, we first averaged D1 and D2, then averaged the result with D3 to arrive at our final estimate of the distance. The uncertainties in the final estimated distances are the the standard deviation of the individual distances.
6.3 Galactic location of the stars
Knowing the distance to the stars and their allows us to study their location in the Galaxy. All six stars examined here have been classified previously as members of the Halo, based on their distances from the Galactic plane. Our CO observations give us velocity information for these stars, which we can compare to Galactic rotation models. Table 4 lists the Galactic coordinates l and b.
Fig.7 shows the location of our six carbon stars on an Aitoff projection. The dashed line schematically represents the Sgr dSph orbit (Ibata et al. 2001). One of our stars, IRAS 12560+1656, lies very close to this orbit. Its is in the range of the observed for stars in the Sgr dSph stream. IRAS 12560+1656 very likely belongs to this stream. Our observations are thus certainly the first CO observations of an extragalactic AGB star. Two other stars, IRAS 16339-0317 and IRAS 18120+4530, have large negative , fully consistent with membership in the Halo. Finally, IRAS 04188+0122, IRAS 08427+0338, and IRAS 11308-1020 have a distance, location and consistent with membership in the thick disc. These three last stars thus have a metallicity between that of the thin Galactic disc and the Galactic Halo, the average metallicity of the thin disc being -0.17 while the one of the thick disc is -0.48 (Soubiran et al., 2003). Our sample thus contains three metal-poor AGB stars and three AGB stars with intermediate metallicity.

6.4 Low expansion velocities in the Halo
The present observations allow us to directly measure the expansion velocity for a sample of carbon stars in the Halo. The stars we observed are quite red (3JK4), and have substantial circumstellar dusty envelopes responsible for the observed reddening. Our measured expansion velocities are in the range 3–16.5 km s-1. The expansion velocity of carbon stars increases during the evolution on the AGB (Schoïer, 2007), i.e. when the dusty envelope becomes optically thicker. To compare the expansion velocities we measured in Halo carbon stars with carbon stars in the disc, we took a sample of carbon stars in the disc with colours similar to our sample. We selected all of the carbon stars with 3JK4 in the extensive catalogue of CO observations of evolved stars by Loup et al. (1993). Fig.1 compares the distribution of expansion velocities in the two samples. The Halo carbon stars clearly have a lower mean expansion velocity.
The three stars in the Halo and the Sgr dSph stream have in the range 3–8.5 km s-1, while the three stars associated with the thick disc have velocities ranging from 11.5 to 16.5 km s-1. The latter range is at the low end of expansion velocities for AGB stars with similar near-infrared colours in the thin disc.
6.5 Origin of the low expansion velocities
Section 6.3 and 6.4 have shown that the three stars we observed in the Halo and Sgr dSph stream have low expansion velocities. The stars we observed in the thick disc have expansion velocities intermediate between those typically observed in the Halo and the thin disc. This difference could arise from differences in metallicity, with the more metal-poor carbon stars having the slower winds.
Mattsson et al. (2008) and Wachter et al. (2008) have recently conducted theoretical investigations of the winds from metal-poor carbon stars. Both studies show that metal-poor carbon stars can develop high mass loss rates, leading to the formation of a large dusty envelope, in agreement with spectroscopic observations from Spitzer of AGB stars in metal-poor galaxies (Zijlstra et al. 2006; Sloan et al. 2006; Groenewegen et al. 2007; Lagadec et al. 2007; Matsuura et al. 2007; Leisenring et al. 2008; Lagadec et al. 2009; Sloan et al. 2009).
Wachter et al. (2008) predict that the outflow velocities from carbon stars should be lower in metal-poor environments, because of the lower gas-to-dust mass ratio and because the formation of less dust leads to less efficient acceleration of the wind outside of the sonic region. This interpretation is consistent with our interpretation that the low expansion velocities we have observed in the Halo are due to their low metallicities.
Hydrodynamical models (Winters et al. 2000, Wachter et al. 2008) distinguish two types of models. Model A applies to cases where the radiation pressure on dust is efficient. Mass-loss rates can exceed 10-7M⊙ yr-1, and expansion velocities can climb above 5 km . Model B applies to cases where pulsations drive the mass loss. In these cases, the mass-loss rates and expansion velocities are smaller. The mass loss occurs in a two-step process, with stars first losing mass due to pulsations, followed by acceleration due to radiation pressure on the dust grains. The high mass-loss rate and low expansion velocity of TI 32 does not fit either of these models, possibly because metal-poor carbon stars can develop strong mass-loss from pulsation alone.
7 Conclusions and perspectives
We have detected the CO J 3 2 in six carbon stars selected as Halo stars. Only one carbon star had been detected in CO previously. Comparison of the infrared observations and radiative transfer models indicates that these stars are losing mass and producing dust. Their mass-loss rates are larger than their nuclear burning rates, so their final evolution will be driven by this mass-loss phenomenon.
We show that three of the observed stars are certainly members of the thick disc, while one is in the Sgr dSph stream and two are in the Halo. The CO observation of the Sgr dSph stream star are thus the first identified millimetre observations of an extragalactic AGB star. The expansion velocity we determined from our CO observations are lower than those of carbon stars in the thin disc with similar near-infrared colours. The observed carbon stars with the lowest expansion velocities are Halo or Sgr dSph stream carbon stars. There is a strong indication that the expansion winds are lower in metal-poor environments, which agrees with recent theoretical models (Wachter et al. 2008).
So far, the effect of metallicity on the mass-loss from carbon-rich AGB stars has studied primarily from infrared observations of AGB stars in Local Group galaxies, mostly with the Spitzer Space Telescope. Infrared observations measure the infrared excess, which can be converted to a mass-loss rates assuming an expansion velocity for the circumstellar material. So far all of the mass-loss rates have been estimated using the assumptions that the expansion velocity is independent of the metallicity. The results presented here show that this assumption needs to be reconsidered.
We have recently obtained spectra of some of the present sample with the Infrared Spectrograph on Spitzer. Combining our CO observations and these spectra together and comparing them to Spitzer spectra from carbon stars in other galaxies in the Local Group will allow us to quantitatively study the mass-loss from carbon-rich AGB stars in the Local Group and its dependence on metallicity. This will be the subject of a forthcoming paper.
Acknowledgments
EL wishes to thank the JAC staff for their great help carrying out this program, and Rodrigo Ibata for useful discussions about membership of stars to the Sgr stream. we thank the referee C. Loup for her useful comments that helped improving the quality of the paper.
References
- Beichman et al. (1990) Beichman, C. A., Chester, T., Gillett, F. C., Low, F. J., Matthews, K., & Neugebauer, G. 1990, AJ, 99, 1569
- Bowen & Willson (1991) Bowen, G. H. & Willson, L. A., 1991, ApJ, 375, 53
- Buchanan et al. (2006) Buchanan, C. L., Kastner, J. H., Forrest, W. J., Hrivnak, B. J., Sahai, R., Egan, M., Frank, A., Barnbaum, C. 2006, ApJ, 132, 1890
- Cutri et al. (2003) Cutri, R. M., et al., 2003, The IRSA 2MASS All-Sky Point Source Catalog, NASA/IPAC Infrared Science Archive, 2003, A&A, 406, 51
- Feast et al. (2006) Feast, M. W., Whitelock, P. A., & Menzies, J. W. 2006, MNRAS, 369, 791
- Groenewegen et al. (1997) Groenewegen, M. A. T., Oudmaijer, R. D., Ludwig, H.-G., 1997, A&A, 292, 686
- Groenewegen et al. (2007) Groenewegen, M. A. T., et al., 2007, MNRAS, 376, 313
- Hanner (1988) Hanner, M. 1988, Infrared Observations of Comets Halley and Wilson and Properties of the Grains, 22
- Ibata et al. (2001) Ibata, R., Lewis, G. F., Irwin, M., Totten, E., & Quinn, T. 2001, ApJ, 551, 294
- Ivezic (99) Ivezic, Z., Nenkova, M., & Elitzur, M., User manual for DUSTY, University of Kentucky internal report
- Knapp & Morris (1985) Knapp, G. R., & Morris, M. 1985, ApJ, 292, 640
- Lagadec et al. (2007) Lagadec, E., et al. 2007, MNRAS, 376, 1270
- Lagadec et al. (2008) Lagadec, E., Zijlstra, A. A., Matsuura, M., Menzies, J. W., van Loon, J. T., & Whitelock, P. A. 2008, MNRAS, 383, 399
- Lagadec & Zijlstra (2008) Lagadec, E., & Zijlstra, A. A. 2008, MNRAS, 390, L59
- Lagadec et al. (2009) Lagadec, E., et al. 2009, MNRAS, 549
- Leisenring et al. (2008) Leisenring, J. M., Kemper, F., Sloan, G. C. 2008, ApJ, 681, 1557
- Loidl et al. (2001) Loidl, R., Lançon, A., & Jørgensen, U. G. 2001, A&A, 371, 1065
- Loup et al. (1993) Loup, C., Forveille, T., Omont, A., & Paul, J. F. 1993, A&AS, 99, 291
- Marshall et al. (2004) Marshall, J. R., van Loon, J. T., Matsuura, M., Wood, P. R., Zijlstra, A. A., & Whitelock, P. A. 2004, MNRAS, 355, 1348
- Matsuura et al. (2007) Matsuura, M., et al. 2007, MNRAS, in press, astro-ph 0709.3199
- Mauron et al. (2004) Mauron, N., Azzopardi, M., Gigoyan, K., Kendall, T. R., 2004, A&A, 418, 77
- Mauron et al. (2005) Mauron, N., Kendall, T. R., Gigoyan, K., 2005, A&A, 438, 867
- Mauron et al. (2007) Mauron, N., Kendall, T. R., Gigoyan, K., 2007, A&A, 475, 843
- Mauron (2008) Mauron, N. 2008, A&A, 482, 151
- Mattsson et al. (2008) Mattsson, L., Wahlin, R., Höfner, S., & Eriksson, K. 2008, ArXiv e-prints, 804, arXiv:0804.2482
- Matsuura et al. (2006) Matsuura, M., Wood, P. R., Sloan, G. C.. Zijlstra, A. A., van Loon, J. Th., Groenewegen, M. A. T., et al., 2006, MNRAS, 371, 415
- Pegourie (1988) Pégourié, B. 1988, A&A, 194, 335
- Schöier (2007) Schöier, F. L. 2007, Why Galaxies Care About AGB Stars: Their Importance as Actors and Probes, 378, 216
- Sloan et al. (2006) Sloan, G. C., Kraemer, K. E., Matsuura, M., Wood, P. R., Price, S. D., Egan, M. P., 2006, ApJ, 645, 1118
- Sloan et al. (2008) Sloan, G. C., Kraemer, K. E., Wood, P. R., Zijlstra, A. A., Bernard-Salas, J., Devost, D., & Houck, J. R. 2008, ApJ, 686, 1056
- Sloan et al. (2009) Sloan, G. C., et al. 2009, Science, 323, 353
- Smith et al. (2008) Smith, H., et al. 2008, SPIE, 7020,
- Soubiran et al. (2003) Soubiran, C., Bienaymé, O., & Siebert, A. 2003, A&A, 398, 141
- Totten & Irwin (1998) Totten, E. J., & Irwin, M. J. 1998, MNRAS, 294, 1
- van de bergh (2000) Van de Bergh, The Galaxies of the Local Group, University Press, Cambridge, 2000
- van Loon et al. (1999) van Loon, J. Th., Zijlstra A. A., Groenewegen, M. A. T., 1999b, A&A, 346, 805
- Wachter et al. (2008) Wachter, A., Winters, J. M., Schröder, K.-P., & Sedlmayr, E. 2008, A&A, 486, 497
- Whitelock et al. (1994) Whitelock, P., Menzies, J., Feast, M., Marang, F., Carter, B., Roberts, G., Catchpole, R., & Chapman, J. 1994, MNRAS, 267, 711
- Whitelock et al. (2006) Whitelock, P. A., Feast, M. W., Marang, F., & Groenewegen, M. A. T. 2006, MNRAS, 369, 751
- Woźniak et al. (2004) Woźniak, P. R., et al. 2004, AJ, 127, 2436
- (41) Winters, J. M., Le Bertre, T., Jeong, K. S., et al., 2000, A&A, 361, 641
- Zijlstra (2004) Zijlstra, A. A., 2004, MNRAS, 348, L23