Redundant failures of the dip model of the extragalactic cosmic radiation
Abstract
The proton flux and the chemical composition of the cosmic
radiation measured, respectively, by the Kascade and Auger
experiments entail radical changes in Cosmic Ray Physics. A large
discrepancy emerges by comparing the proton flux predicted by the
dip model and that measured by Kascade in the critical energy
interval - eV.
It is mentioned and substantiated that the proton flux measurements
of the Kascade experiment are consistent with other pertinent empirical
observations. It is shown that the
chemical composition measured by Auger by two independent
procedures, using the mean depth reached by cosmic nuclei in giant
air cascades, is incompatible with that predicted by the dip model.
A notable consequence suggested here based on the
failures of the dip model
is that the spectral index softening of the primary cosmic radiation above
eV observed by HiRes and Auger experiments,
is not due to the
extragalactic cosmological protons suffering energy losses in the intergalactic space
via the reactions,
, ,
but to some physical phenomena occurring in the cosmic
vicinity.
1 Introduction
An abrupt progress has been recently occurred in Cosmic Ray Physics, which in many respects is a revolutionary change of the current notions of the discipline, due to some measurements of the Auger and Kascade Collaborations.
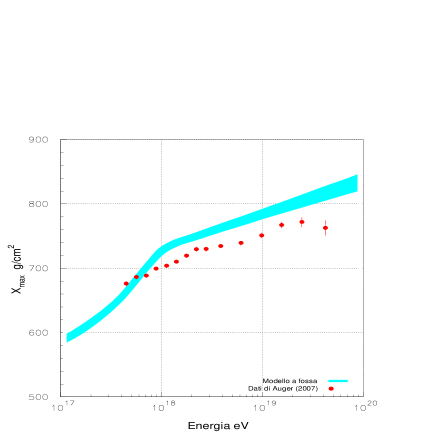
The Auger experiment has determined the chemical composition of the cosmic radiation by measuring the mean depth reached by cosmic nuclei in giant terrestrial cascades in air [1, 2] or the equivalent variable, . By two independent methods it has been established that in the energy interval - eV the cosmic radiation attaining the solar cavity consists predominantly of intermediate nuclei, and not of pure protons. Figure 1 reports the versus energy measured by the Auger experiment (red dots) [1].
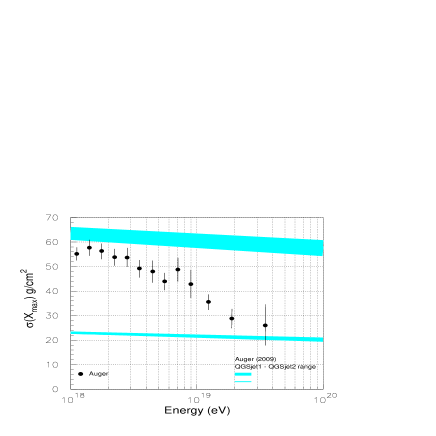
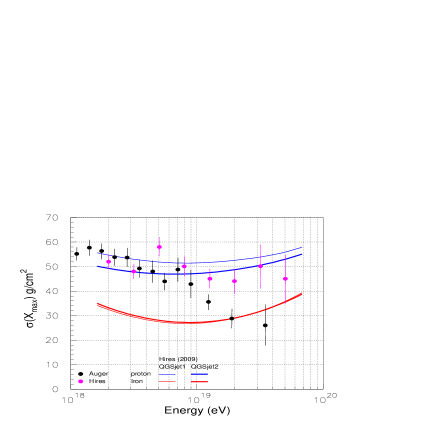
The Auger apparatus determines by fluorescent light released by nuclei penetrating the air. The longitudinal light profile recorded by the instrument is interpolated by an appropriate function, , which has a characteristic width denoted . The measurement of at a given energy for a number of atmospheric cascades determines the average value of the chemical composition of the cosmic radiation, which is a second method, besides . Figure 2 shows versus energy (black dots) measured by Auger [2] along with its theoretical estimates of for iron nuclei (turquoise lower band) and for protons (turquoise upper band).
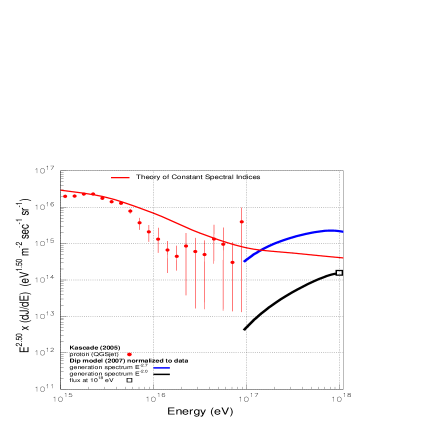
In a series of measurements the Kascade experiment has determined that the proton flux in the energy interval - eV is particles/( sr s ) [3, 4]. The proton flux has been measured by two methods hereafter referred to as QGSjet and Sibyll algorithms. Figure 3 reports the proton energy spectrum measured by Kascade using the QGSjet algorithm [3]. Data from the Sibyll algorithm [4] are equivalent for the purpose of this study and omitted for brevity.
It is the aim of this to show that the three independent quoted measurements are incompatible with the corresponding predictions of the dip model [5, 6].
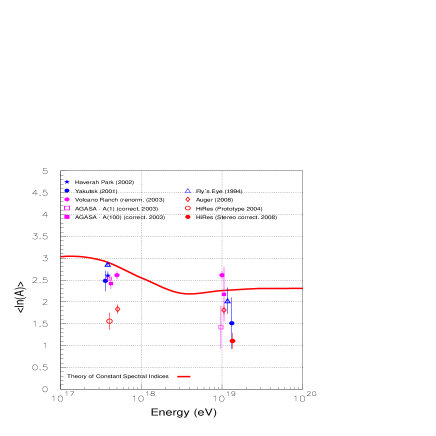
This benefits of a critical examination of the HiRes data on made in another study [7]. Figure 4 shows that above eV the HiRes data [8] on converted into differ systematically from those of the Volcano Ranch, Yakutsk, Akeno, Agasa, Haverah Park, Fly’s Eye and Auger experiment [7]. Figure 5 shows that the profile measured by HiRes [9] also differs from that measured by Auger [2] .
2 Measurements of and and related predictions of the the dip model.
The dip model proposed in 1988 states that extragalactic protons originated at cosmological distances can reach copiously the solar cavity. They interact with cosmic fossile photons with energies centered around eV and density of /, via the reaction: p , where denotes extragalactic proton and , electron pairs. The kinematical threshold of this reaction is at eV, a basilar reference energy of the dip model. Extragalactic protons would suffer energy losses in the intergalactic space via the quoted reaction generating a depression in the original unperturbed spectrum released by the extragalactic accelerator which has constant proton index in the range 2.0-2.7.
The dip model does not specify a precise acceleration mechanism, the exact sites where the accelerators operate, the spectral indices of the cosmic ions at the cosmic-ray sources (they are free parameters condensed in a single one ), the ion filtering at the injection to the accelerators at the low energy and other parameters. It preassumes that in the intergalactic proton displacement, besides the expansion of the universe, no major processes other than the reaction, p , intervene. While most of the unknowns of the dip model enumerated above are not surprising in the present status of the discipline, the intergalactic proton displacement affected only by the reaction, p (for instance, de-acceleration or re-acceleration processes with uneven magnitudes may take place) and a constant instead of a variable are rather fragile hypotheses.
The chemical composition of the dip model has been calculated and converted by others [10] into the corresponding versus energy using three different hadronic codes denoted QGSjet, QGSjet-2 and Sibyll [10]. The minimum and the maximum values of the of the dip model at a given energy are shown in figure 1 defining the colored turquoise band. It turns out that the Auger data are below the minimum values of the predicted profile.
If the cosmic radiation consisted of Fe nuclei only, the would occupy the turquoise lower band in figure 2, which spans from 23 / at eV down to 20 / at eV [2]. Similarly, the of pure proton cosmic rays would occupy the upper turquoise band in Figure 2, according to the QGSjet code adopted by Auger [2]. The simulated profile is less sensitive to the QGSjet code (quite narrow band), than the profile (large band). According to the 13 data points on measured by Auger, the primary cosmic radiation around eV consists abundantly of intermediate and heavy nuclei, since the computed and the observed almost joins.
Taking into account the dependence of on the mass of the cosmic nucleus [2], any ion abundances at a given energy can be converted into . It results that the Auger data in Figure 2 above eV exclude a proton dominance in the cosmic radiation as foreseen by the dip model (some 80-90 as stated in ref. [10]).
3 Proton flux measurements in Kascade and the related dip model predictions
The proton flux at eV derived from the dip model in its standard form and normalization with =2.0 [10] is particles/( sr s ) (black square in fig. 3). It results that the discrepancy between measured and theoretical flux (black square and extrapolated black curve) grazes more than two orders of magnitude at eV since the predicted extragalactic proton spectrum below eV has to descend whatsoever with decreasing energy from the value of particles/( sr s ) at eV.
The empirical foundation and solidity of this conclusion is examined in detail elsewhere [11]: proton fluxes in the Kascade data samples in the interval - eV exceed those obtained by QGSjet and Sibyll algorithms because of some contamination of the helium sample by protons (see Section 7 of ref. [11]). Enhanced proton data samples augment the flux and decrease error magnitudes in Figure 3.
Notice that the silouhette of the proton spectrum according to the dip model [10] between and eV with =2.7 shown in Figure 3 (blue curve) is and normalized to some experimental data in the band eV.
4 Data and cascade simulation codes in HiRes
Figure 5 shows the estimated theoretical profiles of and according to the HiRes experiment which adopts the hadronic codes QGSjet-1 and QGSjet-2 [9]. The first seven data points from Auger (black dots) in the interval - eV would fall above the theoretical profile obtained by the QGSjet-2 code. Therefore, eight Auger data points out of 13 would become unphysical (e.g. cosmic particles lighter than protons). Similarly, the last data point (Auger) is positioned below the theoretical profile suggesting that hyperheavy cosmic nuclei ( ) dominate the cosmic radiation above eV, or more plausibly, again, an unphysical condition develops. It may not be surprising that, in two independent areas of comparison (on and , the outcomes of the HiRes Collaboration might disagree with all other experiments. What is both surprising and embarrassing is that the hadronic codes to simulate nuclear interactions in air, in HiRes, over many years, generate more protons and less heavy nuclei than hadronic codes adopted in all other experiments. Figure 5 vividly demonstrates it in a recent example [9].
5 Conclusions
The fundamental tenet of the dip model is that protons observed in the solar cavity above eV have a cosmological origin and outnumber any other ion fractions. Since the dip model predicts unreal properties of the cosmic radiation, the dictates, out of a few alternatives, that spatial sources of the cosmic-ray protons are in the cosmic vicinity ( or or ). In this circumstance: how could a softening of the spectral index from 2.6 to about 3.5 take place in the interval - eV, if the extragalactic cosmological protons below eV do not reach the solar cavity ?
As the reaction does not alter any cosmic-ray spectrum in the solar cavity (first alternative), the companion reactions , , etc. can not cause the index softening above eV just because the extragalactic cosmological protons are missing.
The hypothesis that a cosmological extragalactic component would reach the solar cavity in the interval - eV but not below this energy band (second alternative) confront with three barriers: (1) protons suffering the energy losses via do not disappear but they accumulate below eV corrugating the spectrum; the dip model, as an example, attempts to calculate this effect with a simplified calculation scheme. (2) Any extragalactic accelerators, operating in the specific interval -, and eventually above this maximum energy, would intrinsically generate enough spill-over particles in the low energy edge, below , which plausibly corrugate the galactic spectrum. (3) The rising dominance of heavy ions with energy discovered by the Auger Collaboration (see figures 1 and 2) in the band - eV does not harmonize, for a number of reasons, with the aforementioned index softening.
The common value of 2.6-2.8 of the spectral index of the cosmic radiation close and below eV observed in all experiments (HiRes, Auger, Agasa, Yakutsk), disfavors and belittles the second alternative.
According to the present investigation, the softening of the spectral index of the cosmic radiation above eV is not due to any extragalactic cosmological protons. This conclusion might represent the most notable result rooted to the reaction as conceived and framed in the dip model.
References
- [1] M. Unger et al., (Auger Coll.) 30th ICRC Merida Mexico 594; also astro-ph/0706.1495 (2007).
- [2] M. Unger et al., (Auger Coll.) , (Auger Coll.) Conf. SOCoR 15-18 June 2009, Trondheim, Norway.
- [3] R. Engel et al., (Kascade Coll.) astro-ph/0504358 (2005).
- [4] K. H. Kampert et al., (Kascade Coll.) astro-ph/0405608 (2004).
- [5] V.S. Berezinsky and S.I. Grigorieva, Astron. and Astrophys, 199 (1988) 1.
- [6] V.S. Berezinsky, A. Z. Gazizov and S.I. Grigorieva, Phys. Letters B 612 (2005) 147.
- [7] A. Codino and F. Plouin, , to appear this week on astro-ph.
- [8] J. W. Belz , (HiRes Coll.) CRIS 2008, Nucl. Phys. B (Proc. Sup.) 165 (2009) 5-11.
- [9] P. Sokolsky, (HiRes Coll.) , Conf. SOCoR 15-18 June 2009, Trondheim, Norway.
- [10] R. Aloisio et al., Astro-ph/0706.2834v2, 19th November 2007.
- [11] A. Codino, , INFN Report/TC-09/06, (2009) Lab. Naz. di Frascati dell’ INFN, Frascati, Italy.