Fermi Observations of the Very Hard Gamma-ray Blazar PG 1553+113
Abstract
We report the observations of PG 1553+113 during the first 200 days of Fermi Gamma-ray Space Telescope science operations, from 4 August 2008 to 22 February 2009 (MJD 54682.7-54884.2). This is the first detailed study of PG 1553+113 in the GeV gamma-ray regime and it allows us to fill a gap of three decades in energy in its spectral energy distribution. We find PG 1553+113 to be a steady source with a hard spectrum that is best fit by a simple power-law in the Fermi energy band. We combine the Fermi data with archival radio, optical, X-ray and very high energy (VHE) gamma-ray data to model its broadband spectral energy distribution and find that a simple, one-zone synchrotron self-Compton model provides a reasonable fit. PG 1553+113 has the softest VHE spectrum of all sources detected in that regime and, out of those with significant detections across the Fermi energy bandpass so far, the hardest spectrum in that energy regime. Thus, it has the largest spectral break of any gamma-ray source studied to date, which could be due to the absorption of the intrinsic gamma-ray spectrum by the extragalactic background light (EBL). Assuming this to be the case, we selected a model with a low level of EBL and used it to absorb the power-law spectrum from PG 1553+113 measured with Fermi (200 MeV - 157 GeV) to find the redshift which gave the best fit to the measured VHE data (90 GeV - 1.1 TeV) for this parameterisation of the EBL. We show that this redshift can be considered an upper limit on the distance to PG 1553+113.
1 Introduction
PG 1553+113 is a high-frequency peaked BL Lacertae object (HBL; Falomo et al., 1994; Beckmann et al., 2002) whose redshift remains unknown despite continued efforts. Like all BL Lacs, we find its spectral energy distribution (SED) to have a double-peaked shape (in representation) that can thus be parameterised with four characteristic slopes. It has been detected from radio through hard X-rays and also in the very high energy (VHE; 100 GeV) regime up to energies above 1 TeV (Aharonian et al., 2006b; Albert et al., 2007). With these data three of the four components of its SED were sampled, namely, the rising and falling edges of the low-energy peak (10-6 eV - 30 keV) and the falling edge of the high-energy peak (90 GeV - 1 TeV). We report here the first detailed analysis of the rising high-energy portion and, crucially, the high-energy peak, of the PG 1553+113 SED. These data, from observations made by the Fermi Gamma-ray Space Telescope Large Area Telescope (Fermi LAT; Atwood et al., 2009) during its first 200 days of operation, are combined with data from other wavebands to construct and model the broadband SED of PG 1553+113 in Section 4.1.
Discovered and classified as a BL Lacertae object (BL Lac) by Green et al. (1986), PG 1553+113 is located at R.A. of = 15h55m43.04s and declination of = +11d11m24.4s in the constellation of Serpens Caput. The logarithmic ratio of its 5 GHz radio flux, , to its 2 keV X-ray flux, , has been found to range from log(/) = to (Osterman et al., 2006; Rector et al., 2003). The high value of this ratio places PG 1553+113 at times among the most extreme of the HBLs; a BL Lac is classified as extreme when it has log(/) -4.5 (Rector et al., 2003). A number of the TeV blazars have, at one time or another, exhibited fluxes that place them in this extreme category (e.g., 1ES 0229+200, H 1426+428, 1ES 1959+650; Rector et al., 2003).
In the radio band, PG 1553+113 has been detected at different mean flux levels. Its 4.8 GHz flux, for example, has ranged from 180 to 675 mJy (Bennett et al., 1986; Gregory & Condon, 1991; Becker et al., 1991; Perlman et al., 2005; Osterman et al., 2006). Its flux between 4.8 and 14.5 GHz was found to be variable on month timescales during the observations of Perlman et al. (2005) and Osterman et al. (2006). VLBA observations have resolved a jet extending at least 20 pc to the northeast of PG 1553+113 (Rector et al., 2003). No evidence for superluminal motion has been reported in the literature to date; multi-epoch VLBA monitoring has commenced recently111http://web.whittier.edu/gpiner/research/index.htm.
PG 1553+113 is a bright optical source with -band magnitude of (Falomo & Treves, 1990; Osterman et al., 2006). Observations taken between 1986 and 1991 with the ESO telescopes found its spectral index, , to remain almost constant () and its magnitude to vary by (Falomo et al., 1994). Low levels of optical variability were seen by Osterman et al. (2006) during their 2003 observing campaign. Limits on the magnitude of its host galaxy will be discussed later.
PG 1553+113 is also a bright X-ray source that has been observed by most X-ray missions (Einstein, ROSAT, ASCA, BeppoSAX, RXTE, XMM-Newton, Swift and Suzaku). Although it has been detected at a number of different flux levels by these observatories, no evidence for strong or fast (sub-hour) flux variability has been observed at X-ray energies (Reimer et al., 2008). The Suzaku observations performed in July 2006 (Reimer et al., 2008) provide the highest energy X-ray measurement so far obtained for PG 1553+113 at keV with a 10-30 keV flux of x erg cm-2 s-1. No evidence for spectral hardening up to these energies was found in these data, indicating that all of the X-ray emission detected was due to synchrotron emission. The 2-10 keV fluxes measured by different X-ray missions are shown in Table 1, the highest being erg cm-2 s-1 in October 2006 (Swift-XRT; Tramacere et al., 2007). The X-ray flux was found to double over a period of 10 days during the 3-week RXTE observing campaign of Osterman et al. (2006). Despite the variations of a factor of approximately 20 in the 2-10 keV X-ray flux, the measured spectral properties of PG 1553+113 at these energies, also listed in Table 1, have not changed significantly over the course of the X-ray observations. It exhibits spectral curvature that can be well-described with either a broken power law or a log-parabolic shape. In the Suzaku data this curvature extends into the hard X-ray band ( keV) and steepening of the spectrum above keV beyond that predicted by either the broken power-law or log-parabolic model is observed (Reimer et al., 2008).
In the high energy (HE; 100 MeV - 100 GeV) gamma-ray regime, PG 1553+113 was not detected by EGRET. An upper limit of 9.97 10-8 cm-2 s-1 above 100 MeV was derived based on the summed exposure of cycles 1, 2, 3 and 4 (Hartman et al., 1999). At higher energies, in the VHE regime, PG 1553+113 is a confirmed gamma-ray emitter. First detected by H.E.S.S. (Aharonian et al., 2006b) and subsequently confirmed by MAGIC (Albert et al., 2007), PG 1553+113 has a flux that is approximately 3% that of the Crab Nebula at these energies. The combined 2005-2006 H.E.S.S. data follow a power law with photon index of =4.46 0.34 between 225 GeV and 1.3 TeV (Aharonian et al., 2008). The MAGIC 2005-2006 spectra are consistent with this having a power-law photon index of =4.21 0.25 between 90 and 500 GeV (Albert et al., 2007). No evidence for variability of the spectral index, to within the measurement uncertainties, is seen in the VHE measurements. The H.E.S.S. and MAGIC integral flux levels are consistent from April to August 2005 and from April to July 2006 with a mean flux of (E GeV) = 2.0 0.8 10-11 cm-2 s-1. Although the spectrum remained unchanged, the flux detected by MAGIC between January and April 2006 was lower than the preceding and proceeding measurements at ( GeV) = 0.6 0.2 10-11 cm-2 s-1. When the systematic uncertainties on the fluxes are taken into account, this flux is marginally inconsistent with the VHE fluxes detected during the H.E.S.S. and other MAGIC observations suggesting that the PG 1553+113 flux varied by up to a factor of three on monthly timescales in 2006. PG 1553+113 has the steepest spectrum of all of the sources detected in the VHE regime, which makes it a promising target for the Fermi LAT because extrapolating down to the Fermi energy range would make this an extremely bright source unless a dramatic spectral break occurs at energies below 100 GeV. EGRET’s non-detection could be interpreted in this context or as the result of PG 1553+113 being in a lower emission state at that time than during the VHE observations. PG 1553+113 is in the Fermi LAT bright AGN source list (LBAS; Abdo et al., 2009a), the high-confidence AGN associations from the first three months of Fermi data. Listed as 0FGL J1555.8+1110 with a flux of ( 100 MeV) = 8.0 1.0 10-8 cm-2 s-1 and a photon index of = 1.70 0.06, it has one of the hardest spectra of the 106 AGN that comprise this list. Indeed, if only the AGN with a significant detection across the entire Fermi bandpass are considered, its spectrum is the hardest of those in the LBAS. This combination of a very soft VHE spectrum and a very hard HE spectrum means that PG 1553+113 has a significant spectral break in the gamma-ray regime.
Despite significant efforts, the redshift of PG 1553+113 remains unknown. Its measurement is of great interest both for a better understanding of its SED, in particular since it is an extreme BL Lac and therefore has a very hard synchrotron emission spectrum, and also for studying EBL effects; some redshift estimates make it the most distant VHE source detected to date at 0.78 (Sbarufatti et al., 2005), which, if shown to be the case, could imply an EBL density close to the minimum allowed by galaxy counts. The results of redshift studies undertaken to date are summarized in Section 3 and the archival gamma-ray data together with the Fermi data from PG 1553+113 are used to place constraints on its redshift.
2 Fermi Observations of PG 1553+113
The characteristics and performance of the LAT Instrument on the Fermi Gamma-ray Space Telescope are described in detail by Atwood et al. (2009). Presented here is the analysis of the Fermi LAT data from a region of 10∘ radius centred on PG 1553+113 from 4 August 2008 to 22 February 2009 (MJD 54682.7-54884.2)222Mission Elapsed Time 239,557,414 to 256,966,310 seconds.. These data were analyzed using the standard Fermi analysis software333ScienceTools v9r10 with instrument response function (IRF) P6_V3_DIFFUSE (Atwood et al., 2009).. Events with zenith angles were selected from the so-called “diffuse class”, those events having the highest probability of being a photon. Only events with energies greater than 200 MeV were used in this analysis. The extragalactic diffuse gamma-ray emission together with the residual instrumental background was modeled as a simple power-law while the galactic diffuse was modeled with GALPROP444The background file mapcube_54_59Xvarh7S.fits was used. (Strong et al., 2004b, Strong et al., 2004a).
There are two other Fermi sources within 10∘ of PG 1553+113. These sources, lying at angular separations of 1.8∘ and 5.5∘ from PG 1553+113 were modeled in our analysis so that they could be subtracted out along with the backgrounds described above. The nearest source to PG 1553+113, 0FGL J1553.4+1255, is located at R.A. of = 15h53m28.2s and declination of = +12d55m20.3s and is thus spatially coincident with the quasar QSO B1551+1305 (=1.29). It is detected up to approximately 10 GeV with an integral flux (200 MeV) of 5.67 0.38 10-8 cm-2 s-1 and photon index of 2.26 0.05. There is evidence for variability in its photon index and flux but neither are correlated with the signal detected from PG 1553+113. The LAT has a point spread function (PSF), , that decreases with increasing energy555The accurate parameterisation of the LAT PSF to be used for science analysis is described by the instrument IRF. The following simplified, acceptance-averaged approximation for the 68% containment angle might be useful as an illustration of the PSF energy dependence: .. For energies above 360 MeV, the PSF of the LAT is smaller than 1.8∘, the angular separation between PG 1553+113 and 0FGL J1553.4+1255. Therefore, for almost all of the energy range over which the PG 1553+113 data are analyzed here ( = 200 MeV - 400 GeV), the PSF of the LAT is such that the PG 1553+113 data are not significantly contaminated by the signal from 0FGL J1553.4+1255. To ensure that this was the case, we performed an analysis of the PG 1553+113 data with energy 400 MeV. The results obtained from this analysis are entirely consistent with those obtained when the full energy range ( 200 MeV) is considered.
The other source within 10∘ of PG 1553+113 is not in the LBAS. It is located at a R.A. of = 16h07m40.5s and declination of = +15d50m36.2s and was detected up to approximately 10 GeV with an integral flux (200 MeV) of 2.06 0.28 10-8 cm-2 s-1 and photon index of 2.31 0.11. Its angular separation of 5.5∘ from PG 1553+113 is well in excess of the width of the Fermi PSF over the full energy range.
In the Fermi data analysed here, PG 1553+113 was detected with a statistical significance of approximately 49 (gtlike calculated a test significance666The test significance is defined as -2(), where is the likelihood ratio for the null hypothesis and the assumed source model; see Abdo et al. (2009b) for a full description. of 2407) and an integral flux ( 200 MeV) of 5.00 0.31 10-8 cm-2 s-1. The most energetic photon in the Fermi data is at 157 GeV (at an angular separation of 0.04∘ from the source location, i.e., well within for that energy). The Fermi data are well described by a power-law such that the differential photon flux, , is given by:
| (1) |
where is the differential flux at energy, and is the photon index. For each energy, , the uncertainty contours, called the butterfly, are defined such that the differential flux satisfies:
| (2) |
where cov() is the covariance term, returned by the MINUIT minimization and error analysis function called by the Fermi likelihood analysis tool, gtlike, and , and are the statistical uncertainties on the , and , respectively, at energy, . Equation 2 reaches a minimum at the decorrelation energy, , where:
| (3) |
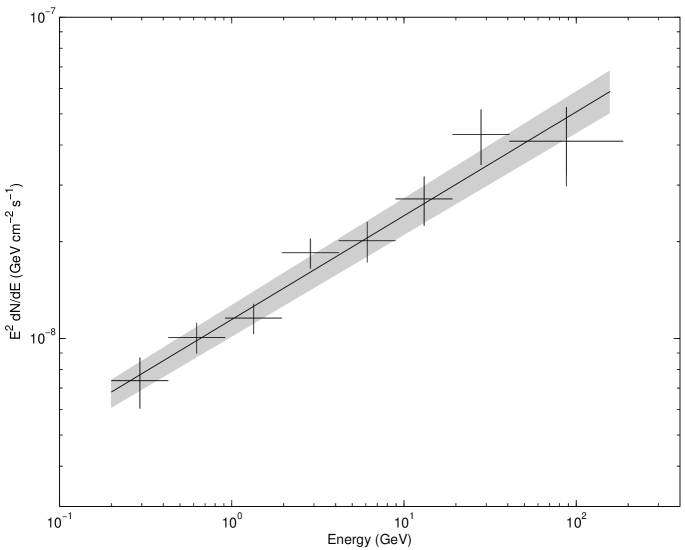
For the PG 1553+113 data analyzed here, we find a differential flux of = 2.60 0.18 cm-2 s-1 GeV-1 with = 2.4 GeV and a photon index of = 1.68 0.03. The differential energy spectrum with the butterfly is shown in Figure 1. Also plotted are the fluxes calculated when the data were analyzed in eight independent energy bins fixing the photon index in each bin to that derived from the entire dataset, since the preferred fit to this was a power-law. These fluxes are listed in Table 2. To estimate the systematic uncertainties on the PG 1553+113 flux and photon index, the PG 1553+113 data were re-analyzed using two new sets of instrument response functions (IRFs; Atwood et al., 2009) that were created by propagating both extremes of the uncertainties on IRF P6_V3_DIFFUSE. From this analysis, we estimate the systematic uncertainties to be at the level of 2% on the photon index ( = 1.68 0.03stat syst) and 3% on the differential flux ( = 2.60 0.18stat syst cm-2 s-1 GeV-1).
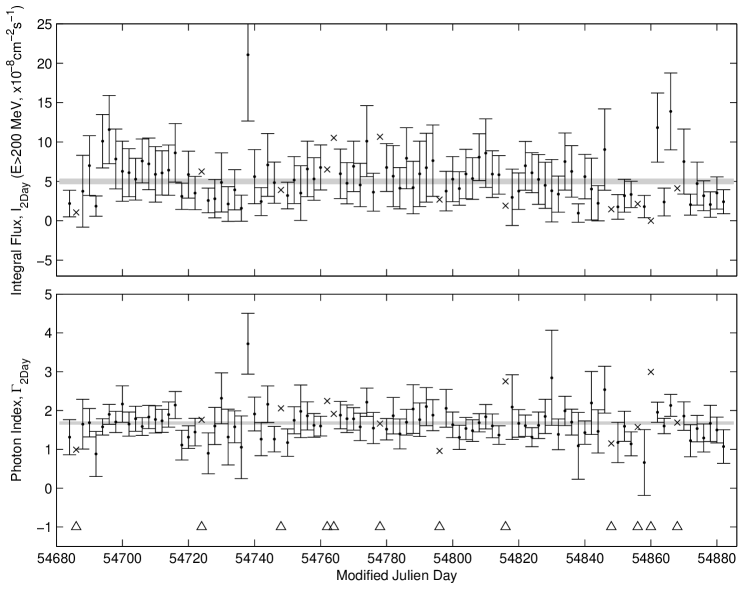
The PG 1553+113 200-day lightcurves for the integral flux, (200 MeV), and the photon index, , with 2-day binning are shown in Figure 2. This timescale was chosen so that a detection with a statistical significance of at least 3 was obtained in most bins. These are the longest continuous lightcurves ever derived for this source. The probability of the data being fit by a constant are 0.54 and 0.99, respectively, for the integral fluxes and the photon indices. The normalised excess variance (Vaughan et al., 2003) is = 2.7 10-2 for the flux lightcurve and = 1.6 10-2 for the photon index lightcurve777It is possible to arrive at a negative value for when there is low intrinsic variance and/or the measurement uncertainties are overestimated.. Both of these calculations suggest that, to within measurement uncertainties, the flux and photon index from PG 1553+113 were constant during these observations. Assuming this to be the case, an upper limit on the intrinsic variability that could be present in the flux lightcurve was derived as follows. An ensemble of lightcurves, each with a different level of intrinsic Gaussian noise added, was simulated. For each level of intrinsic variability, , 1000 lightcurves, each the same length, , as the measured lightcurve were generated. Each flux point in these lightcurves, ()()j (), was drawn from a Gaussian distribution centred on the mean of the measured lightcurve with width of , where ()j is the measurement uncertainty for the th measured flux. For each of these simulated lightcurves, the excess variance was calculated, providing a distribution of 1000 simulated excess variance measurements for each level of added intrinsic variability. For each of these distributions, the value above which 95% of the excess variances lay was found. With these data, upper limits were calculated by constructing a Neyman confidence belt. It was found that, at the 95% confidence level, the upper limit on the normalised intrinsic variance from the PG 1553+113 flux is 7.8 10-2. The same procedure was applied to the photon index lightcurve and an upper limit of 1.4 10-2 at the 95% confidence level was derived for the normalised intrinsic variance on the PG 1553+113 photon index.
3 Using the Gamma-ray Data to Constrain the Redshift of PG 1553+113
For many years PG 1553+113 was thought to lie at a redshift of =0.36 (Miller & Green, 1983). This redshift estimate was based on a spurious emission line in its spectrum, misidentified as Lyman- (Falomo & Treves, 1990). Subsequent observations have failed to reveal any spectral features (Falomo & Treves, 1990; Falomo et al., 1994; Carangelo et al., 2003). Since its detection in the VHE band, a number of dedicated observing campaigns and reanalyses of Hubble Space Telescope (HST) images have been undertaken to determine its redshift but, despite these efforts, the redshift of PG 1553+113 remains unknown, (Sbarufatti et al., 2005; Sbarufatti et al., 2006; Treves et al., 2007; Aharonian et al., 2008). Constraints, some of them contradictory, have been placed on its redshift using a variety of techniques. These fall into two categories — spectral and imaging observations in optical to ultraviolet wavebands and VHE gamma-ray spectral observations.
The host galaxy of PG 1553+113 was neither resolved by Hutchings & Neff (1992) using the High-Resolution camera on the Canada France Hawaii Telescope nor by Scarpa et al. (2000) who observed it as part of a survey of 110 BL Lacs using HST. The host galaxies of 69 out of these were resolved by HST, including almost all objects with . Sbarufatti et al. (2005) analyzed these HST data and showed that the host galaxy luminosity is encompassed in a relatively narrow range for the BL Lacs resolved with HST, thus concluding that BL Lac host galaxies typically have absolute magnitude of . They used this assumption to derive lower limits on the redshifts for those objects lying at unknown distances for which no host galaxy could be resolved, thus arriving at a lower limit of for PG 1553+113, the brightest such object in the survey. Using a similar strategy, Carangelo et al. (2003) set a lower limit of on the redshift of PG 1553+113 using preliminary results from observations with the ESO m telescope. Treves et al. (2007) reanalyzed the HST image of PG 1553+113 and, again making the assumption that its host galaxy is typical of BL Lacs, placed a lower limit of on the redshift. In comparing their results with those from VHE observations, they concluded that its redshift is in the range . Sbarufatti et al. (2006) used the ESO VLT to measure the optical spectra of a number of BL Lacs including PG 1553+113. Combining the fact that no spectral features were resolved with their knowledge of the sensitivity of the VLT to such features, they were able to derive a lower limit of on the redshift PG 1553+113, under the assumption that its host galaxy is typical.
All of the results above, however, rely on the result of Sbarufatti et al. (2005), which states that BL Lac host galaxies have a very small dispersion in their absolute magnitudes. The results of a study by O’Dowd & Urry (2005) casts doubt on the validity of this assumption for objects with because they find evidence for strong evolution in the host galaxies of BL Lacs in the redshift range of .
Gamma-ray data can be used indirectly to estimate redshifts provided that a few necessary assumptions are valid. The VHE spectra of extragalactic sources whose redshifts are known can be used to probe the density of the EBL because the high-energy gamma rays produce e+e- pairs with the EBL photons thus introducing a redshift-dependent absorption feature on the spectra observed in the VHE regime (Costamante et al., 2004; Dwek & Krennrich, 2005; Stecker et al., 2007; Krennrich et al., 2008). Conversely, in cases such as that of PG 1553+113, a firmly established VHE source (Aharonian et al., 2006b; Albert et al., 2007; Aharonian et al., 2008; Albert et al., 2009) lying at an unknown distance, the measured spectrum can be used in combination with assumptions about the density of the EBL and the intrinsic VHE spectrum to put limits on its redshift. By assuming a minimal level of EBL (Primack et al., 2001) and that the intrinsic spectrum of PG 1553+113 is unlikely to have a photon index harder than = 1.5, the limit from shock acceleration models (Aharonian et al., 2006a), Aharonian et al. (2006b) derived an upper limit of on its redshift. We note that none of the Fermi LBAS sources that have significant detections across the entire Fermi bandpass have photon indices harder than 1.5, providing additional support for the validity of this assumption. When these data were reanalysed and combined with subsequent H.E.S.S. data, a refined upper limit of was calculated (Aharonian et al., 2008). A similar procedure was adopted by Albert et al. (2007) resulting in an upper limit of . Mazin & Goebel (2007) combined all of the existing VHE gamma-ray data from PG 1553+113 and, by assuming that a break in the intrinsic spectrum should be visible if the source lies above , as well as a limit on the hardness of the intrinsic spectrum = 1.5, placed an upper limit of on the redshift of PG 1553+113.
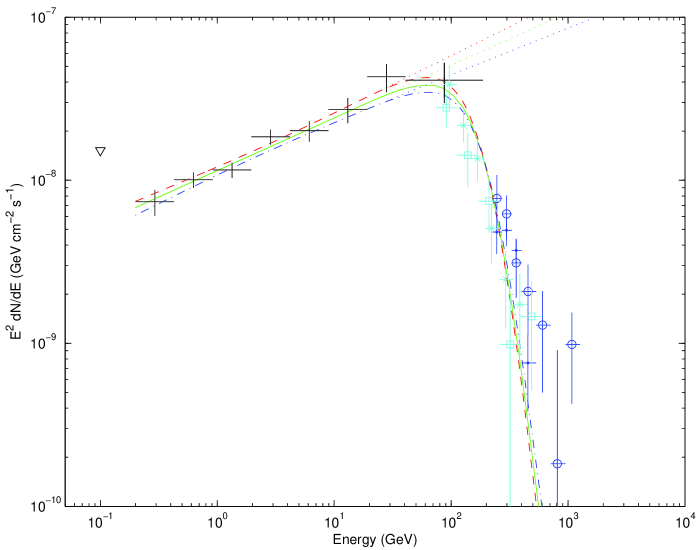
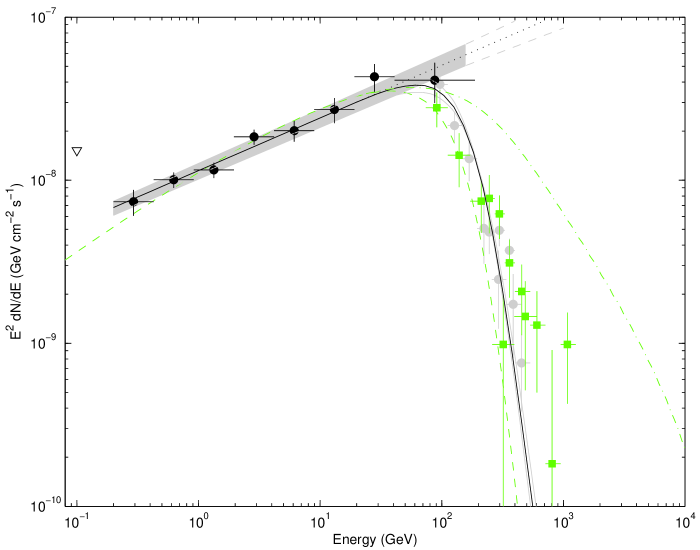
The gamma-ray SED measured by Fermi, H.E.S.S. and MAGIC are plotted together in Figure 3. The VHE data are non-simultaneous with those from Fermi and comprise two H.E.S.S. datasets and two MAGIC datasets (Aharonian et al., 2006b; Aharonian et al., 2008; Albert et al., 2007; Albert et al., 2009). The VHE spectra recorded by H.E.S.S. and by MAGIC were consistent during all observations. Although one of the MAGIC datasets showed evidence for a change in the mean flux level from PG 1553+113 on month timescales, no evidence for strong variability or day-scale (or shorter) VHE flux variability is seen, within the measurement uncertainties, in any of the datasets. As described in Section 2 no flux or spectral variability was detected in the Fermi dataset. We therefore make the assumption here that the source was in a non-flaring state during all of the gamma-ray observations. Furthermore, since the highest energy Fermi datapoints, which overlap with the energy range covered by MAGIC, show a flux level consistent with that measured by MAGIC, we assume that PG 1553+113 was in a similar flux and spectral state at all epochs plotted in Figure 3. We note that in both the optical and X-ray regimes, the spectral properties of PG 1553+113 were not seen to change significantly even when its flux level changed.
The spectrum measured by Fermi is best-fit by a simple power law. We make the assumption that any departures from this power-law spectrum up to 1 TeV are dominated by absorption of gamma rays by the EBL and use the parameterisation of Franceschini et al. (2008), which includes evolutionary effects, to find the level of EBL, and therefore the redshift, which best fits the measured data. By absorbing the extrapolated Fermi spectrum with EBL corresponding to redshifts from , in steps of , we find that a redshift of gives the best fit to the measured VHE data for the EBL model of Franceschini et al. (2008). When the Fermi 68% uncertainty-contours, derived from Equation 3, are subjected to the same fitting procedure as the power-law spectrum we obtain the statistical error on the redshift determination for the Franceschini et al. (2008) EBL giving us a range from , as illustrated in Figure 3. Since the model of Franceschini et al. (2008) provides the lowest level for the EBL over the range of interest here, the redshift derived from it should be considered an upper limit. Due to the fact that we performed this calculation for just one parameterization of the EBL we do not estimate the systematic uncertainty associated with absorbing the Fermi spectrum with different EBL models and we discuss this further in Section 5. We note that the systematic uncertainty on the energy scale, which is on the order of % for the VHE gamma-ray telescopes (Aharonian et al., 2006c; Albert et al., 2008), was not taken into account in these calculations.
| Flux (2-10 keV) | Spectral | ||||
|---|---|---|---|---|---|
| Observation | ( 10-11 erg cm-2 s-1) | Parameters | |||
| Observatory | Date(s) | [Ref.] | [Ref.] | ||
| ASCA | 1995-08-16 | 2.9 [Don01] | 2.47 | — | [Don01] |
| BeppoSAX | 1998-02-05 | 1.4 [Don05] | 2.17 | 0.63 | [Mas08] |
| XMM-Newton | 2001-09-06 | 3.5 [Per05] | 2.09 | — | [Mas08] |
| RXTE | 2003-04-22 - 2003-05-12aaThe mean flux and spectral index during the whole campaign. | 0.7 [Ost06] | 2.37 | — | [Ost06] |
| 2003-04-22 - 2003-05-28bbThe mean flux and spectral index prior to the flare. | 0.5 [Ost06] | 2.60 | — | [Ost06] | |
| 2003-04-26ccThe minimum flux recorded during the campaign and the spectral index at that time. | 0.3 [Ost06] | 3.19 | — | [Ost06] | |
| 2003-05-11ddThe maximum flux recorded during the campaign and the spectral index at that time. | 1.2 [Ost06] | 2.26 | — | [Ost06] | |
| Swift-XRT | 2005-04-20 | 2.1 [Tra07] | 2.21 | 0.36 | [Mas08] |
| 2005-10-06 | 6.9 [Tra07] | 2.14 | 0.24 | [Mas08] | |
| 2005-10-08 | 6.7 [Tra07] | 2.11 | 0.23 | [Mas08] | |
| Suzaku | 2006-07-24 - 2006-07-25 | 3.5 [Rei08] | 2.19 | 0.26eeThe Suzaku spectrum was measured between 0.3-30 keV. | [Rei08] |
| Energy Range | Flux |
|---|---|
| (GeV) | (cm-2 s-1 GeV-1) |
| 0.20 - 0.43 | 8.63 1.56 10-8 |
| 0.43 - 0.92 | 2.57 0.28 10-8 |
| 0.92 - 1.96 | 6.46 0.70 10-9 |
| 1.96 - 4.18 | 2.26 0.24 10-9 |
| 4.18 - 8.94 | 5.38 0.78 10-10 |
| 8.94 - 19.13 | 1.59 0.28 10-10 |
| 19.13 - 40.90 | 5.52 1.08 10-11 |
| 40.90 - 187.05 | 5.37 ††The uncertainty in the highest energy bin is found to be asymmetric. 10-12 |
| Model | RXTE | Swift-XRT | Suzaku | Swift-XRT | No X-rays |
|---|---|---|---|---|---|
| Parameter | (Blue) | (Yellow) | (Green) | (Magenta) | (Black) |
| Apr/May 2003 | Oct 2005 | Jul 2006 | Mar 2009 | — | |
| 1.70 | 1.70 | 1.70 | 1.70 | 1.70 | |
| 3.00 | 3.00 | 2.70 | 3.00 | 3.00 | |
| 4.10 | 4.10 | 3.90 | 4.10 | — | |
| 106 | 3.16 | 3.16 | 3.16 | 3.16 | 0.20 |
| 104 | 6.59 | 6.59 | 6.59 | 5.07 | 5.71 |
| 104 | 7.61 | 22.8 | 7.61 | 6.59 | — |
| 1054 | 4.00 | 3.70 | 3.93 | 4.28 | 4.32 |
4 Discussion
The Fermi data presented here allowed us to derive the longest, continuously sampled lightcurves to date for PG 1553+113. Its flux in this energy regime is such that its variability can be probed on day timescales. The combination of the low duty cycle of VHE instruments and the weak flux from PG 1553+113 at those energies means that the timescales accessible with the LAT for this source are shorter than those accessible at higher energies where longer integration times than those available on nightly timescales have been necessary to achieve a significant detection. No evidence for variability was found in the Fermi integral flux and photon index lightcurves. That there is no evidence for variability from PG 1553+113 is consistent with observations of other BL Lacs with Fermi and the VHE instruments. The recently-released Fermi LBAS (Abdo et al., 2009a) found evidence that BL Lacs are less variable than the other blazar subclass, the flat spectrum radio quasars (FSRQs). Using a simple test, 70% of the LBAS FSRQs were found to be variable compared to 29% of the LBAS BL Lacs. Also, the fact that approximately 70% of the EGRET-detected blazars are not in the LBAS, with comparable flux thresholds, is a further indication that high activity in the gamma-ray range is not frequent for a given source. As the number of BL Lacs detected in the VHE regime increases, it seems that these objects are not all as variable in the VHE regime as initial observations of Markarian 421 and Markarian 501 suggested (e.g., Buckley et al., 1996, Gaidos et al., 1996, Aharonian et al., 1997, Quinn et al., 1999). Of the 21 BL Lacs now confirmed to be VHE gamma-ray emitters888http://tevcat.uchicago.edu; The “Default Catalog”, which contains only those sources that have been confirmed as VHE emitters, was used (see TeVCat website for more details). (Wakely & Horan, 2008), 10 (48%) have, to date, shown no evidence for strong variability, 4 (19%) have shown marginal evidence for variability (i.e., different flux levels on yearly timescales), and 7 (33%) show strong evidence for variability. It should be noted however, that selection effects can play a role here: the low duty cycles and small fields of views of VHE instruments limits their ability to perform routine monitoring of a large sample of sources and, in many cases, BL Lac observations are triggered by high flux states. Fermi, on the other hand, with its large field of view and high duty cycle, can sample the lightcurves of sources in a more even fashion, in particular over day-scale timebins. It is, however, less sensitive than VHE instruments to shorter-term variability of sources with spectral and flux characteristics typical of BL Lacs detected to date. Threshold effects, also, can play a role in the detection of variability from a source. When the falling edge of the source’s SED intersects with the low energy range of the instrument sensitivity (this is the case for the FSRQs with Fermi and the BL Lacs with the VHE instruments), a slight spectral shift from the source can mimic the effects of a large level of variability.
4.1 Modeling the Intrinsic Emission of PG 1553+113
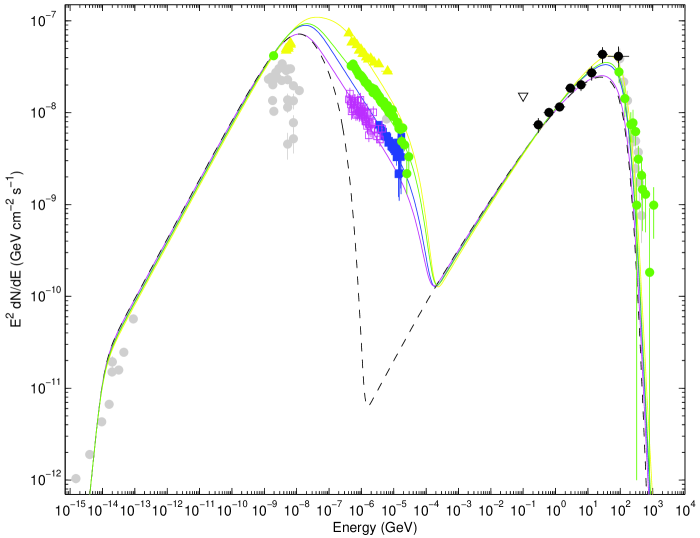
In accordance with the weak observed variability, all of the available PG 1553+113 gamma-ray data were combined in turn with each of the X-ray datasets and, assuming a redshift of =0.75 as found above, each dataset was modeled with a single-zone synchrotron self-Compton (SSC) model, that is, a scenario in which one population of electrons is responsible for the broadband emission, producing synchrotron radiation in the radio to X-ray regime and upscattering these synchrotron photons to produce the gamma-ray emission (Band & Grindlay, 1985; the model employed here is similar to the one used in Aharonian et al. (2009)). Figure 4 shows the result of this fitting. The electrons are parameterized as a three-component power-law, (), with minimal and maximal Lorentz factors and , break Lorentz factors of and and total electron number of . For each of the X-ray datasets, the SED was modeled by finding the parameters of the electron distribution that provided a good fit to the shape of the low-energy component (radio to X-ray), while keeping the same values for the emitting region radius, , the magnetic field strength, , and the bulk Doppler factor, throughout. This fitting procedure resulted in values of cm, Gauss and . Table 3 lists the best fit values of the electron parameters for each of the X-ray datasets. A zoom of the high-energy component of the SED for the Fermi data with the dataset that is most simultaneous (that corresponding to the KVA, Suzaku and VHE data from July 2006), without the effects of EBL absorption, is shown in Figure 5. It can be seen that, even with the presence of the intrinsic curvature that is inherent to the SSC model, most of the curvature in the high-energy portion of the spectrum can be accounted for by EBL absorption.
We found that this simple, one-zone SSC model provided a reasonably good fit to the PG 1553+113 SED. By altering only the distribution of the electrons that produce the synchrotron emission, a good fit to the overall SED was found for each of the X-ray flux states and, for all of these model realisations the VHE component of the SED did not change significantly: the magnitude of the changes in the SED above 200 GeV are on the order of the VHE statistical measurement uncertainties. This consistency of spectral shape implies that the gamma-ray flux could remain consistent with the state seen by H.E.S.S. and MAGIC during the observations of 2005-2006, even in the presence of the large changes in the X-ray flux level that have been detected. Such behaviour was also observed with simultaneous datasets from PKS 2155-304 by Aharonian et al. (2009). In a quiescent state during these observations, no correlation was found between its X-ray and VHE gamma-ray fluxes. During previous observations however, when it was in a flaring state in the gamma-ray regime, there was strong correlation between the X-ray and VHE fluxes (Costamante, 2008). This behaviour is an indication that the hard X-ray flux of BL Lacs can change significantly without resulting in detectable activity in the gamma-ray regime, except for at the peak of the SED at these energies, i.e., that X-ray variability can be accompanied by VHE gamma-ray quiescence and a measurable shift in the spectrum at the peak of the Fermi energy regime. In such a scenario, the electrons producing the variable X-ray emission are at higher energies than those upscattering the bulk of the synchrotron photons to the VHE gamma-ray regime; the scatterings of the variable hardest X-rays are suppressed mostly due to Klein-Nishina effects but also because of the decreasing target photon density at these energies. This effect is demonstrated for the extreme case in Figure 4 where the black dashed curve shows the broadband spectrum when the high-energy electron component is omitted. It can be seen that the difference between it and the curves in which the highest energy electrons are included is still on the order of the statistical measurement uncertainties in the VHE regime.
In the framework of this model, the X-ray and VHE gamma-ray fluxes would be correlated during gamma-ray flaring states while during the more common gamma-ray quiescent states changes in the X-ray flux would not lead to detectable changes in the gamma-ray flux, except for at the high-energy peak in the SED. The simple, one-zone SSC model employed here allows for such a scenario — accounting for the X-ray flux variations observed historically while not requiring detectable changes in the VHE gamma-ray flux state. It provides a good fit to the VHE gamma-ray data with each of the low-energy datasets, only one of which, drawn in green in Figure 4, is quasi-simultaneous (the KVA, Suzaku and all but 7 hours of the VHE data are from July 2006). It remains to be seen whether such behaviour is observed in general from BL Lacs, an investigation that can be undertaken jointly by Fermi and the X-ray and VHE observatories. Correlations between the arrival of 100 GeV photons in the Fermi data and increasing of the hard X-ray flux, in the absence of VHE variability, would be indicative of the proposed scenario. Such effects would be difficult to pin down however, due to the low rate of detection of of 100 GeV photons with Fermi.
Vercellone et al. (2004) studied the duty-cycle of gamma-ray blazars by comparing the sources detected by EGRET with a sample of radio-selected candidate gamma-ray blazars. They found that most blazars have a duty cycle of less than 10%, meaning that they spend more than 90% of their time in a non-flaring gamma-ray state. The gamma-ray data presented here suggest that PG 1553+113 was in such a state in the Fermi energy range during all of these observations. Given the increase in sensitivity and duty cycle afforded us by Fermi, we should expect to detect many more blazars in their quiescent states in the 200 MeV energy range.
5 Conclusion
We have combined the Fermi data from PG 1553+113 with data from radio through VHE gamma rays to study its broadband emission. We demonstrated that a simple, one-zone SSC model provides a reasonably good fit to the observational results: It accounts for the different X-ray flux states observed while also allowing the gamma-ray data to remain approximately constant. More detailed theoretical modeling of the SED, which naturally might fit the data points better, is beyond the scope of this paper.
We have used gamma-ray data spanning four orders of magnitude to seek the EBL column density (as parameterized by Franceschini et al. (2008)) that best fits the measured spectrum of PG 1553+113. We find that an EBL integrated to a redshift of provides the best fit. Such a high value for the redshift would make PG 1553+113 the most distant source to be detected in the VHE regime, an attribute consistent with it being the VHE source with the largest spectral break in the gamma-ray regime ( - 2.7). Three assumptions were made in our redshift calculation the first one being that the EBL behaves in a manner consistent with the model of Franceschini et al. (2008). Of the many EBL models available in the literature (see Finke & Razzaque (2009) for a recent comparison), that of Franceschini et al. (2008) predicts the lowest level of EBL across the energy range of interest here; it provides the minimum level of EBL photons that could exist based on known sources alone and therefore, in using it, the redshift derived for PG 1553+113 can be considered an upper limit. Had one of the other EBL models been used, the best-fit redshift would have been lower. Indeed, a more in-depth study of the absorption effects of the EBL on the spectrum of PG 1553+133 should consider all of the EBL models available in the literature. In this way, the systematic effects of using different realisations of the EBL could be determined; the data points provided in Table 2 allow for such a study to be undertaken.
Two additional assumptions were made in our redshift calculation, firstly, that the emission state of PG 1553+113 did not change significantly during the gamma-ray observations, which can be interpreted as an indication that it was in a low-flux state state at these energies throughout those observations. Indeed, the quiescent state is the state in which we are most likely to find a blazar (Vercellone et al., 2004). Secondly, it was assumed that the power-law spectrum measured by Fermi does not suffer from significant intrinsic absorption up to 1 TeV. Should there be intrinsic absorption of VHE gamma rays at the source, a lower level of EBL absorption would be required to best fit the measured VHE spectrum. We note that, since the Fermi data show no evidence for spectral curvature, if it is significant intrinsic absorption that is mostly responsible for the sharp break in the gamma-ray spectrum, its effects would have to kick in at energies exactly above those accessible to Fermi and, at a significant level, in order to produce the sharp break observed in the data.
This is the first time that the measurement of the complete HE to VHE gamma-ray spectrum of a source has been used to constrain its redshift. The value derived here is close to the limits derived by Aharonian et al. (2008) and Albert et al. (2007) and is higher than that derived by Mazin & Goebel (2007). Different parameterizations of the EBL were used in these analyses (those of Kneiske et al. (2004) and Primack et al. (2001)) so this is one of the factors contributing to the different results. Additionally, for these previous redshift constraints using gamma-ray data, it was necessary to make assumptions about the hardness of the intrinsic spectrum in the HE regime. The Fermi measurement of the HE spectrum from PG 1553+113 allows us to reduce the number of assumptions used in the constraining the redshift. Combining the Fermi measurement with the measured VHE spectra affords us complete coverage of the PG 1553+113 SED from 200 MeV to 1.1 TeV.
Its potentially large distance together with its consistently detectable gamma-ray flux make PG 1553+113 an excellent candidate with which to search for EBL cascading effects first proposed by Protheroe (1986) and, subsequently explored by many authors (e.g., Protheroe & Stanev, 1993; Aharonian et al., 1994; Biller, 1995; D’Avezac et al., 2007; Elyiv et al., 2009). If present, pile-up from such cascades is predicted to occur below 100 GeV. Some authors predict that cascades produce a characteristic spectral bump, which could be detectable in the Fermi energy regime if the strength of the extragalactic magnetic field in the direction of the source being studied is less than = 10-6 nG (D’Avezac et al., 2007). Elyiv et al. (2009) predict that, for magnetic field strengths of 10-7 nG, extended emission due to the cascading of the source photons should be detectable around extragalactic gamma-ray sources by Fermi.
The possibility that PG 1553+113 could be a particularly distant TeV source provides further impetus for IR/optical/UV astronomers to revisit the redshift measurement. A direct measurement would be very welcome, and would ultimately settle the question of the accuracy of estimates based on the EBL. The Fermi LAT is continuing to accumulate data on PG 1553+113. Subsequent studies of these data will, therefore, allow us to measure its spectral shape with greater sensitivity at the highest energies accessible to Fermi.
6 Acknowledgments
The Fermi LAT Collaboration acknowledges the generous support of a number of agencies and institutes that have supported the Fermi LAT Collaboration. These include the National Aeronautics and Space Administration and the Department of Energy in the United States, the Commissariat à l’Energie Atomique and the Centre National de la Recherche Scientifique / Institut National de Physique Nucléaire et de Physique des Particules in France, the Agenzia Spaziale Italiana and the Istituto Nazionale di Fisica Nucleare in Italy, the Ministry of Education, Culture, Sports, Science and Technology (MEXT), High Energy Accelerator Research Organization (KEK) and Japan Aerospace Exploration Agency (JAXA) in Japan, and the K. A. Wallenberg Foundation, the Swedish Research Council and the Swedish National Space Board in Sweden.
Additional support for science analysis during the operations phase from the following agencies is also gratefully acknowledged: the Istituto Nazionale di Astrofisica in Italy and the K. A. Wallenberg Foundation in Sweden.
This research has made use of the NASA/IPAC Extragalactic Database (NED) which is operated by the Jet Propulsion Laboratory, California Institute of Technology, under contract with the National Aeronautics and Space Administration. This research has made use of the SIMBAD database, operated at CDS, Strasbourg, France.
Thanks to Wystan Benbow, Luigi Costamante, Daniela Dorner, Andrea Tramacere and Robert Wagner for supplying archival data-points.
Facilities: Fermi LAT
References
- Abazajian et al. (2009) Abazajian, K. N., et al. 2009, ApJS, 182, 543
- Abdo et al. (2009a) Abdo, A. A., et al. 2009a, ApJ, 700, 597
- Abdo et al. (2009b) —. 2009b, ApJS, 183, 46
- Aharonian et al. (1997) Aharonian, F., et al. 1997, A&A, 327, L5
- Aharonian et al. (2006a) —. 2006a, Nature, 440, 1018
- Aharonian et al. (2006b) —. 2006b, A&A, 448, L19
- Aharonian et al. (2006c) —. 2006c, A&A, 457, 899
- Aharonian et al. (2008) —. 2008, A&A, 477, 481
- Aharonian et al. (2009) —. 2009, ApJ, 696, L150
- Aharonian et al. (1994) Aharonian, F. A., Coppi, P. S., & Voelk, H. J. 1994, ApJ, 423, L5
- Albert et al. (2007) Albert, J., et al. 2007, ApJ, 654, L119
- Albert et al. (2008) —. 2008, ApJ, 674, 1037
- Albert et al. (2009) —. 2009, A&A, 493, 467
- Atwood et al. (2009) Atwood, W. B., et al. 2009, ApJ, 697, 1071
- Band & Grindlay (1985) Band, D. L., & Grindlay, J. E. 1985, ApJ, 298, 128
- Becker et al. (1991) Becker, R. H., White, R. L., & Edwards, A. L. 1991, ApJS, 75, 1
- Beckmann et al. (2002) Beckmann, V., Wolter, A., Celotti, A., Costamante, L., Ghisellini, G., Maccacaro, T., & Tagliaferri, G. 2002, A&A, 383, 410
- Bennett et al. (1986) Bennett, C. L., Lawrence, C. R., Burke, B. F., Hewitt, J. N., & Mahoney, J. 1986, ApJS, 61, 1
- Biller (1995) Biller, S. D. 1995, Astroparticle Physics, 3, 385
- Buckley et al. (1996) Buckley, J. H., et al. 1996, ApJ, 472, L9+
- Carangelo et al. (2003) Carangelo, N., Falomo, R., Kotilainen, J., Treves, A., & Ulrich, M.-H. 2003, in Astronomical Society of the Pacific Conference Series, Vol. 299, High Energy Blazar Astronomy, ed. L. O. Takalo & E. Valtaoja, 299–+
- Costamante (2008) Costamante, L. 2008, International Journal of Modern Physics D, 17, 1449
- Costamante et al. (2004) Costamante, L., Aharonian, F., Horns, D., & Ghisellini, G. 2004, New Astronomy Review, 48, 469
- D’Avezac et al. (2007) D’Avezac, P., Dubus, G., & Giebels, B. 2007, A&A, 469, 857
- Donato et al. (2001) Donato, D., Ghisellini, G., Tagliaferri, G., & Fossati, G. 2001, A&A, 375, 739
- Donato et al. (2005) Donato, D., Sambruna, R. M., & Gliozzi, M. 2005, A&A, 433, 1163
- Douglas et al. (1996) Douglas, J. N., Bash, F. N., Bozyan, F. A., Torrence, G. W., & Wolfe, C. 1996, AJ, 111, 1945
- Dwek & Krennrich (2005) Dwek, E., & Krennrich, F. 2005, ApJ, 618, 657
- Elyiv et al. (2009) Elyiv, A., Neronov, A., & Semikoz, D. 2009, ArXiv e-prints
- Falomo et al. (1994) Falomo, R., Scarpa, R., & Bersanelli, M. 1994, ApJS, 93, 125
- Falomo & Treves (1990) Falomo, R., & Treves, A. 1990, PASP, 102, 1120
- Finke & Razzaque (2009) Finke, J. D., & Razzaque, S. 2009, ApJ, 698, 1761
- Fox et al. (2006) Fox, A. J., Savage, B. D., & Wakker, B. P. 2006, ApJS, 165, 229
- Franceschini et al. (2008) Franceschini, A., Rodighiero, G., & Vaccari, M. 2008, A&A, 487, 837
- Gaidos et al. (1996) Gaidos, J. A., et al. 1996, Nature, 383, 319
- Gorshkov et al. (2003) Gorshkov, A. G., Konnikova, V. K., & Mingaliev, M. G. 2003, Astronomy Reports, 47, 903
- Green et al. (1986) Green, R. F., Schmidt, M., & Liebert, J. 1986, ApJS, 61, 305
- Gregory & Condon (1991) Gregory, P. C., & Condon, J. J. 1991, ApJS, 75, 1011
- Hartman et al. (1999) Hartman, R. C., et al. 1999, ApJS, 123, 79
- Hutchings & Neff (1992) Hutchings, J. B., & Neff, S. G. 1992, AJ, 104, 1
- Kneiske et al. (2004) Kneiske, T. M., Bretz, T., Mannheim, K., & Hartmann, D. H. 2004, A&A, 413, 807
- Krennrich et al. (2008) Krennrich, F., Dwek, E., & Imran, A. 2008, ApJ, 689, L93
- Massaro et al. (2008) Massaro, F., Tramacere, A., Cavaliere, A., Perri, M., & Giommi, P. 2008, A&A, 478, 395
- Mazin & Goebel (2007) Mazin, D., & Goebel, F. 2007, ApJ, 655, L13
- Miller & Green (1983) Miller, H. R., & Green, R. F. 1983, in Bulletin of the American Astronomical Society, Vol. 15, Bulletin of the American Astronomical Society, 957–+
- O’Dowd & Urry (2005) O’Dowd, M., & Urry, C. M. 2005, ApJ, 627, 97
- Osterman et al. (2006) Osterman, M. A., et al. 2006, AJ, 132, 873
- Perlman et al. (2005) Perlman, E. S., et al. 2005, ApJ, 625, 727
- Primack et al. (2001) Primack, J. R., Somerville, R. S., Bullock, J. S., & Devriendt, J. E. G. 2001, in American Institute of Physics Conference Series, Vol. 558, American Institute of Physics Conference Series, ed. F. A. Aharonian & H. J. Völk, 463–478
- Protheroe (1986) Protheroe, R. J. 1986, MNRAS, 221, 769
- Protheroe & Stanev (1993) Protheroe, R. J., & Stanev, T. 1993, MNRAS, 264, 191
- Quinn et al. (1999) Quinn, J., et al. 1999, ApJ, 518, 693
- Rector et al. (2003) Rector, T. A., Gabuzda, D. C., & Stocke, J. T. 2003, AJ, 125, 1060
- Reimer et al. (2008) Reimer, A., Costamante, L., Madejski, G., Reimer, O., & Dorner, D. 2008, ApJ, 682, 775
- Sbarufatti et al. (2005) Sbarufatti, B., Treves, A., & Falomo, R. 2005, ApJ, 635, 173
- Sbarufatti et al. (2006) Sbarufatti, B., Treves, A., Falomo, R., Heidt, J., Kotilainen, J., & Scarpa, R. 2006, AJ, 132, 1
- Scarpa et al. (2000) Scarpa, R., Urry, C. M., Falomo, R., Pesce, J. E., & Treves, A. 2000, ApJ, 532, 740
- Stecker et al. (2007) Stecker, F. W., Baring, M. G., & Summerlin, E. J. 2007, ApJ, 667, L29
- Strong et al. (2004a) Strong, A. W., Moskalenko, I. V., & Reimer, O. 2004a, ApJ, 613, 962
- Strong et al. (2004b) Strong, A. W., Moskalenko, I. V., Reimer, O., Digel, S., & Diehl, R. 2004b, A&A, 422, L47
- Tramacere et al. (2007) Tramacere, A., et al. 2007, A&A, 467, 501
- Treves et al. (2007) Treves, A., Falomo, R., & Uslenghi, M. 2007, A&A, 473, L17
- Urry et al. (2000) Urry, C. M., Scarpa, R., O’Dowd, M., Falomo, R., Pesce, J. E., & Treves, A. 2000, ApJ, 532, 816
- Vaughan et al. (2003) Vaughan, S., Edelson, R., Warwick, R. S., & Uttley, P. 2003, MNRAS, 345, 1271
- Vercellone et al. (2004) Vercellone, S., Soldi, S., Chen, A. W., & Tavani, M. 2004, MNRAS, 353, 890
- Wakely & Horan (2008) Wakely, S. P., & Horan, D. 2008, in International Cosmic Ray Conference, Vol. 3, International Cosmic Ray Conference, 1341–1344