183186 \Yearpublication2010 \Yearsubmission2009 \Month \Volume331 \Issue2 \DOI10.1002/asna.200911323
2010 Feb 15
Beginning of the Super-Soft Phase of the Classical Nova V2491 Cygni
Abstract
We present the results of soft X-ray studies of the classical nova V2491 Cygni using the Suzaku observatory. On day 29 after outburst, a soft X-ray component with a peak at 0.5 keV has appeared, which is tantalising evidence for the beginning of the super-soft X-ray emission phase. We show that an absorbed blackbody model can describe the observed spectra, yielding a temperature of 57 eV, neutral hydrogen column density of 21021 cm-2, and a bolometric luminosity of 1036 erg s-1. However, at the same time, we also found a good fit with an absorbed thin-thermal plasma model, yielding a temperature of 0.1 keV, neutral hydrogen column density of 41021 cm-2, and a volume emission measure of 1058 cm-3. Owing to low spectral resolution and low signal-to-noise ratio below 0.6 keV, the statistical parameter uncertainties are large, but the ambiguity of the two very different models demonstrates that the systematic errors are the main point of concern. The thin-thermal plasma model implies that the soft emission originates from optically thin ejecta, while the blackbody model suggests that we are seeing optically thick emission from the white dwarf.
keywords:
stars: individual (Nova Cygni 2008 number 2, V2491 Cygni) — stars: novae, cataclysmic variables1 Introduction
Classical novae are a class of cataclysmic variables, which occur in accreting binaries with a white dwarf and a late-type companion. Hydrogen-rich material is accumulated on the white dwarf surface. The surface temperature increases as the material accumulates. When the accreted material reaches a critical mass for nuclear fusion, an thermonuclear runaway process ignites on the white dwarf surface. A review of the evolution of classical novae can be found in e.g., Starrfield et al. (2008).
After outburst, the system is expected to display X-ray emission via different mechanisms: (1) Non-thermal emission has recently been reported from the classical nova V24 91 Cygni by the Suzaku satellite (Takei et al. 2009a). (2) Thin-thermal plasma emission from adiabatic shocks has been reported in some classical novae, mainly in data taken with the Swift satellite (e.g., Bode et al. 2006; Ness et al. 2009a). (3) Photospheric emission from a hot layer of a white dwarf surface, which is characterised by bright, soft blackbody-like continuum emission and absorption lines, similar to the class of Super-Soft X-ray Sources (SSS; Kahabka & van den Heuvel 1997).
Following from various arguments, the time scale of SS-S emission is a function of the white dwarf mass and the chemical composition of the post-outburst envelope (e.g., Sala & Hernanz 2005; Hachisu & Kato 2006). The optically thick wind theory is an approach to model SSS light curves with some simple assumptions (e.g., Hachisu & Kato 2005, 2006). In this theory, the onset of the SSS phase is assumed to occur after the wind stops, and the SSS phase fades out once the nuclear fuel on the white dwarf surface is consumed. Meanwhile, recent observations have shown that significant wind velocities can still be detected during the SSS phase (see contribution by Ness in this same journal). It is difficult to estimate the effects of the expansion on model light curves, and, ultimately, the white dwarf mass that would be derived from models that account for the continued expansion during the SSS phase. More advanced models are clearly needed, nevertheless, the duration of the SSS phase is an important observational quantity that will always be needed to determine the white dwarf mass.
In order to determine the duration of the SSS phase, we have to estimate the turn-on and turn-off time of SSS emission. For both quantities, dense observations in time are needed, and intensive monitoring campaigns are currently being performed with Swift (see, e.g., the contributions by Beardmore and by Osborne in this same journal). However, the turn-on time is particularly difficult to be estimated because we need to discriminate SSS emission from other sources of X-ray emission. For example, in RS Oph, significant shock emission was present during the early ti-mes and faded on a time scale of 30 days. When the SSS phase started around day 30 after outburst, some shock em-ission was still present that may contaminate the SSS emission (e.g., Ness et al. 2009b).
Rohrbach et al. (2009) analysed three Chandra ACIS spectra of V1494 Aql obtained on days 134, 187, and 248 after outburst, and interpreted a soft excess in the last observation as SSS emission. However, in the two earlier ACIS spectra, emission lines from N were present at the same energies. They emphasised that the soft component in all three ACIS spectra could equally well be fitted by a blackbody or a thin-thermal plasma model with high N or O abundance. The conclusion of SSS emission in a CCD-type spectrum has thus to be treated with care, because the energy resolution is not high enough to compare these models. Rohrbach et al. (2009) had additional high-resolution Chandra LETGS spectra at their disposal that clearly showed that the soft component was atmospheric rather than thin-thermal emission. For these purposes, it is thus mandatory to observe with high energy resolution with sufficient sensitivity at soft X-ray energies so that different models can be distinguished.
In this paper, we present the results of soft X-ray studies of the classical nova V2491 Cygni using the Suzaku observatory. Suzaku has taken two observations during the early phase, and the X-ray CCDs aboard Suzaku provided X-ray spectra of this nova (Takei et al. 2009a, b). A tantalising hint of SSS emission was seen on day 29, although it provides several different interpretations at the same time. We discuss different possibilities of interpreting the soft component.
2 V2491 Cygni
The classical nova V2491 Cygni was discovered on 2008 April 10.728 UT in the constellation Cygnus (Nakano et al. 2008). The nova was classified as an extremely fast nova (Tomov et al. 2008a) from a rate of decline of 4.6 d (Tomov et al. 2008b), where is the time to fade by 2 mag from the optical maximum magnitude. Based on an empirical relation between the maximum magnitude and the rate of decline among classical novae (della Valle & Livio 1995), the distance was estimated as 10.5 kpc (Helton et al. 2008). As a consequence of the fast evolution, the white dwarf mass can be expected to be high (Hachisu & Kato 2009).
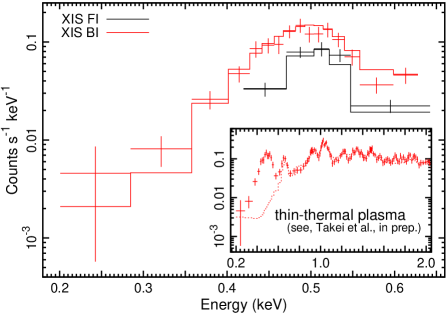
Intensive monitoring observations were conducted by the Swift X-ray satellite after outburst (Kuulkers et al. 2008; Osborne et al. 2008; Page et al. 2008, 2009). No significant X-ray emission was found on day 1, but it was detected on day 5. During the early phase, the Swift spectrum exhibited extremely hard continuum emission (Kuulkers et al. 2008). A Suzaku observation was also conducted on day 9, in which the soft X-rays below 1 keV were highly absorbed (Takei et al. 2009a). We requested another Suzaku observation to follow the evolution, and various emission lines as well as a hint of SSS emission were found on day 29 (Takei et al. 2009b). A harder spectral component is well fitted with a thin-thermal plasma model, however, the spectra show clear signs of attenuation in the 0.6–0.8 keV range, and the soft component cannot be fitted with the same model as the hard part of the spectrum (see, in the bottom right panel in figure 1). The full spectral analysis of the Suzaku data is presented by Takei et al. (2009b). The X-ray brightness increased after the Suzaku observations, and Swift re-corded a soft and bright X-ray spectrum on day 36 (Osborne et al. 2008). XMM-Newton observations were also conducted on days 40 and 50, after the nova had entered the typical SSS phase (Ness et al. 2008a, b).
3 Observations and reduction
V2491 Cygni was observed with Suzaku on day 29. Suzaku provides simultaneous observations with two instruments in operation (Mitsuda et al. 2007): the X-ray Imaging Spectrometer (XIS: Koyama et al. 2007) and the Hard X-ray Detector (HXD: Takahashi et al. 2007; Kokubun et al. 2007), which cover the energy range of 0.2–12 keV and 10–600 keV, respectively. In order to understand the soft X-ray evolution, we concentrate on the XIS spectrum. XIS is equipped with four X-ray CCDs at the foci of four X-ray telescope modules (Serlemitsos et al. 2007). Three of them (XIS0, 2, and 3) are front-illuminated (FI) CCDs, sensitive in a 0.4–12 keV energy range, and the remaining one (XIS1) is a back-illuminated (BI) CCD, sensitive at 0.2–12 keV. XIS2 has not been functional since 2006 November, and we use the remaining CCDs. XIS was operated in normal clocking mode with a frame time of 8 s, and the net exposure time is 25 ks. For details of the extraction procedure, we refer to Takei et al. (2009b). In order to understand the soft X-ray component, we fitted the respective FI and BI spectra between 0.4–0.6 keV and 0.2–0.6 keV by two different models.
4 Spectral Analysis
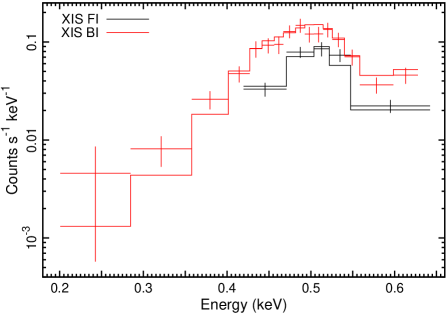
The spectrum shows a clear detection of a soft X-ray excess below 0.6 keV (figure 1). SSS emission is the most straight forward interpretation, however, emission lines from C, N, and O from thin-thermal plasma may also explain the spectrum in this energy band. This is a similar case as Rohrbach et al. (2009). A large source of uncertainty, especially in the soft band, is the large effect of interstellar plus possibly circumstellar absorption. In the following sections we present two model approaches to the soft spectra. The fitting was performed with Xspec, where we used the same interstellar absorption model (TBabs module in Xspec; Wilms et al. 2000). Owing to the low signal-to-noise ratio, we use Cash statistics for the determination of a best-fit model (Cash 1979).
4.1 Blackbody
First, we fitted the spectrum with an absorbed blackbody model. With this model we test the possibility that the emission originates from the photosphere of the hot, extended white dwarf. The best fit yields a blackbody temperature of 576 eV and an interstellar extinction of 211021 cm-2 with uncertainties of the 90% confidence range. The normalisation corresponds to a bolometric luminosity of (0.5–3)1036 erg s-1 assuming a distance of 10.5 kpc by Helton et al. (2008). The bolometric luminosity and the blackbody temperature yield a radius of the sphere to be (470–1900) km for the 90% confidence level. The best-fit model is shown in comparison to the FI and BI spectra in figure 1. The Cash goodness criterion is 17.18 with 21 bins.
4.2 Thin-thermal plasma
Next, we fitted the spectrum with a thin-thermal plasma model (VAPEC module in Xspec; Smith et al. 2001). This model represents optically thin plasma in collisional equilibrium with variable abundances. We allowed the parameters temperature, interstellar extinction, normalisation, and elemental abundances of C, N, and O to vary as free parameters while fitting the spectrum. The other abundances were fixed at solar abundances. The best-fit result is a temperature of 0.1 keV, an interstellar extinction of 41021 cm-2, and abundances for C, N, and O of 90, 10, and 6 times solar, respectively. The normalisation corresponds to a volume emission measure of 1058 cm-3, assuming the distance of 10.5 kpc by Helton et al. (2008). The best-fit model is shown in comparison to the FI and BI spectra in figure 2. The Cash goodness criterion is 17.30 with 21 bins.
5 Discussion
The objective of this study is to understand the origin of the soft-band excess emission peaking at 0.5 keV in a Suzaku observation taken 29 days after outburst. We have used two different model approaches in 4.1 and 4.2. Figures 1 and 2 show that both models are good representations of the data. While the Cash values of 17.18 and 17.30 are not a quantitative quality criterion, their difference scales like the difference of (Wilks theorem; Wilks 1938). If two fits with Cash values that differ by more than 1 (in the case of one free parameter), then the fit with the lower value is better with a probability of 68.3%. In our case with more than one free parameter and a difference much less than 1, the two fits are clearly not different in their ability to reproduce the data. The data alone are thus not sufficient to distinguish between these two models, and both models have to be discussed.
The blackbody temperature is within the typical range of SSS spectra of classical novae, but the bolometric luminosity appears rather low compared to the luminosities that have been derived for other novae (e.g., Krautter et al. 1996). Meanwhile, the luminosity is comparable to that derived from blackbody fits to the persistent SSS CAL 83, but the blackbody temperature is significantly higher (e.g., Greiner et al. 1991). This is the reason why the derived effective radius is relatively small. While the 90% confidence range allows a physically realistic radius of 1900 km, it has to be noted that blackbody fits to SSS spectra have the tendency to overestimate the bolometric luminosity and thus the radius (Krautter et al. 1996). With the small radius that we found from the blackbody fit, the interpretation of the soft emission as originating from the extended atmosphere around the white dwarf, thus implies a very small photospheric radius. However, it can not be smaller than the radius of a white dwarf near the Chandrasekhar limit (e.g., Hamada & Salpeter 1961). In contrast, the emission measure of the thin-thermal plasma model is also within the typical range (e.g., Hernanz & Sala 2007; Tsujimoto et al. 2009). Assuming that the plasma density is uniform and that the expansion velocity has not changed, the observed value corresponds to a plasma density of 106 cm-3, which is also a possible limit of novae.
An obstacle on our way to interpret the soft component as first evidence of SSS emission, and thus the onset of the SSS phase, is the fact that a completely different model can also explain the observations. The thin-thermal plasma model presented in 4.2 yields an adequate fit to the data and must thus be considered for finding the origin of the emission. A possible source for optically thin emission are kinematic interactions of the ejecta with the surrounding medium (e.g., a planetary nebula like in GK Per or the interstellar medium) or within the ejecta. In other novae, such origins have been concluded from observations of so-called ’early hard’ emission, where the observed spectra could be fitted with APEC or MEKAL (Mewe et al. 1985) models. The classical nova V2491 Cygni has been observed with extremely high velocities (e.g., 3300 km s-1; Ness et al. 2008a) and such high velocities can very well dissipate significant amounts of energy in thin-thermal radiation. The spectral analysis of the full Suzaku data are presented by Takei et al. (2009b), and a harder spectral component that can only be fitted with a thin-thermal model has been detected for days 9, 29, 40, and 50. Between days 9 and 29, this component has experienced a significant reduction in temperature. It can thus not be excluded that the soft component on day 29 has at least partly the same origin. While the soft component and the harder thin-thermal component can not be fitted with the same model, it has to be kept in mind that we used an isothermal model while the true plasma is likely not isothermal. With better spectral resolution, the approach of fitting an emission measure distribution as introduced by Ness et al. (2009b) is more appropriate, and a significant amounts of cooler plasma may be present that can account for the soft component.
6 Summary and Conclusions
The fast nova V2491 Cygni has been observed on days 9 and 29 after outburst with Suzaku. The first observation showed a non-thermal component and an optically thin thermal plasma component with a temperature of 2.9 keV (Takei et al. 2009a). Later, on day 29, the non-thermal component has disappeared, and the thin-thermal component has a softer spectrum, yielding a lower temperature (Takei et al. 2009b). In addition, a super-soft component with a peak at 0.5 keV was present. The origin of this component can either be first light of the SSS phase, or it could be the soft extension of the thin-thermal plasma component. With the given combination of limited spectral resolution and soft sensitivity, we can not distinguish between these two possibilities. Technically, both scenarios are possible and plausible. Depending on the correct interpretation, the duration of the SSS phase could be different by about a week. According to Page et al. (2009), the SSS phase started between days 36 and 42. If the soft component detected by Suzaku is indeed SSS emission, then the start of the SSS phase would be at least one week earlier.
Central to addressing such questions is the spectral resolution. In high resolution, one could clearly distinguish between SSS and a thin-thermal plasma emission. The results of this work are one example that demonstrates the need for high spectral resolution with sufficient sensitivity at soft energies that would have to be implemented in future X-ray observatories like the International X-ray Observatory.
Acknowledgements.
The authors thank the Suzaku telescope managers for allocating a part of the director’s discretionary time. D. T. is financially supported by the Japan Society for the Promotion of Science. We acknowledge financial support from the Faculty of the European Space Astronomy Centre. This research made use of data obtained from Data ARchives and Transmission System (DARTS), provided by PLAIN center at ISAS/JAXA.References
- Bode et al. (2006) Bode, M. F., et al. 2006, ApJ, 652, 629
- Cash (1979) Cash, W. 1979, ApJ, 228, 939
- della Valle & Livio (1995) della Valle, M., & Livio, M. 1995, ApJ, 452, 704
- Greiner et al. (1991) Greiner, J., Hasinger, G., & Kahabka, P. 1991, A&A, 246, L17
- Hamada & Salpeter (1961) Hamada, T., & Salpeter, E. E. 1961, ApJ, 134, 683
- Hachisu & Kato (2005) Hachisu, I., & Kato, M. 2005, ApJ, 631, 1094
- Hachisu & Kato (2006) Hachisu, I., & Kato, M. 2006, ApJS, 167, 59
- Hachisu & Kato (2009) Hachisu, I., & Kato, M. 2009, ApJ, 694, L103
- Helton et al. (2008) Helton, L. A., Woodward, C. E., Vanlandingham, K., & Schwarz, G. J. 2008, Central Bureau Electronic Telegrams, 1379, 1
- Hernanz & Sala (2007) Hernanz, M., & Sala, G. 2007, ApJ, 664, 467
- Kahabka & van den Heuvel (1997) Kahabka, P., & van den Heuvel, E. P. J. 1997, ARA&A, 35, 69
- Kokubun et al. (2007) Kokubun, M., et al. 2007, PASJ, 59, S53
- Koyama et al. (2007) Koyama, K., et al. 2007, PASJ, 59, S23
- Krautter et al. (1996) Krautter, J., Ögelman, H., Starrfield, S., Wichmann, R., & Pfeffermann, E. 1996, ApJ, 456, 788
- Kuulkers et al. (2008) Kuulkers, E., et al. 2008, The Astronomer’s Telegram, 1480, 1
- Mewe et al. (1985) Mewe, R., Gronenschild, E. H. B. M., & van den Oord, G. H. J. 1985, A&AS, 62, 197
- Mitsuda et al. (2007) Mitsuda, K., et al. 2007, PASJ, 59, S1
- Nakano et al. (2008) Nakano, S., et al. 2008, IAU Circ., 8934, 1
- Ness et al. (2008a) Ness, J.-U., et al. 2008a, The Astronomer’s Telegram, 1561, 1
- Ness et al. (2008b) Ness, J.-U., et al. 2008b, The Astronomer’s Telegram, 1573, 1
- Ness et al. (2009a) Ness, J.-U., et al. 2009a, AJ, 137, 4160
- Ness et al. (2009b) Ness, J.-U., et al. 2009b, AJ, 137, 3414
- Osborne et al. (2008) Osborne, J. P., et al. 2008, The Astronomer’s Telegram, 1542, 1
- Page et al. (2008) Page, K. L., et al. 2008, The Astronomer’s Telegram, 1523, 1
- Page et al. (2009) Page, K. L., et al. 2009, MNRAS, in press.
- Rohrbach et al. (2009) Rohrbach, J. G., Ness, J.-U., & Starrfield, S. 2009, AJ, 137, 4627
- Sala & Hernanz (2005) Sala, G., & Hernanz, M. 2005, A&A, 439, 1061
- Serlemitsos et al. (2007) Serlemitsos, P. J., et al. 2007, PASJ, 59, S9
- Smith et al. (2001) Smith, R. K., Brickhouse, N. S., Liedahl, D. A., & Raymond, J. C. 2001, ApJ, 556, L91
- Starrfield et al. (2008) Starrfield, S., Illiadis, C., Hix, W. R. 2008, in Classical Novae, ed. M. Bode and A. Evans (Cambridge: Cambridge University Press), 77
- Takahashi et al. (2007) Takahashi, T., et al. 2007, PASJ, 59, S35
- Takei et al. (2009a) Takei, D., Tsujimoto, M., Kitamoto, S., Ness, J.-U., Drake, J. J., Takahashi, H., & Mukai, K. 2009a, ApJL, 697, 54
- Takei et al. (2009b) Takei, D., et al. 2009b, in prep.
- Tomov et al. (2008a) Tomov, T., Mikolajewski, M., Ragan, E., Swierczynski, E., & Wychudzki, P. 2008a, The Astronomer’s Telegram, 1475, 1
- Tomov et al. (2008b) Tomov, T., Mikolajewski, M., Brozek, T., Ragan, E., Swierczynski, E., Wychudzki, P., & Galan, C. 2008b, The Astronomer’s Telegram, 1485, 1
- Tsujimoto et al. (2009) Tsujimoto, M., Takei, D., Drake, J. J., Ness, J.-U., & Kitamoto, S. 2009, PASJ, 61, 69
- Wilks (1938) Wilks, S. S. 1938, Ann. Math. Stat., 9, 60
- Wilms et al. (2000) Wilms, J., Allen, A., & McCray, R. 2000, ApJ, 542, 914