Variations on Debris Disks II. Icy Planet Formation as a Function of the Bulk Properties and Initial Sizes of Planetesimals
Abstract
We describe comprehensive calculations of the formation of icy planets and debris disks at 30–150 AU around 1–3 M⊙ stars. Disks composed of large, strong planetesimals produce more massive planets than disks composed of small, weak planetesimals. The maximum radius of icy planets ranges from 1500 km to 11,500 km. The formation rate of 1000 km objects – ‘Plutos’ – is a useful proxy for the efficiency of icy planet formation. Plutos form more efficiently in massive disks, in disks with small planetesimals, and in disks with a range of planetesimal sizes. Although Plutos form throughout massive disks, Pluto production is usually concentrated in the inner disk. Despite the large number of Plutos produced in many calculations, icy planet formation is inefficient. At the end of the main sequence lifetime of the central star, Plutos contain less than 10% of the initial mass in solid material. This conclusion is independent of the initial mass in the disk or the properties of the planetesimals. Debris disk formation coincides with the formation of planetary systems containing Plutos. As Plutos form, they stir leftover planetesimals to large velocities. A cascade of collisions then grinds the leftovers to dust, forming an observable debris disk. In disks with small ( 1–10 km) planetesimals, collisional cascades produce luminous debris disks with maximum luminosity times the stellar luminosity. Disks with larger planetesimals produce debris disks with maximum luminosity (10 km) to (100 km) times the stellar luminosity. Following peak luminosity, the evolution of the debris disk emission is roughly a power law, with 0.6–0.8. Observations of debris disks around A-type and G-type stars strongly favor models with small planetesimals. In these models, our predictions for the time evolution and detection frequency of debris disks agree with published observations. We suggest several critical observations that can test key features of our calculations.
1 INTRODUCTION
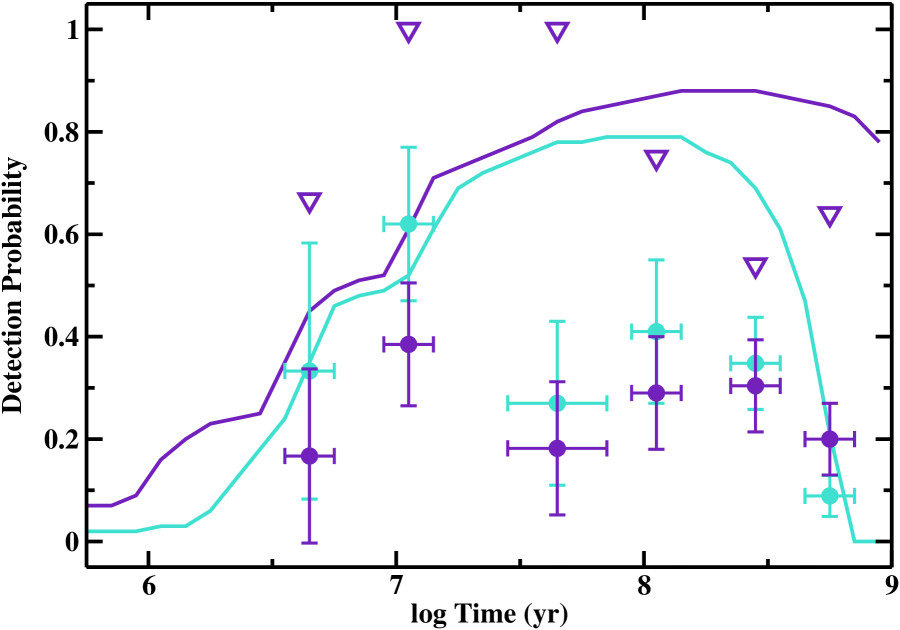
Dusty disks of debris surround many main sequence stars (Backman & Paresce, 1993; Chen et al., 2005; Rieke et al., 2005; Moór et al., 2006; Rhee et al., 2007; Wyatt, 2008). Among young stars, the frequency of debris disks ranges from 50% for B-type and A-type stars (Su et al., 2006; Currie et al., 2008b, 2009) to 10% to 20% for solar-type stars (Trilling et al., 2008; Meyer et al., 2008) to 5% for M-type stars (Plavchan et al., 2009; Lestrade et al., 2009). Binary stars and single stars are equally likely to have debris disks (Stauffer et al., 2005; Su et al., 2006; Bryden et al., 2006; Gorlova et al., 2007; Siegler et al., 2007; Trilling et al., 2007). Among stars with masses 0.8–1 M⊙, the debris disk frequency declines with stellar age (Rieke et al., 2005; Currie et al., 2008a; Carpenter et al., 2009b).
Debris disks are signposts of planet formation. Infrared (IR) and radio observations indicate that grains with typical sizes of 1–100 m produce most of the dust emission. Radiation processes remove these grains on timescales much shorter than the age of the central star (Backman & Paresce, 1993; Wyatt, 2008). To maintain emission from small grains throughout the main sequence lifetime, some process must replenish the dust. The simplest replenishment mechanism invokes a 10–100 M⊕ reservoir of 1 km solid objects which continuously collide at high velocities and fragment into smaller objects (Backman & Paresce, 1993; Habing et al., 2001; Kenyon & Bromley, 2004b; Wyatt, 2008; Heng & Tremaine, 2010). Although this mass is plausible (e.g., Andrews & Williams, 2005, 2007b), collisional damping among an ensemble of 1 m to 1 m objects rapidly reduces collision velocities to low values (e.g., Kenyon & Bromley, 2001). Thus, debris disks require a mechanism to maintain the high velocities of the solids. Gravitational stirring by massive planets is the most successful mechanism (Wyatt, 2008). Thus, in the current picture, maintenance of debris disks requires massive planets.
Two broad classes of planetary systems can explain the general observations of debris disks. In the Solar System, external perturbations power the local debris disk. Jupiter’s gravity excites the orbits of the asteroids and produces the Jupiter family comets; collisions among asteroids and mass loss from comets produce the Zodiacal light (e.g., Nesvorný et al., 2006, 2008, 2009). Beyond 30 AU, Neptune’s gravity plays a similar role for the Kuiper belt and the scattered disk (e.g., Morbidelli et al., 2004; Charnoz & Morbidelli, 2007). The recent discovery of gas giant planets associated with the debris disks in HR 8799 and Fomalhaut (Kalas et al., 2008; Marois et al., 2008; Chen et al., 2009; Su et al., 2009) suggests similar processes occur in other planetary systems (see also Wilner et al., 2002; Moran et al., 2004; Deller & Maddison, 2005; Moro-Martín & Malhotra, 2005; Quillen, 2006; Wyatt, 2006; Faber & Quillen, 2007, and references therein). In particular, Mustill & Wyatt (2009) show that the gravitational perturbations of newly-formed planets at 5–10 AU can produce dusty debris at 30–100 AU. Their results suggest that these perturbation may yield the most luminous debris disks.
Smaller planets can also produce debris disks. In a series of papers, we show that the collisional evolution of solid material in a gaseous protostellar disk naturally leads to the formation of planets along with copious amounts of dusty debris (e.g., Kenyon & Bromley, 2002b, 2004b, 2005). In our picture, mergers of km-sized objects first produce 500–1000 km protoplanets. These protoplanets stir up leftover planetesimals along their orbits. Destructive collisions among the leftovers initiate a collisional cascade, which produces a dusty debris disk (for different approaches to this problem, see also Krivov et al., 2008; Thébault & Wu, 2008; Wyatt, 2008; Heng & Tremaine, 2010; Kennedy & Wyatt, 2010). In the terrestrial zone at a few AU from the central star, rocky protoplanets reach masses of 0.5–2 M⊕ and rapidly remove the debris (Kenyon & Bromley, 2004a, 2005, 2006; see also Bottke et al 2007). At 5–20 AU, the gas entrains the debris, allowing icy protoplanets to grow rapidly into the cores of gas giant planets (Kenyon & Bromley, 2009). At 30–150 AU, icy protoplanets reach maximum sizes of only 1500–2000 km (Kenyon & Bromley, 2008, hereafter KB08). The collisional cascade among the leftover planetesimals produces a luminous debris disk; the maximum brightness and evolution of the debris matches the observations of known debris disks reasonably well (KB08).
Here, we continue our exploration of the formation and evolution of icy planets and debris disks. In KB08, we described a suite of calculations for disks at 30–150 AU around 1–3 M⊙ stars. We considered disks with a single surface density law, a single initial size distribution for planetesimals, and a single set of fragmentation parameters for solid objects. For the calculations discussed here, we examine planet formation in disks with an expanded set of initial conditions for the initial surface density of the disk and for the initial properties of the planetesimals. These results yield new predictions for the maximum sizes of icy planets as a function of initial planetesimal size. Results for the long-term evolution of debris disks continue to account for many fundamental aspects of the data. Our new analysis demonstrates that luminous debris disks at 30–150 AU require planetesimals with initial sizes of 1–10 km instead of 100–1000 km.
Our calculations suggest that the minimum stable grain size, the slope of the size distribution for small grains, and the slope of the IR emissivity law are also critical parameters. Spatially resolved images of debris disks around A-type and solar-type stars can improve our understanding of the minimum stable grain size. Larger samples of debris disks with high quality submm data from the Atacama Large Millimeter/Submillimeter Array (ALMA), the Herschel Space Observatory, and the Stratospheric Observatory for Infrared Astronomy (SOFIA) can place better constraints on the size distribution for small objects and the slope of the emissivity law. Together, these data can test our predictions for the time evolution of debris disk emission around 1–3 M⊙ stars and can provide input for more complete calculations that include the formation and dynamical evolution of giant planets.
We outline the numerical model in §2. We describe the formation of icy planets in §3 and the evolution of debris disks in §4; these sections include ‘highlights’ (§3.3 and §4.3) which summarize the main results and conclusions. In §5, we consider applications of our results to the observed time evolution (§5.1) and frequency (§5.2) of debris disks around A-type and solar-type stars. We conclude with a brief summary in §6.
2 CALCULATIONS
To calculate the formation and evolution of debris disks, we use a hybrid multiannulus numerical code for planet formation. We compute the collisional evolution of an ensemble of planetesimals in a circumstellar disk orbiting a star of mass . The code uses statistical algorithms to evolve the mass and velocity distributions of low mass objects with time and an -body algorithm to follow the individual trajectories of massive objects. KB08 describe the statistical (coagulation) code; Bromley & Kenyon (2006) describe the -body code. Here, we briefly summarize the basic aspects of our approach.
We perform calculations on a cylindrical grid with inner radius and outer radius . The model grid contains concentric annuli with widths centered at semimajor axes . Calculations begin with a mass distribution ) of planetesimals with horizontal and vertical velocities and relative to a circular orbit. The horizontal velocity is related to the orbital eccentricity, = 1.6 , where is the circular orbital velocity in annulus . The orbital inclination depends on the vertical velocity, = sin.
In the coagulation code, the mass and velocity distributions evolve in time due to inelastic collisions, drag forces, and long-range gravitational forces. The collision rate is , where is the number density of objects, is the geometric cross-section, is the relative velocity, and is the gravitational focusing factor (Safronov, 1969; Lissauer, 1987; Spaute et al., 1991; Wetherill & Stewart, 1993; Weidenschilling et al., 1997; Kenyon & Luu, 1998; Krivov et al., 2006; Thébault & Augereau, 2007; Löhne et al., 2008, KB08). The collision outcome depends on the ratio of the collision energy needed to eject half the mass of a pair of colliding planetesimals to the center of mass collision energy . If and are the masses of two colliding planetesimals, the mass of the merged planetesimal is
| (1) |
where the mass of debris ejected in a collision is
| (2) |
This approach allows us to derive ejected masses for catastrophic collisions with and for cratering collisions with (see also Wetherill & Stewart, 1993; Williams & Wetherill, 1994; Tanaka et al., 1996; Stern & Colwell, 1997; Kenyon & Luu, 1999; O’Brien & Greenberg, 2003; Kobayashi & Tanaka, 2010). Consistent with N-body simulations of collision outcomes (e.g., Benz & Asphaug, 1999; Leinhardt et al., 2008; Leinhardt & Stewart, 2009), we set
| (3) |
where is the bulk component of the binding energy, is the gravity component of the binding energy, is the radius of a planetesimal, and is the mass density of a planetesimal.
To compute the evolution of the velocity distribution, we include collisional damping from inelastic collisions, gas drag, and gravitational interactions. For inelastic and elastic collisions, we follow the statistical, Fokker-Planck approaches of Ohtsuki (1992) and Ohtsuki, Stewart, & Ida (2002), which treat pairwise interactions (e.g., dynamical friction and viscous stirring) between all objects in all annuli. As in Kenyon & Bromley (2001), we add terms to treat the probability that objects in annulus interact with objects in annulus (see also Kenyon & Bromley, 2004b, KB08). We also compute long-range stirring from distant oligarchs (Weidenschilling, 1989). For gas drag, we follow Wetherill & Stewart (1993), who calculate drag in the quadratic limit (see also Adachi et al., 1976; Weidenschilling, 1977b).
To evolve the gas in time, we consider a simple nebular model for the gas density. We adopt a scale height (Kenyon & Hartmann, 1987) and assume that the gas surface density declines exponentially with time
| (4) |
where and are scaling factors and is the gas depletion time. To enable comparisons with results in KB08, we adopt = 10 Myr. Although longer than the 2–5 Myr timescale estimated from observations of the lifetimes of accretion disks in pre-main sequence stars (Currie et al., 2009; Kennedy & Kenyon, 2009; Mamajek, 2009), shorter gas depletion times have little impact on our results.
In the -body code, we directly integrate the orbits of objects with masses larger than a pre-set ‘promotion mass’ . The calculations allow for mergers among the -bodies. Additional algorithms treat mass accretion from the coagulation grid and mutual gravitational stirring of -bodies and mass batches in the coagulation grid. For the applications in this paper, the few large objects capable of promotion into the -body code never contain a significant fraction of the mass in an annulus and never contribute significantly to the local stirring. To treat situations where a few large objects might impact the evolution, we set g. However, our calculations never produced more than a few -bodies. These remained on circular orbits throughout their evolution.
The initial conditions for these calculations are appropriate for a disk with an age of 1–2 Myr (e.g. Dullemond & Dominik, 2005; Nomura & Nakagawa, 2006; Ciesla, 2007; Garaud, 2007). We consider systems of annuli in disks with = 30–150 AU and = 0.025. We assume a power law variation of the initial surface density of solid material with semimajor axis,
| (5) |
where is the central radius of the annulus in AU, = 1 or 3/2, and is a scaling factor. Consistent with observations of disks surrounding pre-main sequence stars (e.g., Scholz et al., 2006; Schaefer et al., 2009), we scale the reference surface density of solids with the stellar mass, = 30 ) g cm-2 (see also Weidenschilling, 1977a; Hayashi, 1981). For a standard gas to dust ratio of 100:1, . To explore a range of disk masses similar to the observed range among the youngest stars, we consider = 0.01–3; disks with 0.1 have masses similar to the median disk masses observed around young stars in nearby dark clouds (Osterloh & Beckwith, 1995; Motte & André, 2001; Andrews & Williams, 2005, 2007b).
As a baseline model, we consider disks composed of small planetesimals with initial radii of 1–1000 m and an initial mass distribution in each annulus. The mass ratio between adjacent bins is = 1.4–2. At the start of the calculations, each bin has the same total mass, eccentricity , and inclination . To examine the dependence of our results on the initial radii of planetesimals, we also perform calculations where all of the initial mass is in planetesimals with radii of 1 km, 10 km, or 100 km.
Although our adopted range of disk masses and surface density gradients is consistent with observations of the youngest stars (Andrews & Williams, 2005, 2007b), our adopted outer radius of 150 AU is probably larger than the typical outer disk radius. Analyses of high quality submm observations of nearby young stars yield a broad range of outer disk radii, 20 AU to 200 AU (e.g., Andrews & Williams, 2007a). However, recent studies suggest the typical outer radius is 75–100 AU (Hughes et al., 2008; Andrews et al., 2009; Isella et al., 2009). In KB08, we showed that smaller disks produce roughly comparable amounts of debris disk emission at 70 m and much less emission at longer wavelengths. Here, we concentrate on understanding the evolution of larger disks and use the results from KB08 to examine the impact of smaller disks on our results.
To explore the sensitivity of our results to the fragmentation algorithm, we consider two sets of fragmentation parameters . Strong planetesimals have = ( = , , or erg g-1, = 0, = 2.25 erg g-2 cm1.75, = 1.25; KB08, Benz & Asphaug, 1999). Weaker planetesimals have = ( = erg g-1 cm0.4, , = 0.33 erg g-2 cm1.7, = 1.3; Leinhardt & Stewart, 2009).
Tables 1–2 summarize the model grids. Table 1 lists the initial disk masses for the ranges in , we consider and the adopted main sequence lifetimes for the central stars. Because the growth of planets has large stochastic variations, we repeated the calculations 5–15 times for each set of starting conditions, , , , and . Table 2 lists the number of calculations for each (, ) pair. For calculations with strong planetesimals, the number of repetitions for each (, , or erg g-1) is approximately 1/3 the number listed in the Table.
Our calculations follow the time evolution of the mass and velocity distributions of objects with a range of radii, to . The upper limit is always larger than the largest object in each annulus. To save computer time in our main calculation, we do not consider small objects which do not significantly affect the dynamics and growth of larger objects, = 100 cm. Erosive collisions produce objects with which are ‘lost’ to the model grid. Lost objects are more likely to be ground down into smaller objects than to collide with larger objects in the grid (see Kenyon & Bromley, 2002a, 2004a).
To derive the amount of dusty debris as a function of time, we follow the evolution of the ‘lost’ objects using a simple collision algorithm that includes Poynting-Robertson drag and radiation pressure (see Kenyon & Bromley, 2004a, KB08). Every timestep, we add new debris to each annulus. The new debris has a fixed size distribution, with = 3.5, between and the minimum stable grain size . In parallel, we derive collision rates and Poynting-Robertson drag rates for the old debris. As long as the particle velocities are not size dependent, this routine yields reasonably accurate results for the evolution of the size distribution.
Our approach to the evolution of dusty debris ignores collisions between very small grains ejected by radiation pressure and larger grains on bound orbits (e.g., Grigorieva et al., 2007). These collisions provide an extra source of small grains, potentially enhancing the optical depth throughout the disk. To estimate the potential impact of these collisions in our calculations, we compare (i) the rate very small grains produce debris through collisions with larger grains and (ii) the rate oligarchs and other large objects immune to disruption sweep up the extra debris. Our estimates suggest that these two processes approximately balance. Thus, the collisional avalanches described by Grigorieva et al. (2007) probably have little impact on our results.
To set the main parameters – and – in this approach, we follow previously published results (see also KB08). Theoretical estimates for the minimum stable grain size yield 0.5–2 (Burns, Lamy, & Soter, 1979; Artymowicz, 1988; Backman & Paresce, 1993; Kimura et al., 2002). Because the coefficient is sensitive to the composition, internal structure, and radiative properties of the grains, we adopt = 1 m. Thus, we probably overestimate the number of small grains and the amount of infrared excesses for stars more massive than 1 M⊙. For small particles with , = (O’Brien & Greenberg, 2003; Kobayashi & Tanaka, 2010). Thus, = 3.5 (3.67) for strong (weak) planetesimals. Our adopted = 3.5 underestimates infrared excesses for systems with weak planetesimals. In §5, we consider the impact of these choices in more detail.
As in KB08, we use simple scaling relations to show how our results depend on initial conditions and the properties of the grid. For each set of calculations (Table 2), we derive median results for the size distribution, the size of the largest object as a function of and , and other physical variables. Substituting the inter-quartile range for the dispersion, we then perform least-squares fits to relate these median results to input parameters (e.g., ) and the properties of the grid (e.g., ). For parameters where analytic theory predicts a relation (e.g., the growth time as a function of ), we derive the best-fitting coefficient, test whether different fitting functions provide better fits to our results, and keep the result that minimizes per degree of freedom. When analytic theory provides no guidance, we derive fitting functions that yield the sensitivity of our results to all important physical variables. Thus, our fits test some aspects of analytic theory and guide other aspects.
3 PLANET FORMATION CALCULATIONS
3.1 Icy Planet Formation in Disks Around 1 M⊙ Stars
We start with a description of icy planet formation in disks at 30–150 AU around a 1 M⊙ star. For disks with masses 0.003 M⊙, the timescale to form large objects at the outer edge of the disk (150 AU) is shorter than the main sequence lifetime of the central star. In these disks, the outcome of icy planet formation depends on the physics of icy solids rather than on stellar physics. For lower mass disks, the central star evolves off the main sequence before icy planet formation reaches a ‘standard’ outcome throughout the disk. Because post-main sequence evolution changes the structure in the disk considerably (see the discussion in KB08), we do not follow the growth of icy planets after the central star evolves off the main sequence. Thus, icy planet formation is truncated in the lowest mass disks.
In this section, we review the stages of icy planet formation and describe the outcome of collisional evolution throughout the disk. For our adopted grids of initial disk masses (Table 2) and a range of initial planetesimal sizes and fragmentation parameters, we derive relations for the time scale and maximum radius of planets as a function of initial conditions. We also demonstrate how the dust production rate and the mass in dust grains depend on initial conditions and time.
In §3.2, we compare these results with calculations for 1.5–3 M⊙ stars. For disks around more massive stars, the growth time is a smaller and smaller fraction of the main sequence lifetime. Thus, icy planet formation is truncated at smaller and smaller disk radii for more and more massive stars. Here, we show how larger disk masses and shorter main sequence lifetimes change the results derived for 1 M⊙ stars.
3.1.1 Growth of Large Objects
At the start of our simulations, planetesimals have random velocities comparable to their escape velocities, 1 m s-1. Both velocities are smaller than the velocities, 10 m s-1, required to disrupt a colliding pair of planetesimals. Thus, collisions produce mergers instead of debris. Because the growth of planetesimals depends on the initial size distribution, we first discuss the evolution of an ensemble of 1 m to 1 km planetesimals. We then consider the evolution of a swarm of planetesimals of a single size.
For an ensemble of 1 m to 1 km planetesimals, icy planet formation in the outer regions of a disk surrounding a low mass star has three distinct stages (Kenyon & Luu, 1999; Kenyon & Bromley, 2004a; Kenyon et al., 2008). Initially, planetesimals grow slowly. As they grow, dynamical friction damps and for the largest objects; dynamical friction and viscous stirring raise and for the smallest objects (Greenberg et al., 1984; Wetherill & Stewart, 1993; Goldreich, Lithwick, & Sari, 2004). Stirring creates a rough equipartition in kinetic energy between large and small objects; thus, gravitational focusing increases collisional cross-sections by factors of 10–100. Slow, orderly growth ends. Runaway growth begins. During runaway growth, a few large objects grow much faster than smaller objects and ‘run away’ from the rest of the planetesimal swarm. Gravitational stirring continues to raise and for the smallest objects. As viscous stirring raises and for the runaways, gravitational focusing factors decline; growth of the largest objects slows. Runaway growth ends. Oligarchic growth – where the largest objects still grow more rapidly than smaller planetesimals – begins. As oligarchic growth proceeds, the oligarchs contain an ever increasing fraction of the mass in the disk (Ida & Makino, 1993; Wetherill & Stewart, 1993; Kokubo & Ida, 1998; Rafikov, 2003; Chambers, 2006; Nagasawa et al., 2007).
Throughout runaway and oligarchic growth, other physical processes modify the growth rates of massive oligarchs. At the start of our simulations, gas drag damps the velocities of small objects and transports small particles radially inward. Although the net transport towards the central star is small, damping increases gravitational focusing factors and enhances runaway growth (Rafikov, 2004, see also the Appendix of KB08). In the inner disk, the timescale for gas dissipation is comparable to the timescale for runaway growth. Thus, gas drag produces shorter growth times for large objects (Rafikov, 2004, KB08).
During the transition from runaway to oligarchic growth, collisions start to produce copious amounts of dust. As oligarchs grow from 100 km to 1000 km, they stir leftover 1–10 km planetesimals to large collision velocities. Collisions between small objects then produce debris instead of mergers (see Kenyon et al., 2008, and references therein). Once debris production begins, continued gravitational stirring leads to a collisional cascade, where leftover planetesimals are ground down into smaller and smaller objects. Destructive collisions among the leftovers are much more likely than mergers of leftovers with much larger oligarchs. Thus, the collisional cascade grinds 1–10 km planetesimals into small dust grains.
Collisions and radiative processes rapidly remove dust grains from the disk. For grains with 10–100 m, the collision time is much shorter than the timescales to remove particles by gas drag (Adachi et al., 1976) or by Poynting-Robertson drag (Burns, Lamy, & Soter, 1979). Thus, the collisional cascade continues until particles reach sizes of a few microns. At these sizes, the orbital time is usually shorter than the collision time. Radiation pressure then rapidly removes small particles from the cascade (Burns, Lamy, & Soter, 1979; Artymowicz, 1988). This ejection produces a disk-shaped ‘wind’ of small particles (e.g., Lecavelier Des Etangs et al., 1998; Takeuchi & Artymowicz, 2001; Kenyon & Bromley, 2004a; Su et al., 2005).
Because runaway growth leaves most of the mass in 1–10 km objects, the collisional cascade removes a significant fraction of the solid material in the disk. Thus, the maximum sizes of oligarchs are small, 1500–2500 km (KB08). Although the gaseous disk can entrain small particles and halt the cascade in the inner disk (a 5–10 AU; Kenyon & Bromley, 2009), the gaseous disk dissipates during runaway growth at 30 AU. Thus, interactions with the gas cannot halt the cascade during oligarchic growth at 30 AU.
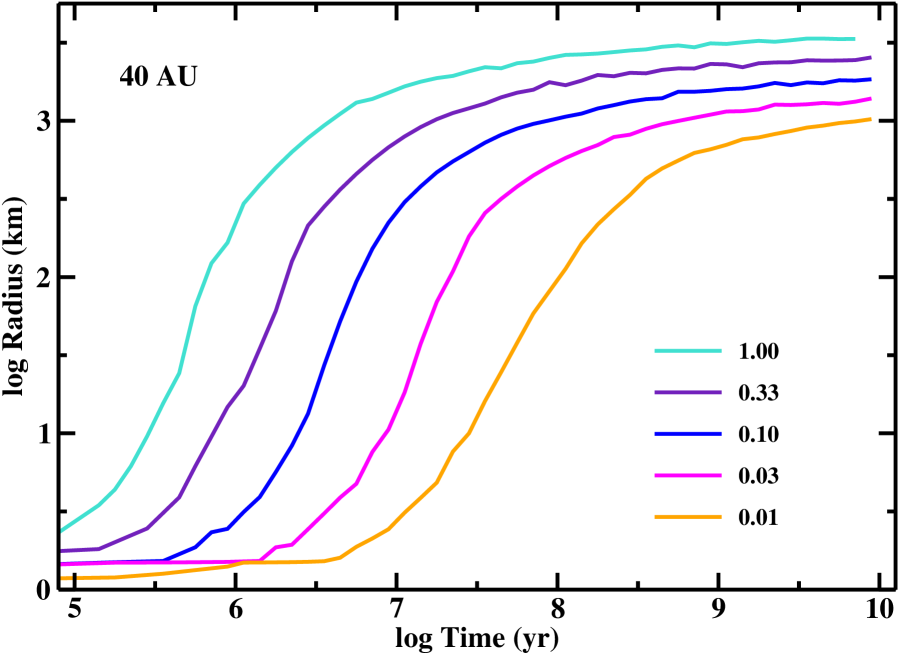
Figure 1 shows the growth of the largest object at 40 AU in disks with initial surface density g cm-2 surrounding a 1 M⊙ star. In the lowest mass disks ( 0.01–0.03), slow, orderly growth lasts 1–10 Myr. During runaway growth, the largest objects reach sizes of 300 km in 10–100 Myr. As the swarm makes the transition to oligarchic growth, the largest objects reach sizes of 500–1000 km. The largest objects then grow very slowly to sizes of 1000–1250 km as the central star evolves off the main sequence. In more massive disks, growth is much faster. For 0.1, slow growth and runaway growth produce 300 km objects in 10 Myr. Once these systems make the transition to the oligarchic phase, growth slows significantly. Despite very rapid early growth, the largest objects in the most massive disks are still relatively small, 3000 km, at the end of the main sequence lifetime of the central star.
Disks with steeper surface density gradients follow the same evolutionary path (KB08; Figure 2). For g cm-2, disks with identical have a factor of 6 less material at 30–40 AU than disks with . Because the collision rate is proportional to the total mass in solids, these disks take a factor of 6 longer to reach runaway and oligarchic growth. Once the runaway begins, growth still produces 300 km objects fairly rapidly. During oligarchic growth, the largest objects at 30–40 AU approach sizes of 1000 km. As oligarchic growth proceeds, the collisional cascade removes most of the leftover planetesimals. Thus, the largest objects reach maximum sizes of 1000–1500 km.
Combined with results from KB08 (e.g., Figure 8), Figures 1–2 also illustrate the impact of the bulk properties of planetesimals on growth rates. In calculations with the strong fragmentation parameters (), massive objects have 3000 km in massive disks and 1000 km in the low mass disks (Figure 1; see also Figures 2–3 of KB08). Calculations with the parameters yield 2000 km (500 km) in massive (low mass) disks. The collisional cascade is responsible for this difference. During oligarchic growth, the collision velocities scale with the mass of the largest object. When planetesimals are weaker, they fragment at smaller collisional velocities. Thus, weaker planetesimals begin to fragment when the largest oligarchs are smaller. Because the collisional cascade robs growing oligarchs of leftover planetesimals, oligarchs cannot grow as large when planetesimals are weaker.
Figure 3 compares the variation of with our input parameters in more detail. For both values of in the plots, calculations with the parameters produce smaller objects than those with the parameters. In both panels, the curves diverge near the end of runaway growth when 100 km. When objects reach this radius, collisions destroy weak planetesimals. Stronger planetesimals survive until oligarchs reach sizes of 300 km. Because the collisional cascade begins earlier when planetesimals are weak, growing oligarchs are smaller and have a smaller reservoir of leftover planetesimals to accrete. Thus, the largest oligarchs are always smaller in calculations with weak planetesimals.
Figure 3 also illustrates how the growth time depends on , the initial gradient in our adopted relation for the radial surface density (equation (5)). For disks with identical total masses inside 150 AU, objects at 40 AU (100 AU) grow faster in disks with larger (smaller) . This difference persists throughout the main sequence lifetime of the central star. Objects at 40 AU (100 AU) are larger in disks with larger (smaller) .
To combine these general conclusions into a robust relationship between the growth time and the input parameters, we consider standard coagulation theory. For oligarchs embedded in a swarm of planetesimals, the accretion rate is roughly the ratio of the mass in an annulus to the orbital period. Thus, the growth time is , where is the orbital period (e.g., Lissauer, 1987; Goldreich, Lithwick, & Sari, 2004, KB08). For and (equation (5)), the growth time is . Gas drag enhances dynamical friction during runaway growth, reducing the growth time (Rafikov, 2004). Including this process yields
| (6) |
For disks with a long-lived gaseous component, Rafikov (2004) derived 0.3 to 0.4. In our calculations, the lifetime of the gaseous disk is shorter than the runaway growth time. Thus, we expect 0.1–0.2 (KB08).
To apply this prediction to our simulations, we measure the median time required for objects to reach sizes of 1000 km, , as a function of the input parameters111 Planets with radii of 1000 km are a natural choice for this comparison. Calculations with weak planetesimals do not reach significantly larger radii (equation 8). Timescales to reach a 500 km radius have more scatter.. To derive the best exponents in equation (6), we use a least-squares fit. For our calculations, we derive:
| (7) |
where /80 AU. For each set of calculations, the inter-quartile range in the median is 15% to 20%.
These results agree with the analytic predictions. For each surface density law, the growth time scales with and as expected. When planetesimals are weak, the collisional cascade should remove more material from the disk. Thus, growth times for calculations with the parameters are longer than those with the parameters. The difference in coefficients for the first two relations of equation (7) is a result of the different initial surface density at 80 AU when = 1. In our formalism, . Thus, the scaling law in equation (7) yields expected formation times roughly 12.5 longer in disks with = 3/2. This result is close to the ratio of the coefficients, 13.3, in our expression for the growth time.
To derive scaling relations for the maximum radius of icy planets as a function of input parameters, we examine results near the end of the main sequence lifetime of the central star. For each calculation, we derive the radius of the largest object as a function of and . When the collisional cascade has destroyed nearly all leftover planetesimals throughout the disk, is roughly constant with . Thus, we adopt the median value of as . In massive disks with , the collisional cascade rapidly removes leftover planetesimals; icy planets reach for (e.g., Figure 1). In low mass disks, icy planets reach their limiting radii well after .
For this ensemble of calculations, we derive
| (8) |
The inter-quartile range in is 10%.
These results also agree with expectations. Because the collisional cascade removes more material from the disk when planetesimals are weak, the largest objects are much smaller. In disks with strong planetesimals, we expect regions with similar surface density to produce objects with similar sizes. With , our scaling laws yield 3500 km for () = (1, 1) and 3450 km for () = (3/2, 9). For a broad range of disk masses, the two surface density laws yield similar masses for icy planets at 30 AU.
To explore the growth of icy planets as a function of initial conditions in more detail, we now consider calculations when planetesimals of one size contain all of the initial mass. When the range of initial planetesimal sizes is small, dynamical friction cannot damp and for the largest objects. Viscous stirring raises and for all planetesimals. Gravitational focusing factors remain small; growth is very slow. As the largest objects grow to sizes roughly a factor of ten larger than the initial size, dynamical friction becomes more effective. Gravitational focusing factors increase; runaway growth begins. Compared to calculations that start with a broad range of planetesimal sizes, gravitational focusing is weaker and viscous stirring is stronger. Thus, the evolution makes the transition from runaway to oligarchic growth sooner.
Although growth is slow when planetesimals are larger, objects grow to larger sizes. When runaway and oligarchic growth begin, the average size of a planetesimal is roughly proportional to the initial size. Larger planetesimals are harder to fragment. As the initial size of planetesimals increases, the collisional cascade begins later and later relative to the onset of oligarchic growth. Because the collisional cascade removes planetesimals faster than oligarchs can accrete them, a delayed collisional cascade allows oligarchs to grow to larger sizes.
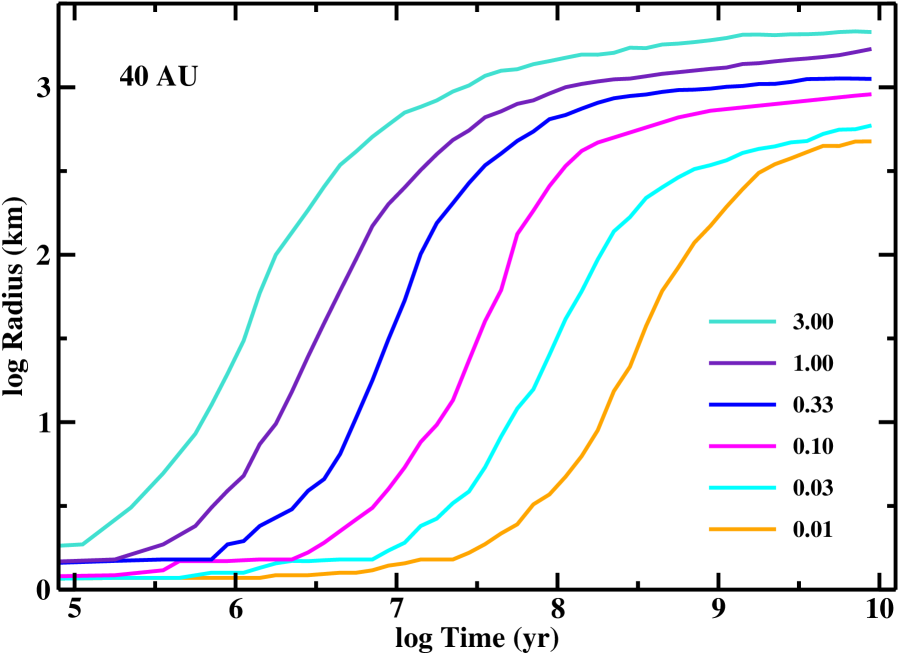
Figure 4 shows the growth of the largest object at 40 AU in disks with and initial planetesimal sizes of 1 km (lower panel), 10 km (middle panel), and 100 km (upper panel). In low mass disks with 1 km planetesimals, slow growth lasts 100 Myr, 5–10 times longer than in calculations with an ensemble of 1 m to 1 km planetesimals. During a 1 Gyr period of runaway growth, icy planets grow from 10 km to 300 km. These disks then make the transition to oligarchic growth, when icy planets reach maximum sizes of 1000 km. Although planets grow more rapidly in the most massive disks, the time to reach runaway growth is still long. Comparing with results in Figure 3, icy planets take 5 times longer to reach sizes of 100 km and 3 times longer to reach sizes of 1000 km.
For calculations with larger planetesimals, growth is even slower. As the initial planetesimal radius increases from 1 km to 10 km, the rate of growth slows by a factor of roughly 4. In calculations with 100 km planetesimals, icy planets in the most massive disks reach their maximum sizes near the end of the main sequence lifetime of the 1 M⊙ central star, roughly 10 times later than calculations with an ensemble of 1 km planetesimals. In the lowest mass disks, the largest objects have barely grown by a factor of two as the central star evolves off the main sequence.
Although the faster growth of smaller planetesimals may seem counterintuitive, collision physics provides a simple explanation. For an individual oligarch, the growth rate is , where is the angular frequency, is the collision cross-section, and is the gravitational focusing factor (see the Appendix of KB08 and references therein). For calculations with = 10 km and = 100 km, the ratio of growth rates in the dispersion-dominated regime is
| (9) |
For oligarchs with = 200 km, the ratio of cross-sections is 0.8. However, dynamical friction among growing oligarchs produces a broad range in . For this example, the ratio of gravitational focusing factors from our calculations is 2; 1.5. When = 1 km, the ratio of growth rates is 8. Thus, 200 km oligarchs grow faster in a sea of smaller planetesimals.
To quantify the relative growth rates in our calculations, we derive the time for objects to grow to 1000 km as a function of the initial planetesimal size. We infer
| (10) |
For these calculations, the inter-quartile range in the median is 15%.
Compared to our calculations with an ensemble of 1 m to 1 km planetesimals, these growth times have two major differences. Because the slow growth phase lasts much longer, damping by gas drag is not important. Thus, the time to form 1000 km objects scales more weakly with . Because all growth phases are slow, stirring by long-range perturbations is more important in the outer disk. Larger stirring rates in the outer disk slows growth relative to the inner disk. Thus, scales more strongly with .
Our results demonstrate that larger planetesimals produce larger oligarchs. For disks around 1 M⊙ stars, the largest objects have radii
| (11) |
with a typical inter-quartile range of 10%. Compared to our other set of calculations, these objects are 50% to 3 times larger and 3–30 times more massive. Thus delaying the collisional cascade has a significant impact on the sizes of the largest objects.
To conclude this discussion of the formation of icy planets, we consider the fraction of initial disk mass left in solid material of various sizes. For calculations with an initial ensemble of 1 m to 1 km planetesimals, the median fraction of solids remaining in the disk ranges from 10% to 20% in massive disks to more than 95% in the lowest mass disks. This depletion varies by a factor of 2–3 from the inner disk to the outer disk. The median fraction of initial mass in 1000 km and larger objects is roughly 1% to 2% in massive disks and less than 0.1% in the lowest mass disks. The median fraction of material in 100 km and larger objects is roughly a factor of two larger.
Results for calculations with a single planetesimal size are similar. The collisional cascade removes a much smaller fraction of the initial disk mass, ranging from 80% in the inner disks of the most massive disks composed of 1 km planetesimals to 1% throughout the disks composed of 100 km planetesimals. Despite the ability to produce larger objects overall, very little mass ends up in 1000 km or larger planetesimals. Over the lifetime of the central star, the lowest mass disks never produce 1000 km objects. For the most massive disks, we derive 2% (1 km), 5% (10 km), and 10% (100 km) of the initial mass in 1000 km or larger objects at the end of the main sequence lifetime of the central star.
These results show that planet formation at 30–150 AU is very inefficient. Most of the initial mass in solids is either removed by the collisional cascade or remains in small planetesimals with sizes comparable to their initial size. Very little of the initial mass is incorporated into much larger objects. Although more mass ends up in much larger objects when planetesimals are initially large, 1000 km or larger objects never contain more than 10% of the initial solid mass in the disk.
3.1.2 Evolution of Dust
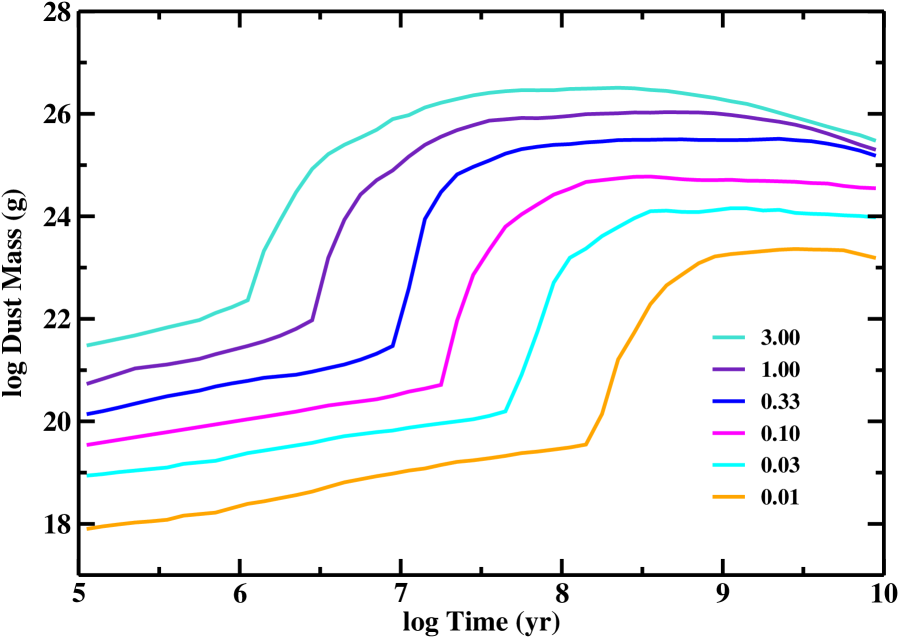
In our calculations, the collisional cascade converts 1–2% to more than 95% of the initial solid mass into dust. Because oligarchs and leftover planetesimals with km are unobservable with current techniques, dust emission is the only observational diagnostic of icy planet formation at 30–150 AU around other stars. Here, we consider the time evolution of the dust around 1 M⊙ stars as a function of our input parameters.
To describe our results, we follow KB08 and divide the dust into large grains with = 1 mm to 1 m, small grains with = 1 m to 1 mm, and very small grains with 1 m. Although Poynting-Robertson drag removes some large grains in the inner regions of low mass disks, the collisional cascade grinds nearly all large grains into small grains on timescales of 10 Myr to 10 Gyr. Poynting-Robertson drag removes from 1% to 40% of the mass in small grains; collisions grind the rest into very small grains. For most stars with 1 M⊙, radiation pressure rapidly ejects very small grains (see also Krivov et al., 2000; Wyatt, 2005). These grains then produce an outflowing wind of small particles in the disk midplane. This wind contains 60% to 100% of the total amount of mass lost from the disk. More massive disks lose more mass in the wind; low mass disks lose less mass in the wind (see also KB08).
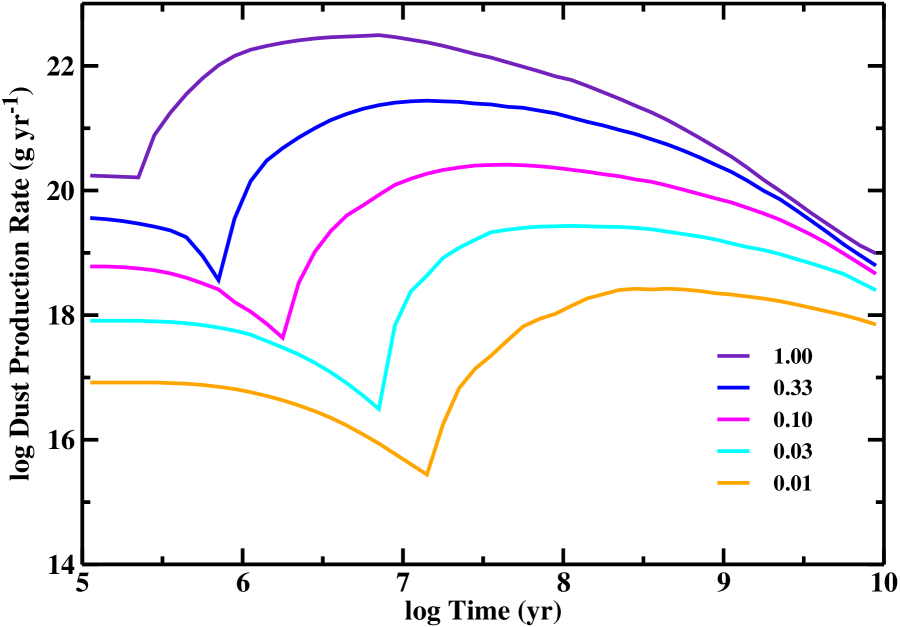
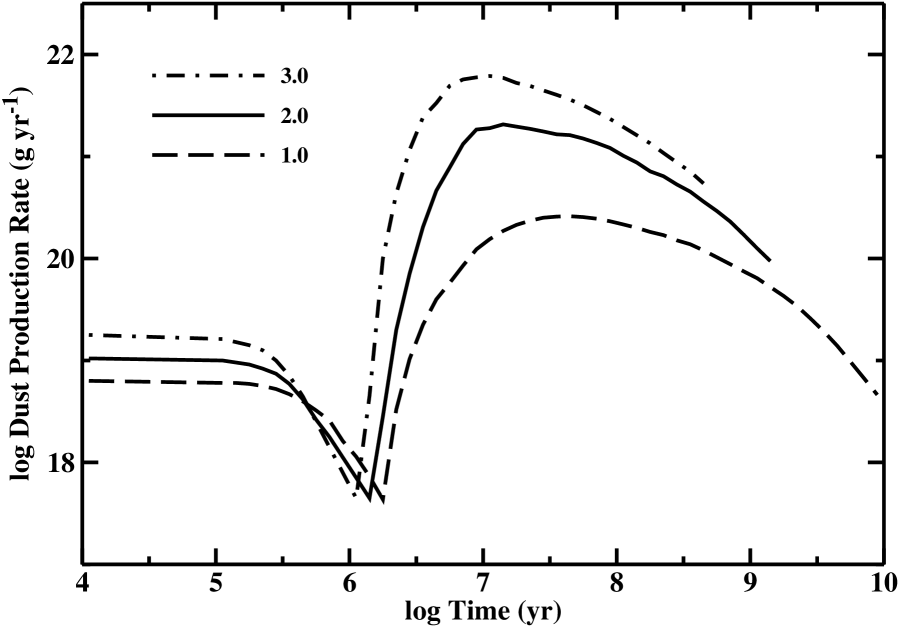
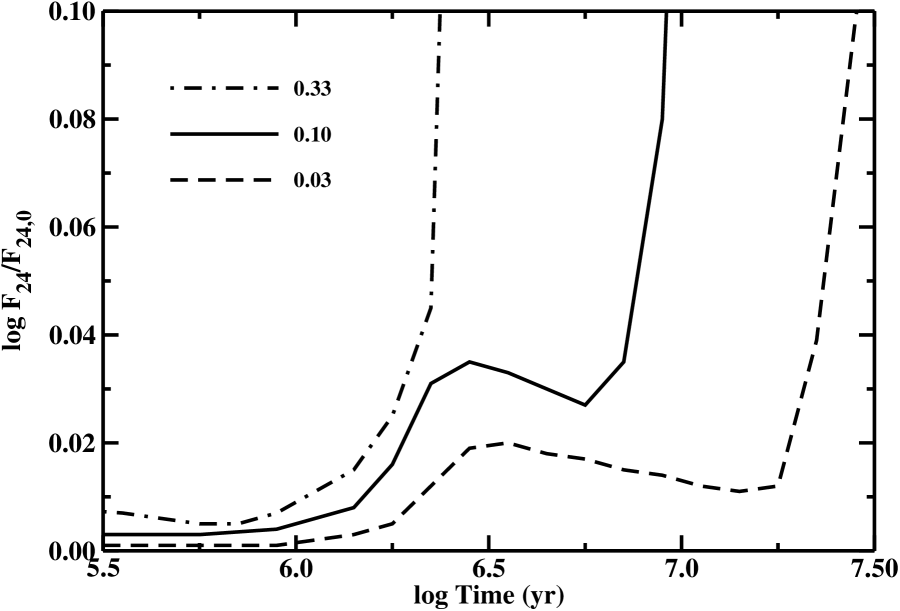
Figure 5 shows the time evolution of the production rate for very small grains in disks with and a range of initial disk masses. When each calculation begins, collisional damping, dynamical friction, and gas drag reduce collision velocities throughout the disk. Thus, collisions produce less and less debris; the dust production rate slowly declines with time. During the late stages of runaway growth and the onset of oligarchic growth, the largest objects reach sizes of 300 km to 500 km. These oligarchs stir leftover planetesimals along their orbits. Dust production rapidly increases. As oligarchs grow, continued stirring leads to a collisional cascade and a peak in the dust production rate. After the dust production rate peaks, the cascade removes more and more leftover planetesimals from the disk. Fewer planetesimals have less frequent collisions and produce less dust. The dust production rate then slowly declines with time.
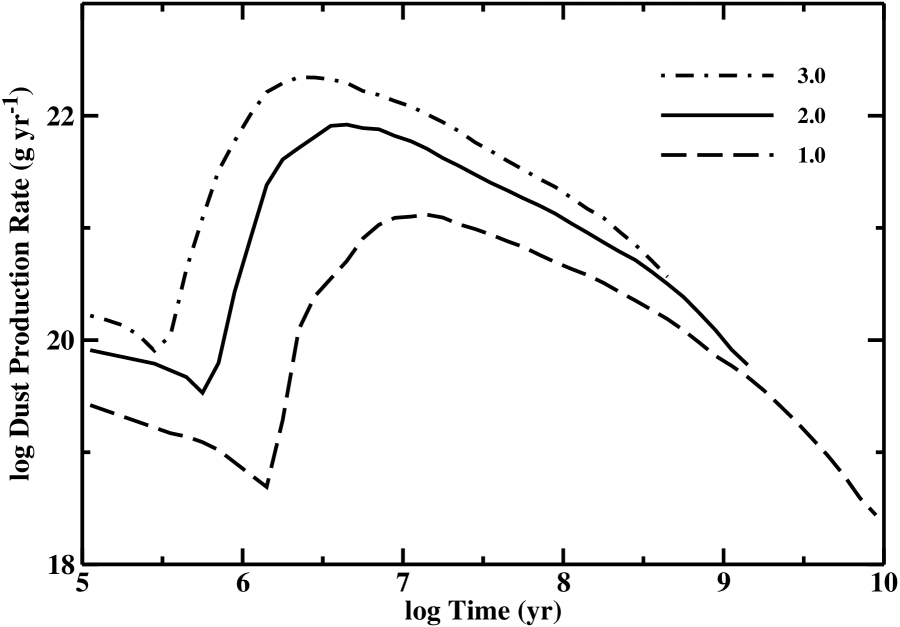
Figure 6 repeats the plot in Figure 5 for disks with . In both cases, the maximum production rate of very small grains is roughly g yr-1, implying a maximum mass loss rate of 1.5 M⊕ Myr-1. This maximum rate is roughly 5 orders of magnitude larger than the mass loss rates in the lowest mass disks, 1% of a lunar mass every million years. The large range in local collision rates yields the large difference in dust production rates. The number of destructive collisions scales with the square of the local mass density of leftover planetesimals. Thus, the dust production rate scales with . For these calculations, we derive maximum dust production rates of
| (12) |
The time evolution of the collision rate yields a simple relation between the time of maximum dust production and the initial disk mass. For the calculations described here and in KB08, we infer:
| (13) |
In these expressions, the time of maximum dust production rate scales with the collision time for leftover planetesimals in the inner disk. This timescale scales inversely with the disk mass. In both sets of equations, the inter-quartile range is 5% to 10%.
These relations illustrate the impact of different surface density laws and fragmentation parameters on the production rate of very small grains. In disks with , calculations with weaker planetesimals produce more dust sooner than calculations with stronger planetesimals. For the two sets of fragmentation parameters we investigate, the difference in dust production rate is roughly a factor of two. Dust production peaks roughly 10% earlier in time for calculations with weaker planetesimals. For calculations with identical fragmentation parameters but different surface density relations, disks with similar total masses yield similar maximum dust production rates.
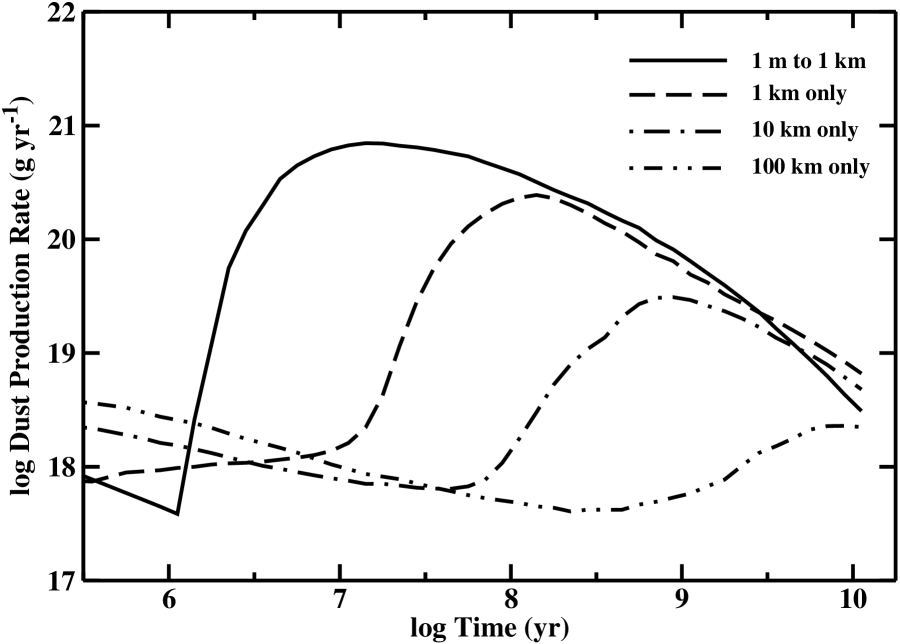
Dust production is very sensitive to the initial size of planetesimals (Figure 7). For g cm-2 and the fragmentation parameters, an ensemble of 1 m to 1 km planetesimals produces a maximum dust production rate of roughly g yr-1 at 14 Myr. Collisional cascades in an ensemble of 1 km planetesimals, however, yield a factor of 30 smaller dust production rate, g yr-1, almost an order of magnitude later in time, 775 Myr. Ensembles of larger, 10 km and 100 km, planetesimals yield even smaller maximum dust production rates at very late times. For 1–100 km planetesimals, our results suggest that the maximum dust production rate declines by roughly a factor of ten for every factor of ten increase in the initial planetesimal size. The time when this maximum occurs increases by a factor of 6–7 for each factor of ten increase in the initial size of planetesimals.
Although the dust production rate and time of maximum dust production depend on the initial planetesimal size, we derive similar scaling laws with initial disk mass. Our calculations yield
| (14) |
for the maximum dust production rates and
| (15) |
for the time of maximum dust production. In both sets of equations, the inter-quartile range is 5% to 10%.
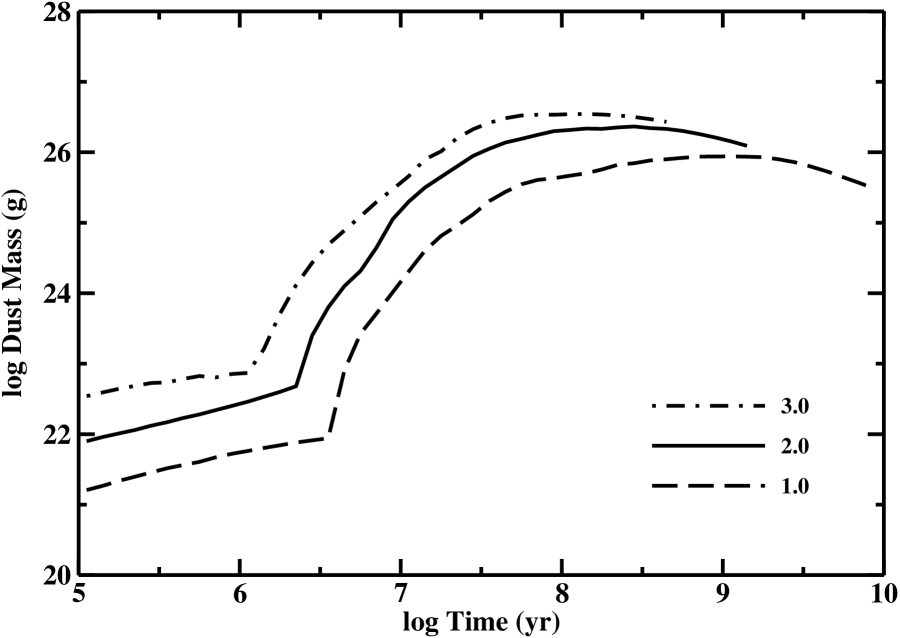
The large production rates of very small grains in our calculations require massive reservoirs of small and large dust grains. In each annulus, the evolution of the mass in small and large grains follows a standard pattern. During slow growth and most of runaway growth, dust production rates decline with time (Figure 5). Despite this decline, collisions among planetesimals produce large and small grains faster than collisions or Poynting-Robertson drag remove them. The mass in small grains grows slowly with time. When oligarchic growth begins, dust production and the masses of small and large grains increase rapidly. The collisional cascade begins, converting km-sized planetesimals into dusty debris. Initially, the cascade rapidly converts planetesimals into very small grains which are ejected by radiation pressure. As the cascade proceeds, the collision rate declines. Poynting-Robertson drag removes more and more small grains from the disk. Eventually, Poynting-Robertson drag dominates collisions and the mass in small grains in the annulus rapidly declines to zero.
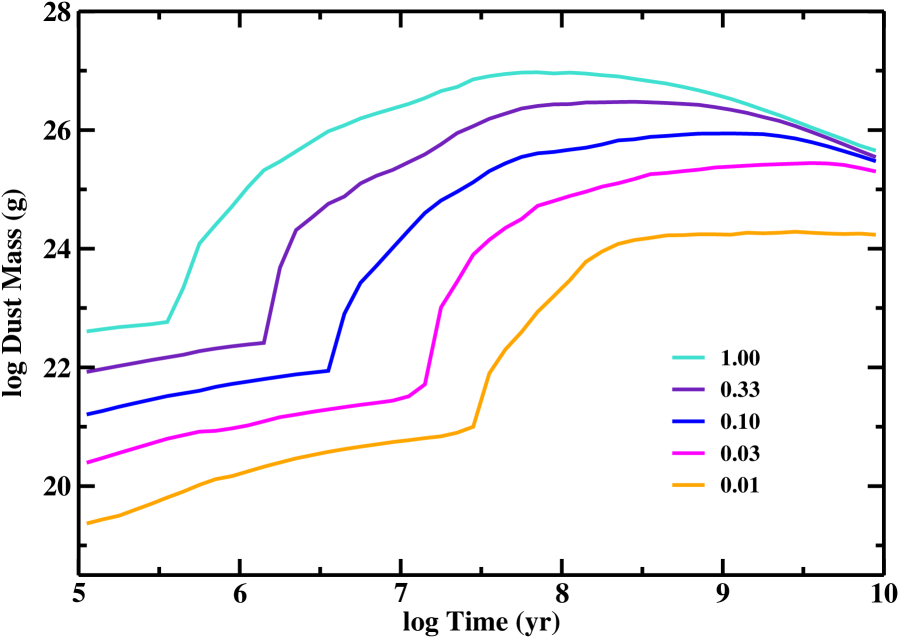
Figure 8 plots the time evolution of the total mass in small grains for disks with . Initially, all annuli slowly produce more and more dust grains. The mass in small grains throughout the disk grows slowly with time. When oligarchic growth begins in the inner disk, the mass in small grains rapidly grows by 1–2 orders of magnitude. As oligarchs form farther and farther out in the disk, the collisions among leftover planetesimals continue to produce small grains more rapidly than other processes remove them. The mass in grains throughout the disk continues to grow. Once the collisional cascade reaches the outer edge of the disk, the overall dust production rate cannot keep up with removal of small grains by collisional erosion or Poynting-Robertson drag. The dust mass begins to decline.
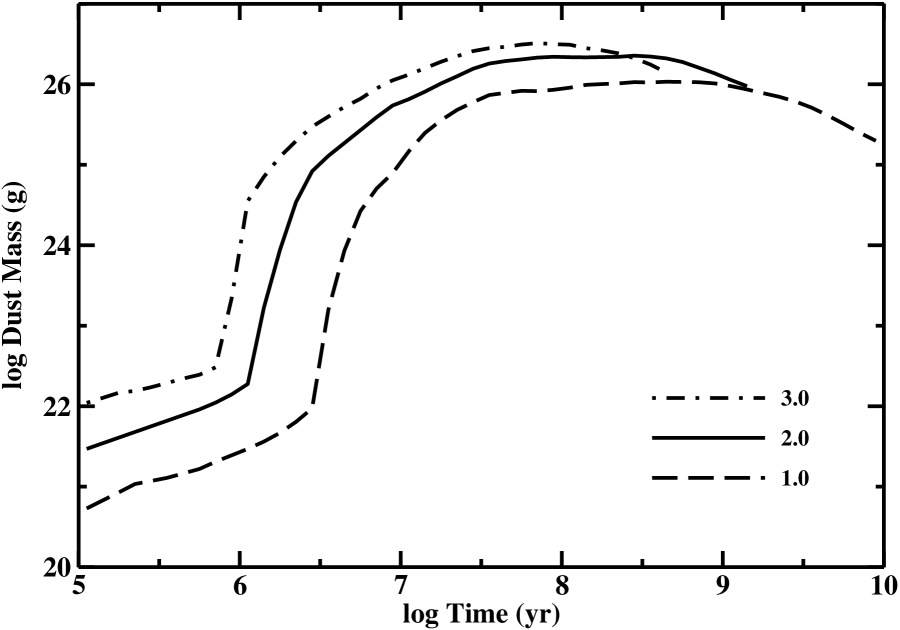
Figure 9 shows the evolution of the total mass in small grains for disks with . As in Figure 8, the dust mass grows slowly during the early stages of the runaway, starts to rise rapidly during the late stages of the runaway, and then reaches a fairly constant plateau throughout oligarchic growth. In both sets of calculations, the maximum mass in small grains is a few lunar masses. This maximum mass scales with disk mass. Together with the results in KB08, we derive a typical maximum mass in small grains
| (16) |
For large grains, the maximum mass is 30–40 times larger,
| (17) |
In both sets of equations, the inter-quartile range for the maximum mass is 10%. Thus, the maximum mass is more sensitive to the fragmentation parameters than stochastic variations in the evolution. Weak planetesimals produce more dust. The amount of dust is less sensitive to the surface density law. For disks with similar total masses, the dust mass produced in disks with relative to that in disks with is 1.4:1 for small grains and 1.2:1 for large grains.
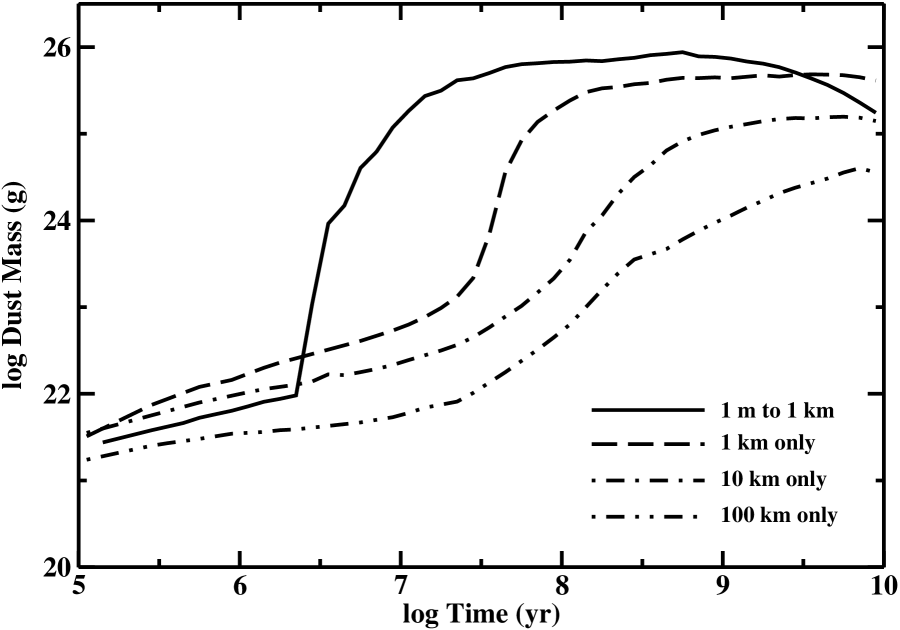
The mass in small and large grains is also very sensitive to the initial sizes of planetesimals in the disk (Figure 10). For disks with g cm-2 and strong planetesimals, an ensemble of 1 m to 1 km planetesimals produces a maximum dust mass of roughly a lunar mass in small grains at = 50 Myr to 1 Gyr. Disks with larger planetesimals produce less dust at later times. For an ensemble of 1 km planetesimals, the maximum dust mass is a factor of 2 smaller and remains at this level from = 100 Myr to = 10 Gyr. However, ensembles of 10 km (100 km) planetesimals produce a factor of 3 (15) less dust for much shorter periods of time.
For the set of calculations starting with a single size planetesimal, we derive dust masses of
| (18) |
for small grains and
| (19) |
for large grains. In both sets of equations, the inter-quartile range in the maximum mass is 10%.
Calculations starting with small planetesimals produce dust masses consistent with those observed in debris disks. The mass in dust grains detected in the most luminous debris disks around solar-type main sequence stars is roughly a lunar mass throughout the stellar lifetime. For our adopted surface density laws, disks with 1 km (or smaller) planetesimals and either 0.1 () or 1 () yield a lunar mass in small grains for a large fraction of the stellar lifetime. Disks with 10 km or larger planetesimals produce less than 0.2 lunar masses of small grains late in the main sequence lifetime of the central star.
3.2 Icy Planet Formation Around 1.5–3 M⊙ Stars
Stellar mass is an important aspect of icy planet formation. With (§3.1.1), the formation timescale at fixed is . In disks with identical surface density distributions, planets grow more rapidly around more massive stars (KB08). In our models, the surface density of solids scales with the stellar mass as . The growth time for icy planets at fixed is then . Thus, icy planets form 3 times more rapidly around 2 M⊙ stars than around 1 M⊙ stars.
Despite this rapid growth, the collisional cascade is more efficient around lower mass stars (see also KB08). The steep relation between the main sequence lifetime and the stellar mass, with = 3–3.5 (Iben, 1967; Demarque et al., 2004), allows collisions relatively more time to destroy leftover planetesimals around low mass stars than around more massive stars. Thus, disks around solar-type stars lose a larger fraction of their initial mass and have fewer leftover planetesimals than their equal mass counterparts around more massive stars.
3.2.1 Growth of Large Objects
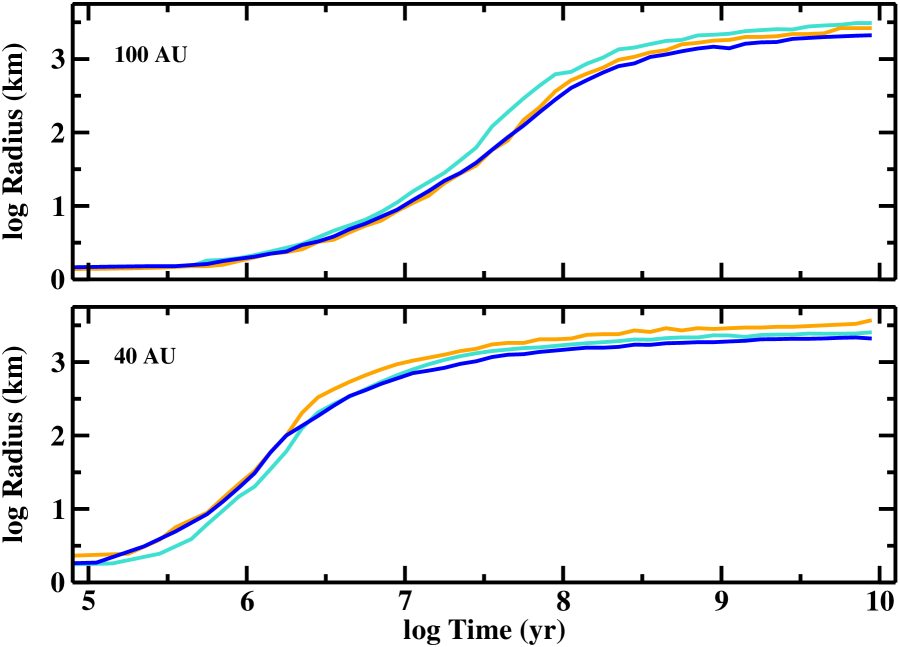
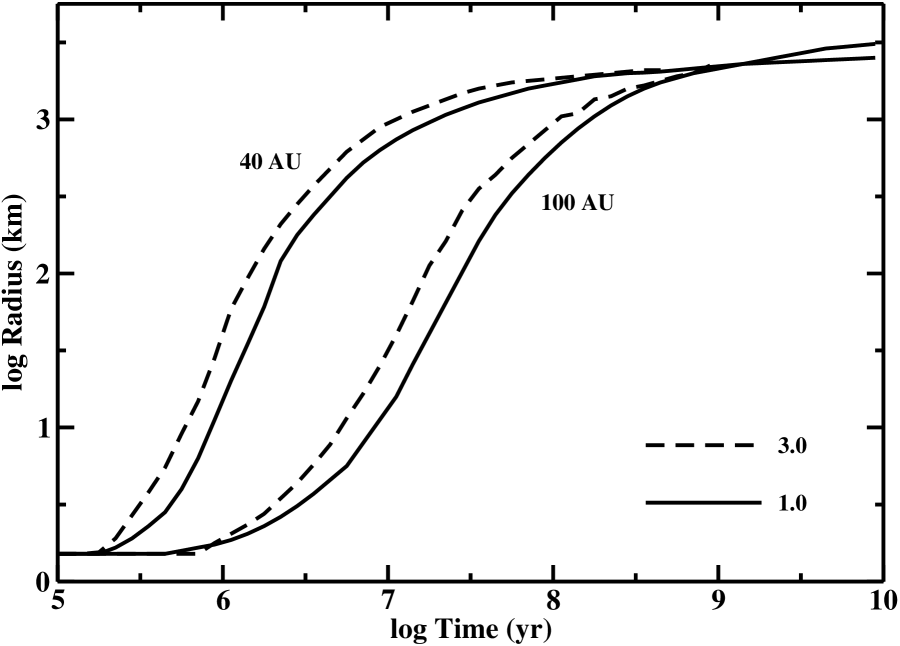
To illustrate these points, we begin with the growth of large objects at 40 AU and at 100 AU around 1 M⊙ and 3 M⊙ stars. For all stellar masses, the largest objects in an ensemble of 1 m to 1 km planetesimals at 30–150 AU grow slowly to sizes of 5–10 km, experience a short phase of runaway growth to sizes of 300–500 km, and then enter a long phase of oligarchic growth. During oligarchic growth, icy planets approach sizes of 2000–3000 km. Figure 11 shows the evolution of the size of the largest object in disks with identical surface density distributions, g cm-2, around 1 M⊙ and 3 M⊙ stars. In these disks, slow growth lasts 1 Myr at 40 AU and 10 Myr at 100 AU. Thus, the growth rate derived in §3.1.1, is preserved in disks around more massive stars. Although the maximum radius of icy planets is roughly independent of stellar mass in Figure 11, the plot also demonstrates that planets grow roughly 1.7 times faster around 3 M⊙ stars than around 1 M⊙ stars. This result confirms the expected scaling of growth time with stellar mass.
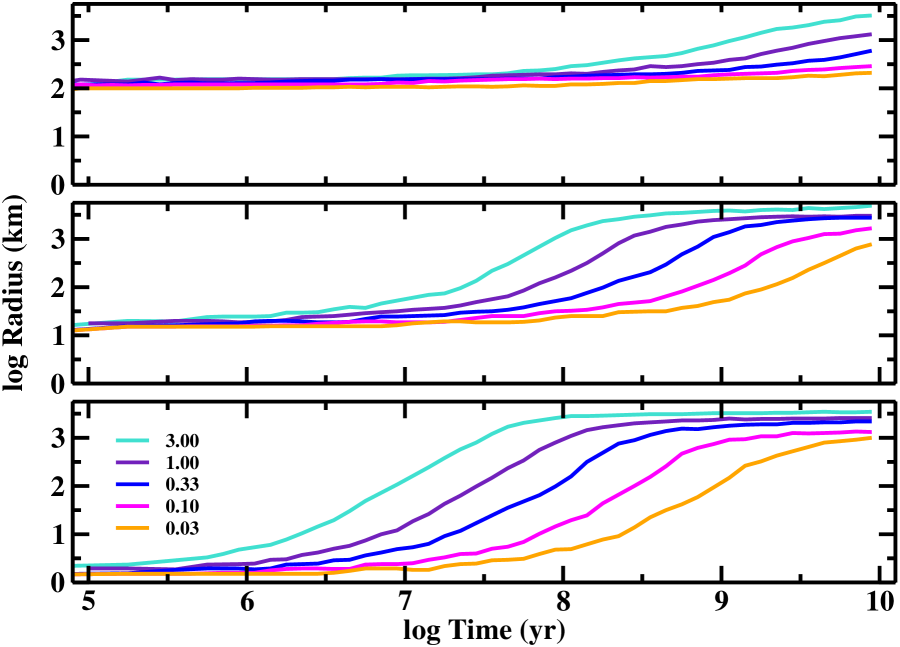
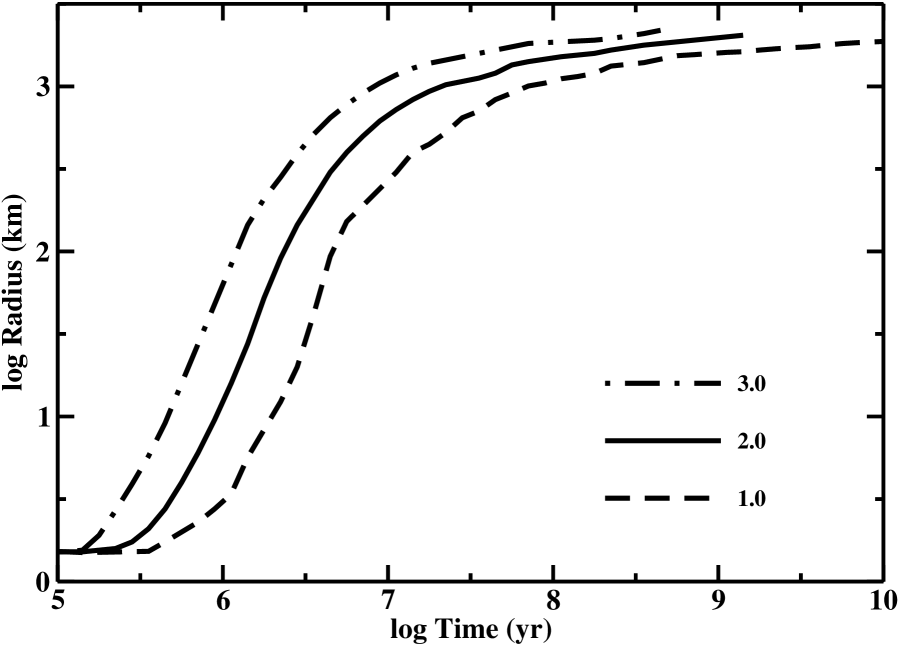
Figure 12 extends these conclusions for disks with scaled surface density distributions. In disks with 0.1, slow and runaway growth produce 300 km objects in 3–10 Myr around 1–3 M⊙ stars. During oligarchic growth, the largest objects slowly approach sizes of 2000 km. The growth time clearly decreases around more massive stars. Compared to the timescale for 1 M⊙ stars, planets form roughly 3 times more rapidly around 2 M⊙ stars and roughly 5 times more rapidly around 3 M⊙ stars. These rates confirm our expectation of .
To quantify these general conclusions, we measure and in every annulus as a function of input parameters. To derive the best-fitting exponents of equation (6) for the growth time, we use least-squares fits. Although our results for the maximum radius of icy planets depend on the initial disk mass (), is independent of semimajor axis and stellar mass. Thus, we derive a simple scaling law between and . For calculations with an ensemble of 1 m to 1 km planetesimals, the third and fourth rows of Table 3 list our results.
Our expressions for and in disks around 1.5–3 M⊙ stars agree with our results for 1 M⊙ stars. When planetesimals are weak, the collisional cascade starts to destroy leftover planetesimals when oligarchs are relatively small. With less material to accrete, oligarchs take longer to reach sizes of 1000 km and fail to reach sizes of 2000 km. When planetesimals are strong, the cascade begins to remove planetesimals when oligarchs are larger. These oligarchs have more material to accrete, reach sizes of 1000 km much faster, and can then grow to sizes exceeding 2000 km.
For any adopted planetesimal strength, the maximum radius scales with the initial surface density and is independent of stellar mass and semimajor axis. In disks with identical masses, calculations with or yield the same . Our results suggest that the most massive disks produce icy planets with 3500 km. Thus, the most massive icy planets have masses of 0.04 M⊕, 15 times the mass of Eris, the most massive Kuiper belt object in the Solar System (Brown & Schaller, 2007).
The relations for and depend on the initial size distribution of planetesimals. The first and second rows of Table 4 list our results for calculations with 1 km (column 1), 10 km (column 2) and 100 km (column 3) planetesimals and the fragmentation parameters. Although the growth of planets from planetesimals with a single size is much slower than with a range of initial planetesimal sizes, planets still grow faster around more massive stars. Because the growth time is longer than the gas dissipation time, gas drag is less important. Thus, the growth time is less sensitive to the initial surface density and more sensitive to the initial semimajor axis.
Independent of stellar mass, calculations with larger planetesimals produce larger planets. For 1, 10, and 100 km planetesimals, the maximum radii of icy planets increase from 5500 km to 7500 km to 11,500 km. The masses of these planets range from 0.17 M⊕ to 1.5 M⊕.
Although planets form faster in disks around more massive stars, disks around lower mass stars generally produce planets more efficiently. To demonstrate this point, we consider the formation of 1000 km objects – which we call ‘Plutos’ – as a function of semimajor axis and stellar mass. For each set of calculations in our study, Tables 5–10 list the median number of Plutos as a function of , , and . For simplicity, we report in bins of semimajor axis; the width of each bin is .
Throughout the disk, Pluto production correlates with initial disk mass. For disks with 1–10, correlates with . In the most massive disks, hundreds of Plutos form throughout the disk. In lower mass disks, Plutos are concentrated in the inner disk.
Pluto production is also a strong function of the fragmentation parameters. For disks with similar masses, calculations with strong planetesimals produce roughly 3 times as many Plutos as calculations with weak planetesimals. In calculations with weak planetesimals, Pluto formation is restricted to the inner regions of the most massive disks.
Plutos also form more efficiently in disks with small planetesimals and in disks with a range of planetesimal sizes. The inner regions of very massive disks composed only of 100 km planetesimals produce the most Plutos. However, the efficiency drops to zero in the outer disk and for all semimajor axes of lower mass disks. Thus, most disks with only 10–100 km planetesimals produce no Plutos. Disks with 1 km or smaller planetesimals almost always produce at least one Pluto and often produce Plutos throughout the disk.
These results demonstrate that icy planet formation at 30–150 AU is inefficient. In the most massive disks composed of 100 km planetesimals, objects larger than 1000 km contain 10% to 25% of the initial solid mass at 30–35 AU. This fraction drops to less than 2% at 50 AU and to less than 0.1% at 60–70 AU. For planetesimal sizes of 1–100 km, the percentage of initial mass in 1000 km objects falls by roughly a factor of two for every factor of 10 reduction in the initial size of planetesimals. These fractions are fairly independent of the stellar mass. The ensemble of icy planets around 1 M⊙ stars is 25% more massive than ensembles around 2–3 M⊙ stars. However, the mass fraction in 1000 km objects is very sensitive to the initial surface density. At 50–100 AU, our results suggest factors of 2–3 reduction in the mass fraction of 1000 km objects for every order of magnitude reduction in initial surface density.
3.2.2 Evolution of Dust
The evolution of dusty debris disks around 1.5–3 M⊙ stars generally follows the evolution for 1 M⊙ stars. During the late stages of runaway growth and the early stages of oligarchic growth, stirring leads to a collisional cascade that grinds leftover planetesimals into dust grains. Runaway and oligarchic growth produce large planets around more massive stars faster than around lower mass stars. Thus, debris disks form first around more massive stars. Our scaling of the initial disk mass with the stellar mass leads to larger dust production rates and larger dust masses around more massive stars. Lower mass stars live longer than more massive stars. Over the main sequence lifetime of the central star, lower mass stars produce more dust. We will consider whether larger dust masses produce brighter debris disks in §4. In this section, we show how dust production rates and total dust masses depend on stellar mass and the properties of planetesimals.
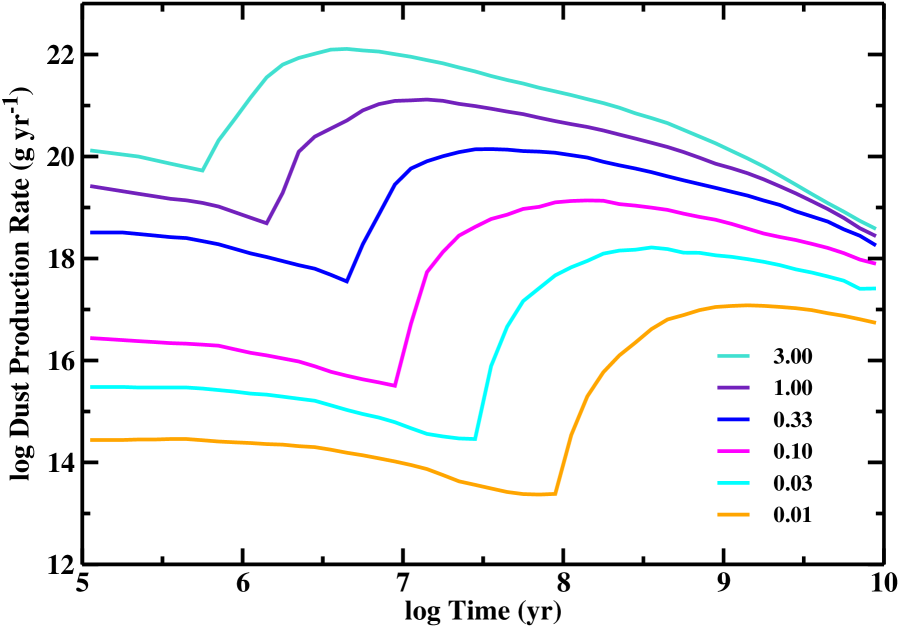
Figure 13 compares productions rates of very small grains for disks with g cm-2 around 1–3 M⊙ stars. Initially, the higher mass disks around more massive stars have larger dust production rates. During runaway growth, dust production declines. Although the dust production rates decline fastest around more massive stars, disks with roughly similar masses reach similar minimum dust production rates. During the transition from runaway growth to oligarchic growth, the dust production rates increase. This transition occurs earlier in disks around more massive stars. The larger initial disk masses around more massive stars also lead to larger peak dust production rates at earlier times. Following the peak, dust production declines by more than an order of magnitude by the end of the main sequence lifetime of the central star.
Figure 14 repeats Figure 13 for disks with weak planetesimals and g cm-2. During runaway growth, the dust production rate declines less than the rates for disks with shallower surface density distributions (compare with Figure 13). Once oligarchic growth begins, however, the dust production rate evolves as in Figure 13. More massive disks reach larger dust production rates sooner than lower mass disks. After reaching peak dust production, the rates decline by 1–2 orders of magnitude before the central star evolves off the main sequence.
The variation of dust production rate with the fragmentation parameters and the initial sizes of planetesimals follows the results for 1 M⊙ stars. For our two sets of fragmentation parameters, weak planetesimals produce twice as much dust roughly 10% earlier than strong planetesimals. However, dust production is much more sensitive to the initial planetesimal size. For the strong fragmentation parameters, disks with an ensemble of 1 m to 1 km planetesimals produce dust at four times the rate of disks with only 1 km planetesimals. Calculations with the large range of planetesimal sizes also reach peak dust production nearly 10 times sooner than those with only 1 km planetesimals. These differences grow with increasing planetesimal size. Compared to the calculations with 1 m to 1 km planetesimals, dust production rates for ensembles of 10 km (100 km) planetesimals are roughly 20 times (200 times) smaller and occur 50 times (500 times) later.
The fifth and sixth rows of Table 3 and the third and fourth rows of Table 4 summarize our scaling relations for the time and magnitude of peak dust production. The time of peak dust production depends on the growth time, which scales inversely with disk mass and as (§3.1.1). The dust production rate depends on the number of collisions, which scales with the square of the disk mass and (KB08). In these relations, the inter-quartile range is 5% to 10%.
Figure 15 illustrates the time variation of the mass in small dust grains for disks with initial g cm-2 surrounding 1–3 M⊙ stars. The dust mass grows slowly throughout runaway growth, increases dramatically during the transition from runaway to oligarchic growth, slowly reaches a plateau, and then declines with time. During the slow rise in dust mass, collisions fragment small grains into very small grains. Radiation pressure rapidly ejects these very small grains. As the dust mass reaches maximum, Poynting-Robertson drag starts to remove small grains more and more rapidly. From this point on, Poynting-Robertson drag removes more material from the disk than radiation pressure. Disks around more massive stars pass through this sequence more rapidly than disks around lower mass stars. Disks around more massive stars also have larger dust masses.
Figure 15 also shows the impact of stellar evolution on the dust masses. Although more massive stars reach peak dust masses earlier, the central star evolves off the main sequence before the dust mass declines significantly. Thus, older disks around more massive stars have much more dust than older disks around less massive stars.
Figure 16 repeats Figure 15 for disks with weak planetesimals and initial surface density g cm-2. Throughout the evolution, disks with weak planetesimals have larger dust masses than disks with strong planetesimals. For our set of fragmentation parameters, the difference in peak dust mass is 50% for small grains and 25% for large grains.
The dust masses in our debris disks are also sensitive to the initial mass distribution of planetesimals. For the parameters, the dust mass is roughly inversely proportional to the maximum initial size of planetesimals. For fixed initial disk mass, calculations with an ensemble of 1 m to 1 km planetesimals produce the largest dust masses; calculations with 100 km planetesimals yield the smallest dust masses.
The seventh and eighth rows of Table 3 and the fifth and sixth rows of Table 4 summarize our scaling relations for the masses in small and large grains. All dust masses scale with the initial disk mass. For massive disks with 1 and small planetesimals, the mass in small grains is roughly a lunar mass. This mass drops to 0.03–0.3 lunar masses for calculations with larger (10 km to 100 km planetesimals).
3.3 Highlights of Icy Planet Formation at 30–150 AU
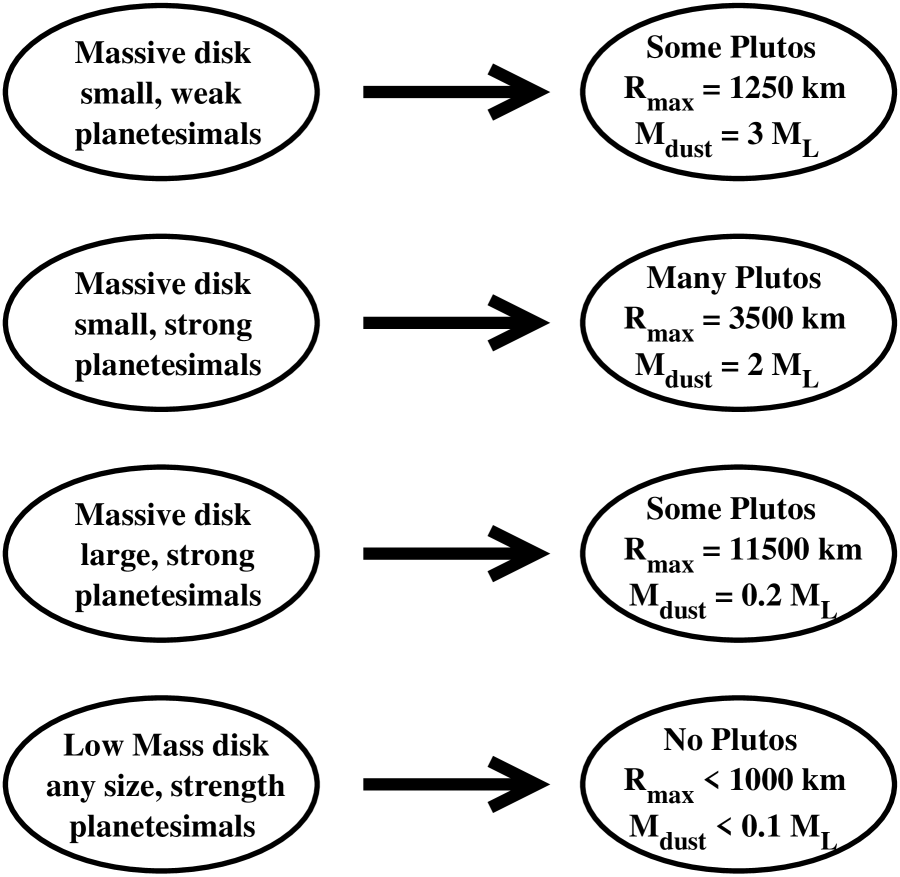
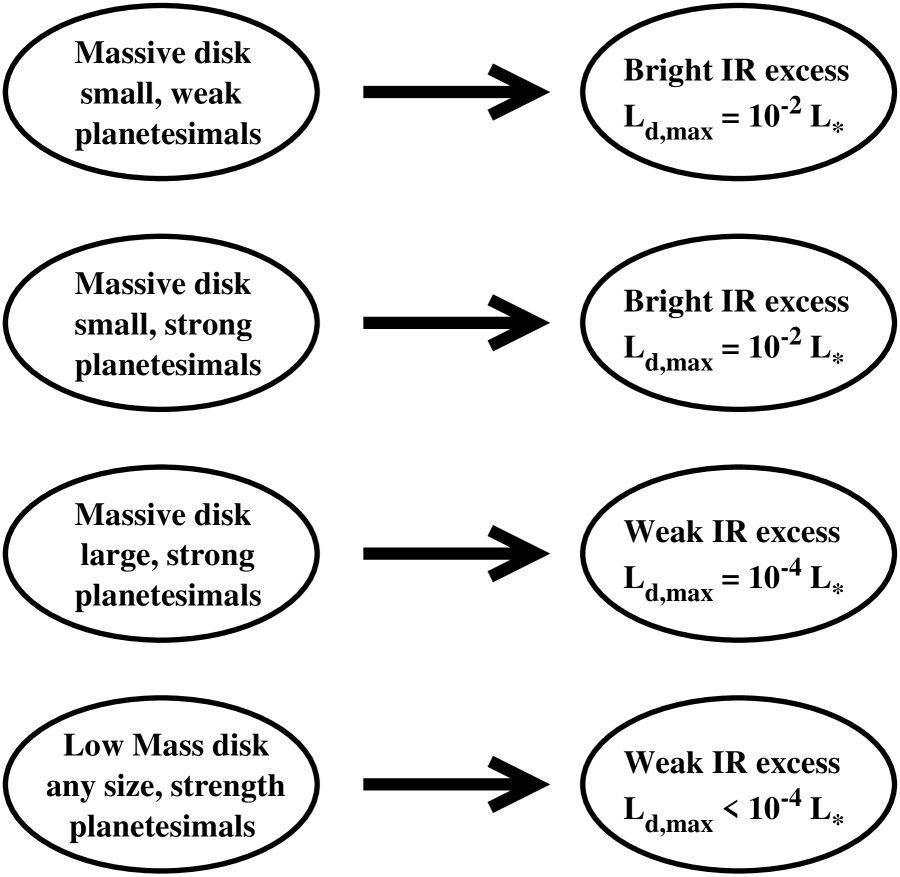
In KB08, we highlighted the six main features of icy planet formation in disks composed of 1 km planetesimals at 30–150 AU around 1–3 M⊙ stars. To include conclusions based on our new calculations, we expand on these features here. Figure 17 is a schematic summary of these highlights.
-
1.
Following a short period of slow growth, runaway growth produces an ensemble of oligarchs with radii of 500–1000 km. The timescale to produce oligarchs scales inversely with the initial surface density and with the initial radii of planetesimals. Throughout runaway growth, oligarchs stir up the orbits of leftover planetesimals. Stirring reduces gravitational focusing factors and ends runaway growth.
-
2.
Icy planet formation at 30–150 AU is self-limiting. In calculations with small planetesimals, the collisional cascade removes leftovers faster than oligarchs can accrete them. In disks with larger planetesimals, the collisional cascade is not effective; however, the central star often evolves off the main sequence before oligarchs reach very large radii. In both cases, the largest icy planets slowly reach a characteristic maximum radius which is independent of stellar mass. This maximum radius depends on the initial sizes of the planetesimals. For ensembles of 1 m to 1 km planetesimals, the maximum radius is 3500 km. This maximum radius grows with the maximum initial radius of planetesimals. The largest planets – km – form out of 100 km planetesimals. The maximum radius of an icy planet and the timescale to reach this radius also depend on the initial mass of solids in the disk. More massive disks make more massive planets more rapidly. Although the maximum radius of a planet is less sensitive to the fragmentation parameters, weaker planetesimals produce smaller planets. Tables 3–4 list the scaling relations for maximum radius and formation time as a function of initial disk mass and the mass of the central star.
-
3.
As planets grow slowly, a collisional cascade grinds leftovers to dust. Early on, radiation pressure ejects very small grains in an outflowing wind. Later, Poynting-Robertson drag also removes larger grains from the disk. In our calculations, radiation pressure removes at least twice as much mass from the disk as Poynting-Robertson drag. When an annulus is massive, radiation pressure dominates mass removal. As the mass in an annulus declines, Poynting-Robertson drag removes a larger and larger fraction of the mass. The timescale for the collisional cascade to remove leftover planetesimals is close to the main sequence lifetime of the central star. Thus, the cascade removes more material from the inner disk than from the outer disk. Efficient collisional cascades require small planetesimals. Thus, ensembles of large planetesimals lose less mass than ensembles of small planetesimals.
-
4.
Icy planet formation is inefficient. Independent of the fragmentation parameters, only 1% to 10% of the initial mass in solids ends up in objects with radii of 1000 km or larger. Objects with radii larger than 100 km contain from 2% to 100% of the initial mass in solids. The efficiency of planet formation correlates with the initial radii of planetesimals. In ensembles of 1, 10, or 100 km planetesimals, objects with radii exceeding 1000 km contain less than 1%, 3%, or 10% of the initial mass in solids. Only the inner regions of the most massive disks reach these levels. In the outer regions of all disks and the inner regions of low mass disks, the largest objects have radii smaller than 1000 km.
-
5.
In nearly all disks, the collisional cascade produces an observable amount of dust. The outflowing winds of small particles are observable in the most massive disks. The amount of debris scales inversely with the initial sizes of planetesimals. At 30–150 AU, the mass in 1 m to 1 mm particles is 0.01–3 lunar masses for disks with = 0.01–3 (Figures 8–10 and 15–16). The dust masses in luminous debris disks around A-type and G-type stars typically exceed 0.1 lunar masses. Our results suggest that the amount of dust rises from 1–10 Myr, maintains a roughly constant level for 10–100 Myr, and then slowly declines until the central star evolves off the main sequence.
-
6.
Even with large planetesimals, dusty debris is a signpost of the formation of a planetary system. This debris is present throughout the lifetime of the central star.
4 DEBRIS DISK EVOLUTION
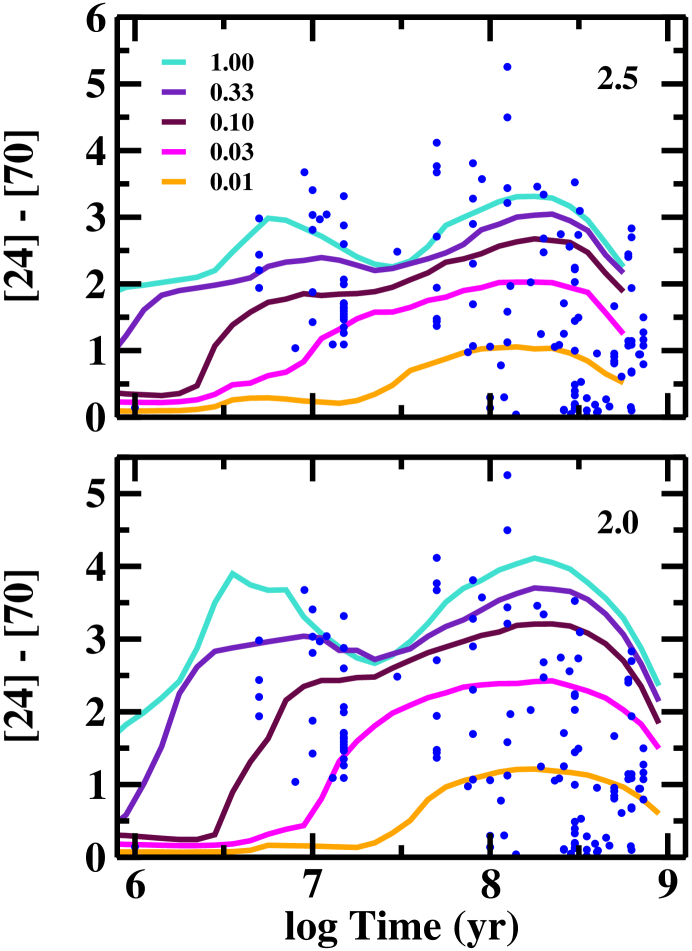
As in KB08, we convert model size distributions of dust grains, planetesimals, and planets into observable quantities. For each evolution time , we calculate the stellar luminosity and effective temperature from the Y2 stellar evolution models (Demarque et al., 2004). We adopt standard values for the smallest stable grain size ( = 1 m) and the slope ( = 1) of the emissivity law for small grains (see also Burns, Lamy, & Soter, 1979; Artymowicz, 1988; Kimura et al., 2002; Najita & Williams, 2005; Williams & Andrews, 2006). Using a simple radiative transfer code, we then compute the radial optical depth in each annulus of the model grid. The optical depth allows us to compute the fraction of absorbed by grains in each annulus. For each grain size in each annulus, we calculate the equilibrium grain temperature and an emitted spectrum. Summing the spectra over and yields the predicted spectral energy distribution (SED) and the total dust luminosity as a function of time. KB08 and Kenyon & Bromley (2004b) describe this calculation in more detail.
To describe the time evolution of observable quantities, we focus on and the excesses at IR and submm wavelengths. The fractional dust luminosity measures the relative luminosity of the debris disk. For excesses at specific wavelengths, we quote the total emission of the disk and the central star relative to the emission from the stellar photosphere, . With this definition, disks that produce no excess have = 1; disks where the excess emission is comparable to the emission from the central star have = 2.
We begin this section with a discussion of excess emission for 1 M⊙ stars. After discussing results for 1.5–3 M⊙ stars, we conclude this section with a brief summary. To facilitate comparisons of our results with observations, Tables 11–22 list results for the fractional dust luminosity and excesses at 24–850 m. The paper version lists the first five lines of results for = 0.01, 0.1, and 1. The electronic version includes all results for these .
4.1 Evolution for 1 M⊙ Stars
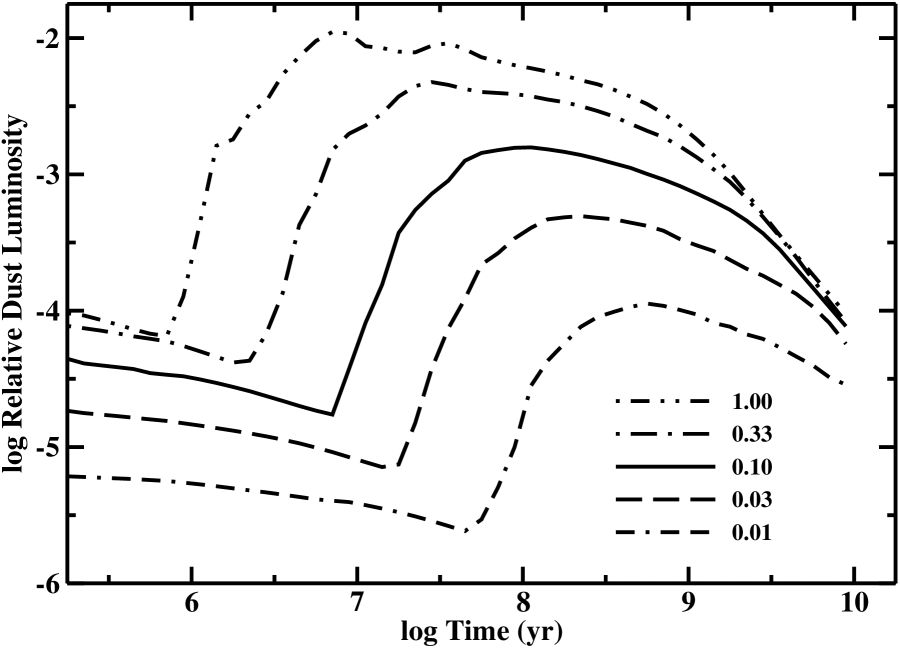
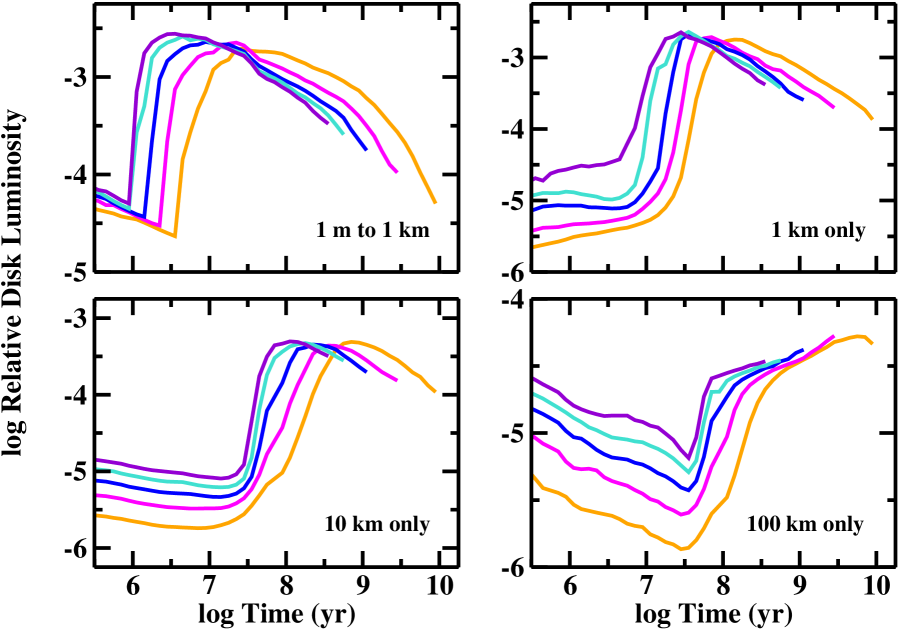
Figure 18 shows the evolution of for disks with an initial surface density and the fragmentation parameters. Early in the evolution, growth produces larger objects and little debris. Larger objects have a smaller surface area per unit mass. The opacity and decline with time. Less massive disks have smaller dust masses and smaller . Planetesimals in less massive disks also grow more slowly (§3). The decline of with time lasts longest in the lowest mass disks.
As oligarchic growth begins, increases by 1.5–2 orders of magnitude in 10–500 Myr. Disks reach peak luminosities early in the oligarchic growth phase. More massive disks reach larger peak dust luminosities earlier than less massive disks. Throughout oligarchic growth, debris production slowly declines with time. All disks converge to roughly the same dust luminosity, .
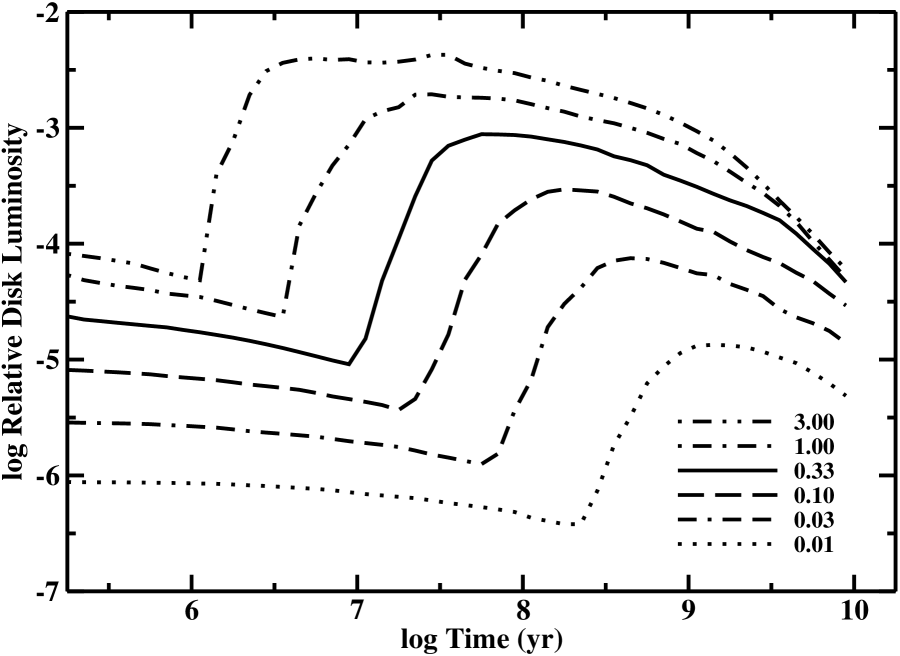
Figure 19 repeats Figure 18 for disks with initial and the fragmentation parameters. These disks follow the same evolution as in Figure 18. Throughout runaway growth, the dust luminosity slowly declines. During the transition from runaway to oligarchic growth, the dust luminosity grows rapidly. After the disk reaches peak luminosity, collisions produce less debris; the luminosity slowly fades with time. At late times, the most massive disks converge on the same . The lowest mass disks evolve more slowly and have a broad range in at = 10 Gyr.
Combined with results for and the fragmentation parameters from KB08, Figures 18 and 19 show that debris disk evolution is remarkably independent of initial conditions. For the three sets of calculations, we derive simple relations between the maximum dust luminosity and the initial disk mass:
| (20) |
The maximum dust luminosity is fairly independent of the surface density law. In our calculations, material in the inner disk at 30 AU produces the largest dust luminosity. In disks with identical at 30 AU, disks with are only 10% more luminous than disks with .
Throughout the cascade, depends on the evolution of the vertical scale height and the radial optical depth of the dust. When 0.25, the emission depends only on the total dust mass. Low mass disks are optically thin; cascades with weaker planetesimals produce more dust. Thus, low mass, optically thin debris disks composed of weak planetesimals are more luminous than low mass, optically thin debris disks composed of strong planetesimals. When 0.25, dust emission depends on and , , where . The vertical scale height is proportional to the escape velocity of the largest objects in an annulus. Disks with larger intercept more flux from the central star. Disks with strong planetesimals produce more massive oligarchs; thus, 1. Although 1 and 1, . Thus, massive, optically thick disks composed of strong planetesimals are brighter than massive, optically thick disks composed of weak planetesimals.
The properties of the planetesimals are important at several phases of the evolution. During runaway growth, all disks are optically thin; disks with weaker planetesimals are brighter. Close to peak luminosity, , with 0.5–0.75; low mass (massive) disks with weaker (stronger) planetesimals are brighter. Because the optical depth is roughly constant with time after peak luminosity, these differences persist for much of the evolution.
The time of maximum dust luminosity is much more sensitive to the input parameters. For our results, we derive
| (21) |
Because weaker planetesimals fragment earlier in oligarchic growth, the dust luminosity peaks earlier. The difference in the time scale, 50 Myr vs. 40 Myr, is comparable to the difference in the time scale of maximum dust production (equation (13)). In both cases, the maximum in occurs a factor of 3.25–3.5 later than the maximum in the dust production rate. Although disks with are 10% more luminous than equal mass disks with (equation (20)), they reach maximum luminosity 15%–20% earlier. In term of total energy emitted by dust, these two features of the evolution approximately cancel. Thus, the total emitted energy is roughly independent of the gradient of the surface density distribution.
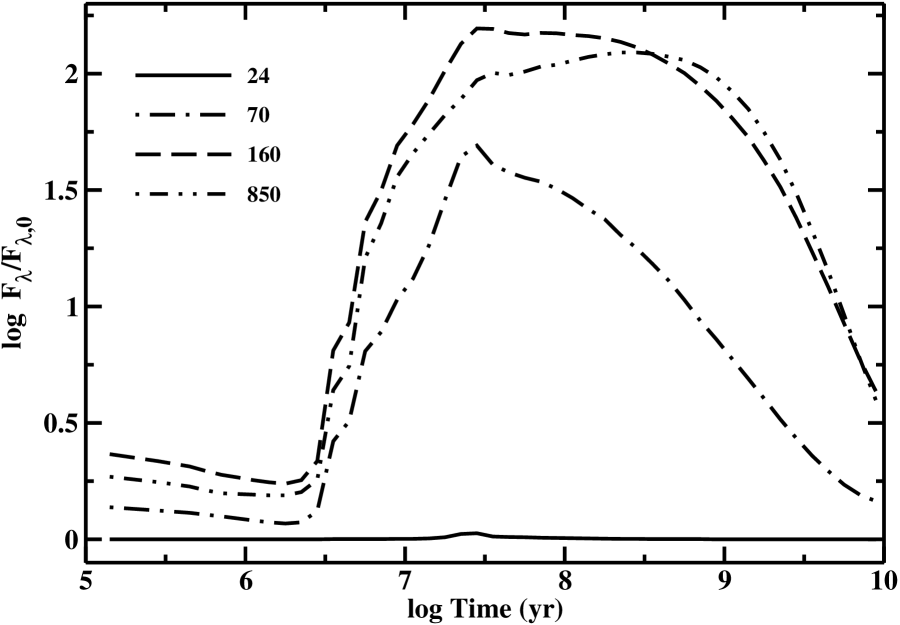
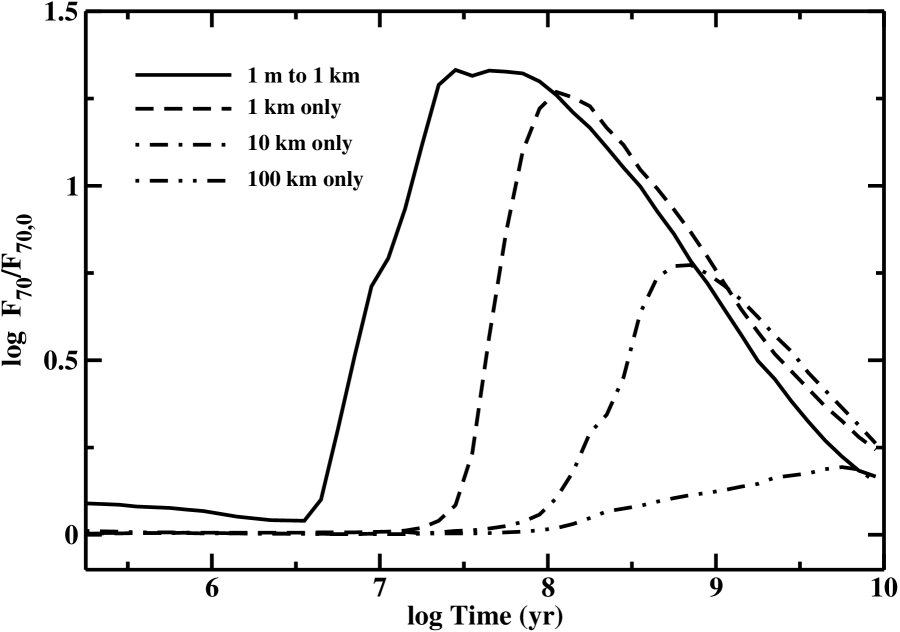
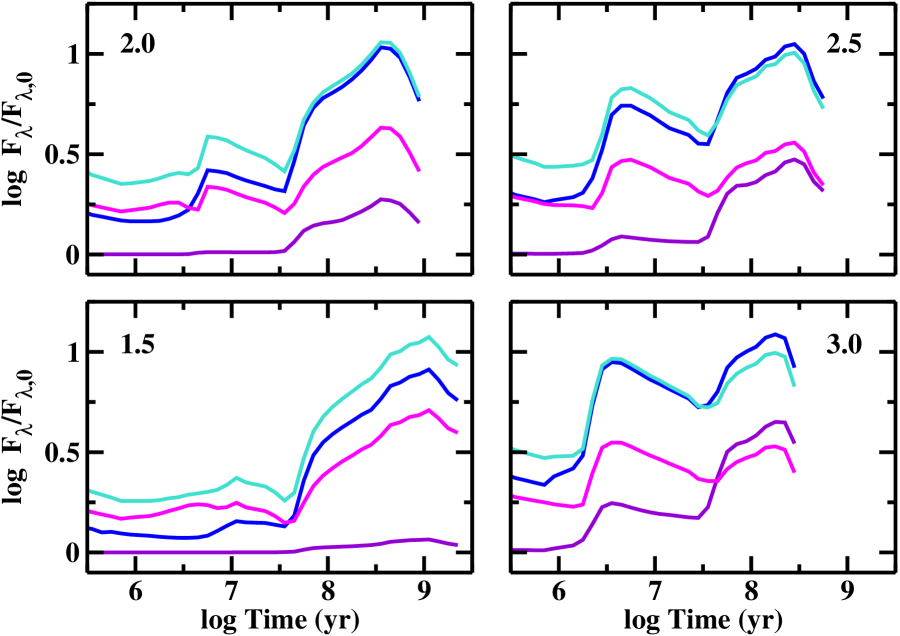
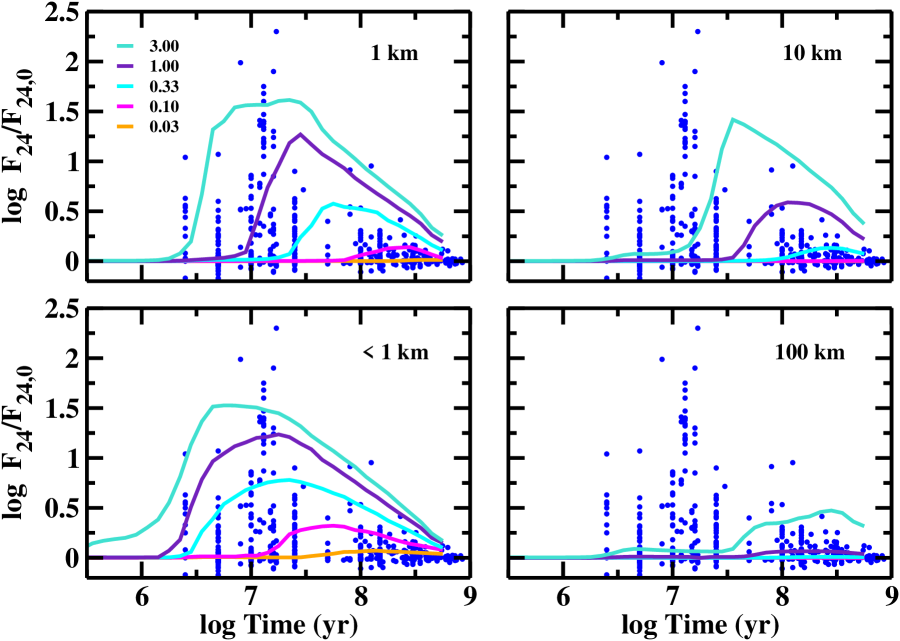
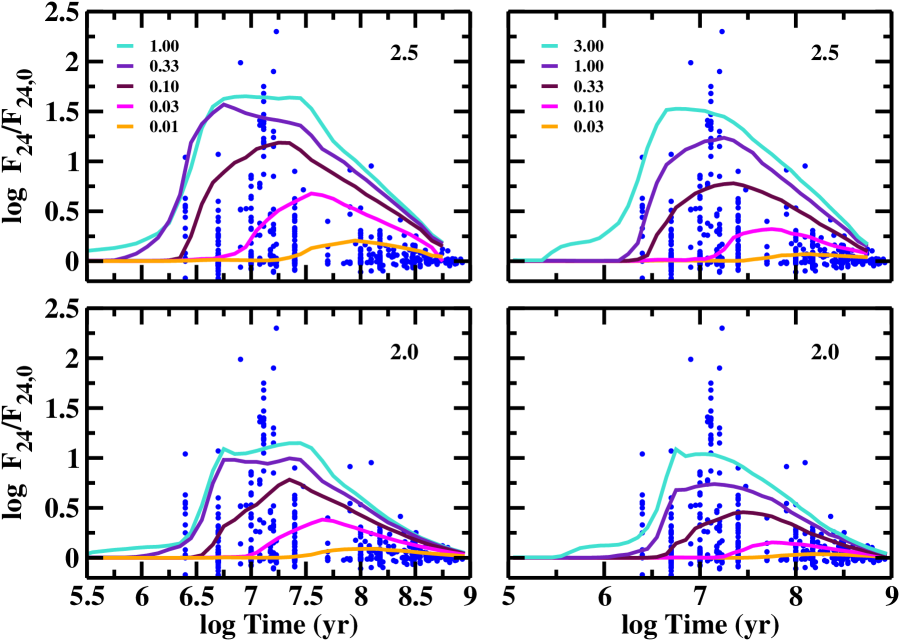
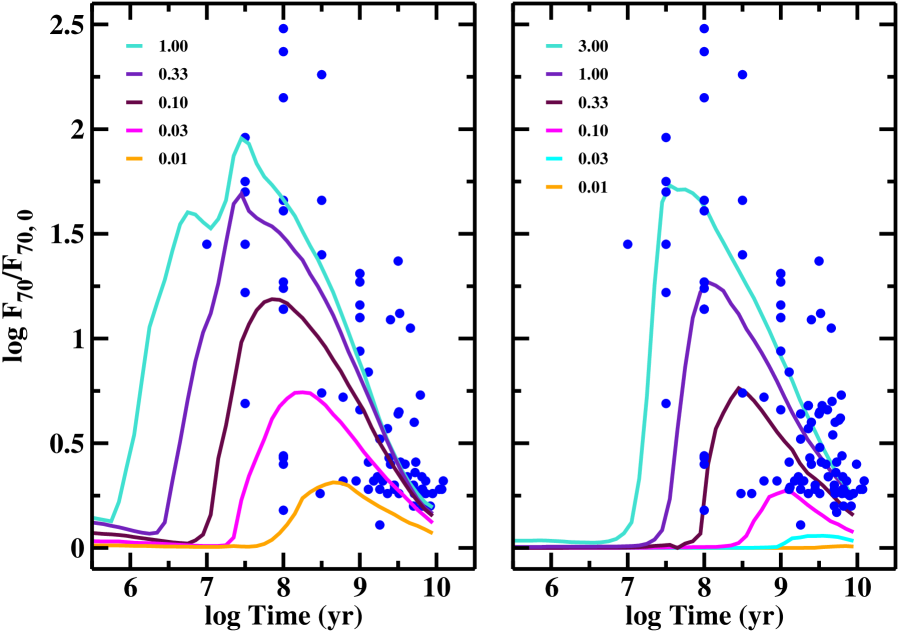
Figure 20 shows the time evolution of the median 24–850 m excesses for disks with initial and = 1/3. For 1 M⊙ stars, disks at 30–150 AU are rarely hot enough to produce observable 24 m emission. Aside from small, 1–3% excesses at 20–50 Myr for the most massive disks, the observed is always 1. At longer wavelengths, the excesses approximately track the evolution of in Figure 18. Hotter disk material close to the central star produces the rapid rise at 70–160 m in Figure 21. Because most of the 70 m emission is produced by grains in the inner disk (30–60 AU), the 70 m excess drops rapidly after the disk reaches peak dust luminosity. At 50–100 AU, cooler material in the middle part of the disk emits most of the 160 m excess; this excess declines more slowly. Dust in the outer disk at 100–150 AU produces most of the 850 m excess; this emission rises slowly and peaks at 300 Myr to 1 Gyr. Once the collisional cascade reaches the outer disk at 1 Gyr, the excess emission declines rapidly at all wavelengths.
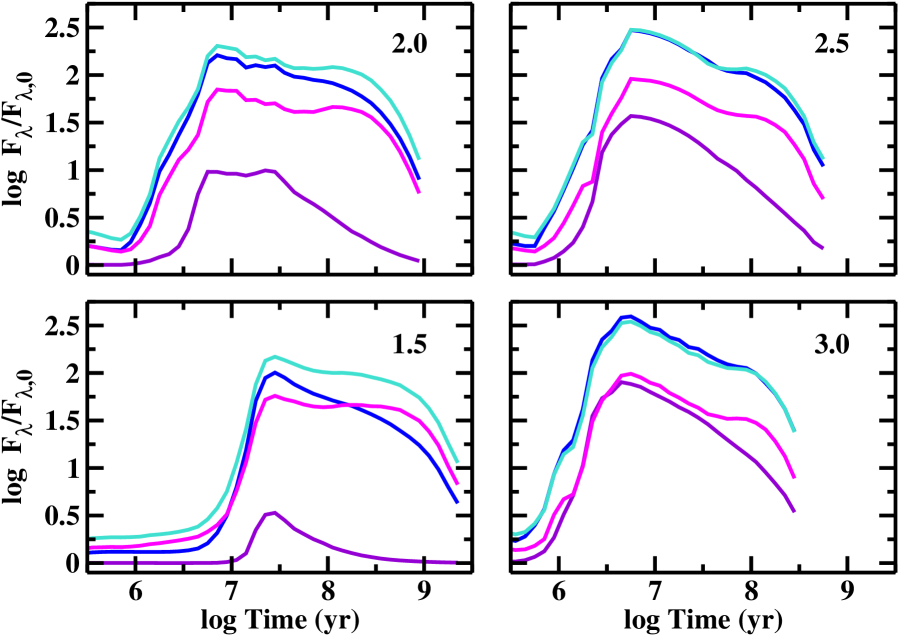
Disks with initial follow the same trends shown in Figure 20. At 850 m, the magnitude of the excess scales with the total disk mass. Disks with similar total masses yield similar excesses at 850 m throughout the main sequence lifetime of the central star. For , disks with (, ) = (1, ) and (3/2, 9) have similar masses ( = 0.01–1; Table 1) and similar evolution at 850 m. At shorter wavelengths, the peak excess and time of maximum excess depend on . Disks with steeper surface density laws have more mass closer to the star. For disks with similar masses, calculations with = 3/2 reach oligarchic growth faster and produce larger 70–160 m excesses than the calculations with = 1 shown in Figure 20.
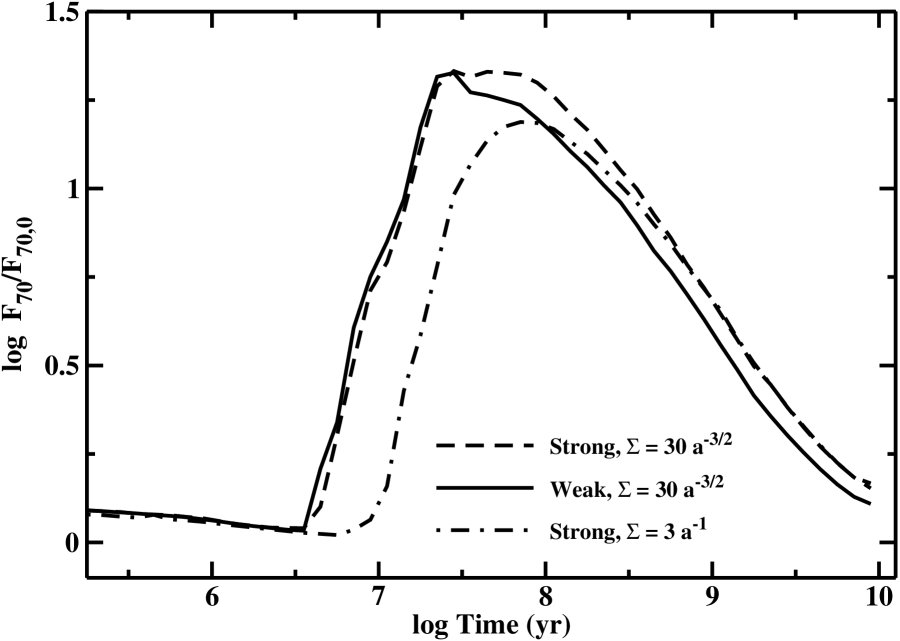
Figure 21 illustrates how IR excesses depend on the initial surface density law and the fragmentation parameters for disks with similar total masses. For disks with , the onset of oligarchic growth is fairly independent of the fragmentation parameters. Calculations with weaker planetesimals reach the collisional cascade somewhat sooner; the 70 m excess rises a little faster for calculations with weaker planetesimals (solid line) than for calculations with stronger planetesimals (dashed line). In disks with , the smaller mass at 30–60 AU leads to a slower rise at 70 m compared to disks with (dot-dashed line). At late times, the entire disk produces 70 m emission. This emission depends on the disk mass and is independent of the radial surface density profile.
As the cascade proceeds, the IR flux depends on the evolution of . In low mass disks, the 70 m flux tracks the disk mass. Thus, low mass disks with weak planetesimals are brighter at 70 m than low mass disks with strong planetesimals. In more massive disks, the dust is optically thick with 1. Oligarchs are roughly a factor of four more massive in disks with strong planetesimals; thus, 2. Cascades with weaker planetesimals produce roughly 50% more dust; 1/3. Combining the two results for disks with strong and weak planetesimals, the peak IR flux is roughly 33% larger in calculations with strong planetesimals. In massive disks, this difference remains for long periods after peak 70 m emission. Despite the larger dust production, the 70 m excess at late times is smaller when planetesimals are weak (compare the solid and dashed lines for log 7.5 in Figure 21).
At late times, the IR excess is independent of the surface density law. Disks with similar total masses and similar strength planetesimals produce oligarchs with the same maximum size (§3.1). These disks also produce similar masses of dust. Because and are similar, these disks produce similar IR excesses at late times (compare the dashed and dot-dashed lines for log 8.5 in Figure 21).
Figure 22 demonstrates that the initial sizes of planetesimals have a larger impact on the IR excess than the fragmentation parameters. In an ensemble of 1 km planetesimals, runaway and oligarchic growth are delayed by a factor of 10–20 relative to growth in an ensemble of 1 m to 1 km planetesimals (§3.1). This delay in oligarchic growth produces a much later rise in the 70 m excess, at 30 Myr instead of 3 Myr. After the delay, the peak dust production rates differ by a factor of three. Thus, calculations with 1 km planetesimals produce smaller IR excesses at later times than calculations with ensembles of 1 m to 1 km planetesimals.
In calculations with 10 km or 100 km planetesimals, this behavior is accentuated. Larger planetesimals take longer to reach oligarchic growth. The rise in the IR excess occurs later and later for larger and larger planetesimals. Calculations with larger planetesimals also produce less debris at the peak of the collisional cascade. The peak IR excess declines as the initial planetesimal size grows.
At late times, calculations with one initial planetesimal size produce larger objects. Because the vertical scale height is proportional to the escape velocity of the largest oligarch, disks with larger planetesimals have larger at late times. For our derived range in maximum oligarch mass (a factor of 8), we expect a factor of 2.8 range in the maximum . In our disks, the range of dust masses at late times (Figure 10) leads to small reductions in the IR excess for calculations with 1 km planetesimals relative to our standard calculation with 1 m to 1 km planetesimals. The small dust masses of calculations with 10 km (100 km) planetesimals leads to factor of three (ten) smaller excesses throughout the evolution.
4.2 Evolution for 1.5–3 M⊙ Stars
Three factors modify the evolution of the dust luminosity and the IR/submm excesses for 1.5–3 M⊙ stars. The luminosities of 1–10 Myr old stars more massive than the Sun grow monotonically with time. Independent of the evolution of the collisional cascade, this pre-main sequence evolution produces modest increases in the excess emission during slow and runaway growth. More massive stars are also more luminous than the Sun. Throughout the collisional cascade, dust grains around massive stars are warmer and emit more short wavelength radiation than grains around less massive stars. More massive stars also evolve faster than the Sun. Because the collision timescale in the disk is less sensitive to stellar mass than the evolutionary timescale of the central star, massive stars have more dust at the end of their lifetimes than lower mass stars (Figs. 15–16). Thus, old, massive stars have relatively larger IR excesses than old, low mass stars.
To illustrate these points, we begin with the time evolution of for disks with around 1–3 M⊙ stars (Figure 23). During runaway growth, the vertical scale height and the dust mass decline. The dust luminosity drops with time. When oligarchic growth and the collisional cascade begin, the dust luminosity increases dramatically. Oligarchs grow faster in more massive disks; the dust luminosity rises earlier in disks around more massive stars. Once the disks reach peak luminosity, the decline roughly follows a power law with = 0.6–0.8 (see also KB08).
The upper left panel of Figure 23 shows that debris disks around more massive stars have somewhat larger peak luminosities than disks around lower mass stars. For disks with , the peak luminosity grows weakly with stellar mass, . Once stars reach ages exceeding 100 Myr, debris disks around less massive stars are more luminous than their coeval counterparts among more massive stars. Among stars in a bound cluster, lower mass stars should have the most luminous debris disks. Once stars reach the end of their main sequence lifetimes, the dust luminosity is more sensitive to stellar mass, with . Among stars with a range of ages in a fixed volume of the Galaxy, most main sequence stars are near the main sequence turn-off. More masive stars should have the most luminous debris disks in this sample.
The remaining panels in the Figure demonstrate that disks with larger planetesimals produce less luminous debris disks. Compared to disks composed of 1 m to 1 km planetesimals, disks with 1 km planetesimals have lower luminosities during runaway growth and comparable luminosities at the peak and throughout the decline (upper right panel). However, the peak luminosity is a factor of 5–10 later in time. As the initial size of the planetesimals increases, peak luminosities are smaller and occur much later in time. For 10 km planetesimals (lower left panel), the maximum values for are a factor of 4 smaller. Debris disks produced from ensembles of 100 km planetesimals (lower right panel) are a factor of 10–50 fainter. Most of these disks cannot reach their peak luminosity before the central star evolves off the main sequence.
Figure 24 shows the evolution of the IR excesses at several wavelengths for disks with initial g cm-2 around 1.5–3 M⊙ stars. The time evolution of IR emission follows the time evolution of planet formation. Planets form more rapidly around more massive stars; IR emission peaks earlier in disks around more massive stars. For disks with comparable total masses, more massive, more luminous stars have warmer dust grains and larger 24 m excesses (indigo curves). Nearly all of the 24 m emission is produced in the inner disk; this emission declines more rapidly than emission at longer wavelengths. For 1.5 M⊙ stars, most of the 70 m emission also comes from the inner disk and declines more rapidly than emission at 160–850 m. For more massive stars, 70–850 m emission is produced throughout the disk. With typical disk temperatures of 20–50 K, emission at 70–160 m is brighter than emission at 850 m. The 70–160 m emission grows slowly with stellar mass; emission at 850 m is independent of stellar mass. Finally, more massive stars evolve off the main sequence sooner than lower mass stars. More massive stars have larger far-IR excesses at the ends of their main sequence lifetimes than lower mass stars.
To explore the impact of stellar evolution in more detail, Figure 25 shows an expanded view of the pre-main sequence evolution of the 24 m flux for disks with around 3 M⊙ stars. In the Y2 models, the luminosity of a 3 M⊙ star increases by a factor of 3–4 during the first 3–4 Myr of the evolutionary sequence. Although declines by a factor of two as the star approaches the main sequence, the change in luminosity increases the grain temperature by 30% to 40% throughout the disk. For low mass stars with = 0.03-0.1, this evolution produces modest, 1%–4%, increases in the IR excess at 2–4 Myr (solid and dashed lines in the Figure). Once the star reaches the main sequence, the IR excess declines until the collisional cascade initiates a rapid and much larger rise in the amount of debris. For more massive disks (dot-dashed line in the Figure), the large rise in emission from debris coincides (and sometimes precedes) the small rise in emission from stellar evolution.
As the initial sizes of planetesimals increases, the collisional cascade produces smaller infrared excesses. For disks with 100 km planetesimals (Figure 26), the time evolution of the debris consists of four distinct phases. During the first 1–2 Myr, viscous stirring excites planetesimals to large velocities. Collisions produce debris and modest IR excesses at all wavelengths. As the central star approaches the main sequence, temperatures rise throughout the disk. Infrared excesses rise. Once the star is on the main sequence, runaway growth leads to a smaller dust production rate. The infrared excesses slowly decline. As systems make the transition from runaway growth to oligarchic growth, the collisional cascade begins to produce copious amounts of dust. The IR excesses then rise considerably.
For disks with 100 km planetesimals, stellar evolution produces measurable infrared excesses for 2–3 M⊙ stars. The excess is largest at 70–160 m and smallest at 24 m. The amplitude of the rise in the excess grows with stellar mass (Figure 26). Disks with 10 km and smaller planetesimals produce little dust at early times. Thus, the rise in the excess from stellar evolution is a few percent or less in these systems.
In Tables 23–24, we quantify the general conclusions from Figures 18–26. Table 23 lists the scaling relations for debris disks produced from ensembles of 1 m to 1 km planetesimals. Rows (1) and (2) list the fragmentation parameters and the surface density law. Rows (3) and (4) list the maximum dust luminosity and the timescale to reach this luminosity as a function of disk mass and stellar mass. Aside from a weak dependence of dust luminosity on for weak planetesimals, the maximum dust luminosity depends only on the initial mass in solids. The time to reach the peak luminosity scales with disk mass and stellar mass.
The remaining rows of Table 23 list the scaling relations for the maximum excesses at 24–850 m. All of the excesses depend on the initial disk mass. The collisional cascade produces more debris in more massive disks. Thus, more massive disks have larger IR excesses. Because wavelengths at 24–70 m are usually on the Wien side of the disk spectral energy distribution, excesses at these wavelengths are more sensitive to the stellar luminosity. At longer wavelengths, the stellar luminosity plays a more modest role in the magnitude of the IR excess.
Table 24 lists scaling relations for debris disks produced from ensembles of 1 km (column (2)), 10 km (column (3)), and 100 km (column(4)) planetesimals. For calculations with 1 km planetesimals, the properties of the debris are similar to those derived from ensembles of 1 m to 1 km planetesimals. However, the time to reach maximum debris disk fluxes is a factor of 5 longer. As the maximum initial size of planetesimals grows, emission from the debris decreases and occurs at later times. At 24–850 m, the peak IR excess decreases by factors of 10–50 as the initial size of planetesimals grows from 1 km to 100 km.
To conclude this section, we examine several aspects of the color evolution of debris disks. Color indices provide a useful way to separate distinct phases of planet growth without the need to measure the expected flux from the underlying stellar photosphere. Figure 27 shows the evolution of the [8]–[24] color as a function of stellar mass and initial disk mass. At early times (1–10 Myr), evolution to the main sequence dominates the color evolution of low mass disks. As they approach the main sequence, low (high) mass stars become less (more) luminous. Disks become cooler (hotter); colors become redder (bluer). When the collisional cascade begins, the entire disk produces dust. This dust is cooler than the dust from the inner disk which produces emission at the start of the evolution. Thus, the colors become significantly redder. The maximum color index scales with the initial disk mass. More massive disks produce more dust at larger distances from the central star. More distant dust is cooler. Thus, more massive disks have redder color indices.
4.3 Highlights of Debris Disk Evolution for 1–3 M⊙ Stars
With current observational techniques, the properties of dusty debris disks are the only constraints on the formation of icy planets at 30–150 AU. Tables 23–24 list scaling relations which connect the observable properties of the debris to the underlying physical properties of the planetesimal disk. Based on these relations and the results described in Figures 18–27, we derive nine clear predictions for the evolution of debris disks throughout the formation and evolution of a planetary system. Figure 28 is a schematic summary of the most important predictions.
-
1.
During runaway growth, the optical depth in large objects and the dust production rate decline with time. Thus, dust emission also declines with time.
-
2.
As the central star evolves to the main sequence, an increase in the stellar effective temperature can produce small increases in dust emission at short wavelengths. Because the amount of dust in the disk decreases, the fractional dust luminosity decreases as the short wavelength emission rises.
-
3.
Once oligarchic growth begins, dust emission rises dramatically. In more massive disks and in disks with smaller planetesimals, dust emission rises at earlier times to higher levels. Peak flux occurs roughly at the time when the inner disk produces several Pluto mass objects. Massive disks with 1 km and smaller planetesimals produce the most luminous debris disks ( ) roughly at the time when the central star reaches the main sequence. Because the disks in our calculations are radially optically thick, these peak luminosities are roughly an order of magnitude smaller than results from analytic derivations (e.g., Wyatt et al., 2007a; Heng & Tremaine, 2010). For 1–3 M⊙ stars, the maximum 24 m excess grows by roughly a factor of 3 for every 0.5 M⊙ increase in stellar mass. The maximum 70–160 m excesses are roughly 100–300 times the flux from the stellar photosphere. The largest 850 m excesses are factors of 2–10 smaller.
-
4.
After the dust emission reaches peak flux, the emission declines slowly with time. In our calculations, the decline is roughly a power law, with 0.6–0.8. The time evolution of IR/submm excesses generally follow the trends in . For typical disk temperatures 100 K, emission from wavelengths shorter than 20–30 m are on the Wien side of the spectral energy distribution. This emission follows a power law decline in time with 0.6–0.8. Emission at longer wavelengths lies at the Planck peak or on the Rayleigh-Jeans tail of the energy distribution. Excesses at these wavelengths tend to decline more slowly with time ( 0.1–0.6).
-
5.
The IR/submm excesses and are very sensitive to the initial sizes of planetesimals at 30–150 AU. Disks with small planetesimals ( 1 km) transform into bright debris disks on relatively short timescales. Disks with larger planetesimals never become bright debris disks. Our results suggest reductions of 4–40 in peak luminosity for disks with 10–100 km planetesimals. Disks with large planetesimals produce low luminosity debris disks. With current techniques, IR emission from these disks is not detectable.
-
6.
IR/submm excesses are weakly sensitive to the fragmentation parameters. In low mass, optically thin disks, the emission depends only on the mass of dust. Low mass disks with weak planetesimals produce more dust emission than low mass disks with strong planetesimals. In massive disks, the dust is opaque ( 1). The amount of dust emission then depends on the mass in dust and the scale height of the dust above the disk midplane. Disks with more massive planets have larger . Thus, disks with stronger planetesimals produce more dust emission.
-
7.
Long main sequence lifetimes allow the collisional cascade to remove more material from the disk. Thus, debris disks around older, lower mass stars are brighter than disks around older, more massive stars.
-
8.
Emission at short wavelengths depends on the mass of the central star. Stars with 1 M⊙ are not luminous enough to produce significant emission from debris at 30 AU. Thus, short wavelength emission from solar-type and lower mass stars is produced from debris closer to the central star.
-
9.
An ensemble of debris disks with a broad range of initial masses produces a broad range of IR excess emission throughout the main sequence lifetime of the central star.
5 APPLICATIONS
Our calculations make clear predictions for the evolution of debris disks as a function of stellar mass and initial disk mass. To test these predictions, we now consider several applications to recent IR and millimeter data.
We begin with a discussion of the time evolution of IR excesses at 24–70 m. Here, the observed fluxes and the long-term trends depend mainly on the initial sizes of planetesimals and the initial mass in the disk. Thus, our initial goals are to see whether our predictions roughly match the observations and to infer whether we can deduce approximate ranges for the initial properties of the disk. In addition to these parameters, the outer disk radius and the typical sizes and emissivity law of the smallest grains also modify the predicted fluxes. Thus, our second set of goals is to learn which changes in our assumptions are allowed by the data.
We conclude this section with a comparison of the observed and predicted detection frequencies of debris disks at IR and mm wavelengths. Here, the probability of detecting a debris disk depends on the joint probability that a disk of a given initial mass () produces a detectable excess and that a disk of that mass is common enough to appear in a typical survey with Spitzer or a ground-based radio telescope. Thus, this comparison tests whether an adopted distribution of initial disk masses can produce the observed distribution of known debris disks as a function of stellar age.
5.1 Time evolution of debris disks
In the past few years, several comprehensive Spitzer programs have searched for debris disks around all classes of main sequence stars. Recent surveys of A-type stars and solar-type stars span a broad range of stellar ages with sufficient statistics to provide initial tests of our models. We begin with a discussion of A-type stars and then consider comparisons between our models and observations of solar-type stars.
5.1.1 A-type Stars
Since the initial discovery of debris disks around Vega, Fomalhaut, and Pic, IR observations have revealed debris around hundreds of A-type stars (e.g., Backman & Paresce, 1993; Rieke et al., 2005; Su et al., 2006; Currie et al., 2008a; Rebull et al., 2008; Gautier et al., 2008; Carpenter et al., 2009b; Morales et al., 2009). For stars with ages of 50 Myr to 1 Gyr, analyses of the 24–25 m excesses of several large samples demonstrate a clear decline in the excess with time (Rieke et al., 2005; Su et al., 2006). Subsequent studies include larger samples of younger stars. These results suggest a rise in the debris emission from 5 Myr to 10 Myr, a plateau in emission at 10–30 Myr, and a slow decline in emission for older stars (Hernández et al., 2006, 2007, 2009, Currie et al. 2008a, 2008b). Although the significance of the rise in debris disk fluxes at 5–10 Myr is controversial (e.g., Carpenter et al., 2009b), the long decline in the 24–25 m flux with age is a robust feature of debris disk evolution around A-type stars (Wyatt et al., 2007b; Kennedy & Wyatt, 2010).
To compare our predictions with observations, we consider data for A-type stars from three compilations (Rieke et al., 2005; Su et al., 2006; Currie & Kenyon, 2009). The combined sample from Rieke et al. (2005) and Su et al. (2006) has 319 stars with 24–25 m photometry, spectral types B7-A6, and ages 5–850 Myr. The Currie et al. (2009, see also Currie et al. 2008a) compilation adds 157 stars with similar spectral types and ages 2.5–25 Myr. Based on comparisons of observed HR diagrams with stellar evolution models, the stars have masses of 1.7–2.5 M⊙ (KB08). Thus, we compare these data with our results for disks around 2 M⊙ and 2.5 M⊙ stars.
Figure 29 shows several comparisons between our predicted fluxes and observations of A-type stars. The data appear as blue points in each of the four panels. The solid curves show predicted fluxes for disks with strong planetesimals and initial around 2.5 M⊙ stars. The legends in each panel indicate the initial planetesimal size; the legend in the upper left corner of the upper left panel indicates for all model curves.
All of the model curves show the same trend with time. Following a period with little or no excess, the flux from the IR excess rises rapidly to a plateau value and then declines slowly with time. The flux level and the timing of the plateau correlates with initial disk mass and the initial planetesimal size. More massive disks and disks with smaller planetesimals have larger excesses at 24 m and reach peak excess earlier in time (see also Tables 23–24).
Two sets of model curves agree reasonably well with the data. In the left panels, the range of predicted excesses for all initial disk masses encompasses most of the observed points. Calculations with a range of initial planetesimal sizes provide a better match to observations of younger stars; low mass disks composed of 1 km planetesimals yield a better match to the data for older stars. In both cases, the predicted fluxes for the ensemble of disks explain 97% to 98% of measured Spitzer fluxes for A-type stars.
Two sets of model curves do not match the observations. In the right panels, the range of predicted fluxes for disks of 10–100 km planetesimals fail to explain the brightest sources with ages of 5–30 Myr. Disks of 100 km planetesimals also cannot explain the brightest sources with ages of 100 Myr. Although both sets of models can match the range of observations of older stars, sources with 2 require relatively massive disks with 0.33 ( 1) for models with 10 km (100 km) planetesimals. Disks around young stars have typical 0.03–0.10 (Andrews & Williams, 2005). Thus, these calculations provide an unlikely match to the data.
Figure 30 repeats the format of Figure 29 for different sets of models. In the left (right) panels, the curves plot predicted fluxes for disks with (). The lower (upper) panels plot predicted fluxes for 2 M⊙ (2.5 M⊙) stars. The legends in the upper panels summarize the appropriate for each model curve.
When disks are composed of small planetesimals, a range of initial disk masses can explain most of the observed range of debris disk fluxes. For systems with ages of 10–20 Myr, disks with around 2.5 M⊙ stars match the observed fluxes for all but a few of the most luminous debris disks. Disks with can also match the data. Although disks around 2 M⊙ stars provide a poorer match to all observations of young stars, disks around lower mass stars match the data well for older stars.
Variations in the initial surface density law yield a small range of debris disk fluxes. In calculations with small planetesimals, disks with different surface density laws but similar total masses within 150 AU produce somewhat different 24 m fluxes. We show in the next sub-section that both of our adopted surface density laws can explain the observed frequency of debris disks around young A-type stars and G-type stars
Figure 31 compares the predicted color evolution for model debris disks with observations from the Su et al. (2006) sample of A stars. The format follows the format of the left panels in Figure 30. The upper panel shows results for models around 2.5 M⊙ stars; the lower panel shows results for models around 2 M⊙ stars. Disks with large planetesimals yield poor fits to the observed colors; disks with small planetesimals and different surface density laws yield similar matches to the observed colors. Thus, we focus on models with for 2 M⊙ and 2.5 M⊙ stars.
In each panel, the model colors show four clear trends. At 1–10 Myr, the colors redden as the central star evolves to the main sequence. During this evolution, grains throughout the disk become hotter and emit more flux. This emission then dominates scattered light from the disk. The [24]–[70] color becomes redder. At the same time, the most massive disks start to produce copious amounts of debris. More massive disks have more grains emitting at longer wavelengths. These disks have the reddest colors. As the collisional cascade develops, the flux at shorter wavelengths initially rises faster than the flux at long wavelengths. The colors become bluer. At later times, the flux at longer wavelengths rises more rapidly. The colors then become redder. Finally, the emission starts to decline at all wavelengths. Radiation from the central star then contributes more and more to the IR excess. The colors become bluer.
The observed colors do not show any obvious trends with time. Although it is tempting to suggest two peaks in the color distribution at 10 Myr and at 100 Myr, there are few stars with ages of 30–50 Myr. Older stars appear to have more debris disks with bluer colors than younger stars. However, this feature is probably due to a lack of young stars with small excesses.
Despite the lack of trends in the data, both models match the observations in Figure 31 reasonably well. At any stellar age, a broad range in disk masses explains most of the observed range in colors. Predicted colors for 2 M⊙ (2.5 M⊙) stars encompass 94% (83%) of the observed colors. For both stellar masses, none of the models match the colors of the reddest sources. Most of these sources have ages of 10 Myr and 50–100 Myr. Color measurements for stars with ages of 20–100 Myr would provide a good test of the models for the reddest sources.
5.1.2 G-type Stars
Although IRAS and ISO data enabled the discovery of a few debris disks around solar-type stars (Backman & Paresce, 1993; Decin et al., 2003; Song et al., 2005; Rhee et al., 2007), recent Spitzer observations have yielded a large sample of systems around FGK stars (e.g., Beichman et al., 2006; Hillenbrand et al., 2008; Trilling et al., 2008; Carpenter et al., 2009a). As preparation for future searches for terrestrial planets, most surveys have targeted older, nearby solar-type stars (e.g., Beichman et al., 2006; Trilling et al., 2008). One program targeted stars with a range of ages (e.g., Meyer et al., 2006). Together these samples provide good initial tests of our predictions.
To test our models with the data, we collected 70 m data from Beichman et al. (2006), Trilling et al. (2008), and Hillenbrand et al. (2008, see also Carpenter et al. 2009a). After eliminating stars with estimated masses smaller than 0.8 M⊙, the combined sample has 100 stars with ages ranging from 10 Myr to 10 Gyr. We compare these data with predictions for debris disks around 1 M⊙ stars. Predictions for disks around 1.5 M⊙ stars yield similar conclusions.
Figure 32 compares the observations with the predicted evolution for our models. The left panel plots calculations for disks with , = 0.01–1, and 1 m to 1 km planetesimals. The right panel includes calculations for disks with , = 0.01–3, and 1 km planetesimals. Predictions for disks with larger planetesimals provide very poor matches to the data (e.g., Figure 29). Both sets of models show similar trends with time. During runaway growth, the IR excess remains constant or declines slightly with time. Once oligarchic growth begins, the IR excess rises dramatically. More massive disks rise earlier and reach larger peak fluxes than lower mass disks. The peak flux and the time of peak flux also depend on the initial planetesimal size. Disks with a range of small planetesimal sizes rise earlier than disks with a single planetesimal size.
Although the data clearly preclude large planetesimals, the observations do not discriminate among possible models with small planetesimals (see also Heng & Tremaine, 2010). Both sets of predictions provide reasonable matches to the data. Roughly 75% of the observed points lie within the area outlined by the models. For models with (), disks with 0.03 (0.33) have masses close to the median disk mass suggested from observations of pre-main sequence stars in Taurus-Auriga and Ophiuchus (Andrews & Williams, 2005, 2007b). Thus, our calculations predict a large population of low luminosity debris disks in systems with low mass disks.
In KB08, we noted that two changes to our assumptions yield a better match to observations. Reducing the maximum stable grain size from = 1 m to = 0.1 m and changing the slope of the radiative emissivity law from = 1 to = 0.7 increase the predicted fluxes by a factor of 3–10 at 70–160 m. Observations currently provide little guidance on either of these parameters for debris disks around solar-type. In the A-type stars Vega, Oph, and HR 8799, Spitzer imaging and spectroscopic observations yield good constraints on the maximum stable grain size, with 5–10 m (Su et al., 2005, 2008, 2009; Müller et al. 2010). Additional submm data can establish limits on . Measurements of and for a sample of debris disks around solar-type stars would enable a better evaluation of our predictions.
In addition to and , changes to – the slope of the size distribution of the debris – also yield a better match to observations. For weak planetesimals, the theoretical estimate of = 3.67 (O’Brien & Greenberg, 2003; Kobayashi & Tanaka, 2010) yields factor of 5–10 larger 70 m fluxes throughout the evolution. Thus, weak planetesimals with = 3.67 are favored over strong planetesimals with = 3.5. Aside from matching the observed Spitzer fluxes, observations provide little guidance for . However, larger samples of debris disks with ages of 10–100 Myr would yield a good test. In the context of our calculations, detecting 10 Myr old systems with 300 would provide some evidence for weak planetesimals with 3.5.
5.2 Frequency of Debris Disks
Although the good agreement between predicted and observed fluxes is encouraging, Figures 29–32 do not yield a quantitative measure of success of our models. To make this measure, we consider the ability of our models to predict the frequency of debris disks around stars with a range of masses. For this first attempt, we construct the probability that an ensemble of disks with a range of initial masses produces debris disks detectable with current technology. The sensitivity of current observations and the predicted fluxes of debris disks depend on wavelength. Thus, we define this detection probability as a function of wavelength.
To predict for debris disks from our calculations, we adopt a simple model. We consider a sample of stars with stellar masses and disk masses . For , observed disk masses roughly follow a log normal probability distribution (Andrews & Williams, 2005, 2007b). Thus, we follow Alexander & Armitage (2006) and adopt
| (22) |
where = log () defines the average disk mass, is the dispersion, and is a normalization constant. Following Andrews & Williams (2007b), = , = 1.0, and = .
To define , we use the results of our simulations to assign IR excesses – log – as a function of time to disks with initial masses . For any , there is a range of disks with IR excesses larger than some detection threshold, ,
| (23) |
Disks that satisfy this inequality have . Thus the detection probability for an adopted detection threshold is
| (24) |
To set the detection threshold, we rely on the measurement uncertainties and detection limits of existing Spitzer surveys. If is the uncertainty in the measured flux at wavelength , stars with clear IR excesses have measured fluxes that exceed the stellar photospheric flux by several . We define as the signal-to-noise ratio required to identify an excess (e.g., Rieke et al., 2005; Beichman et al., 2006; Bryden et al., 2006; Su et al., 2006; Trilling et al., 2008). Thus, our criterion for the detection threshold is
| (25) |
In our calculations, we derive the flux ratio . Thus, we rearrange the detection threshold as
| (26) |
In this expression, the left-hand side is predicted by the models; the right-hand side is set by observations. Thus, our detection threshold is .
There are two approaches to setting . Both rely on the predicted mid-IR flux from the stellar photosphere, derived from model atmosphere fits to optical and near-IR data. When a set of observations is capable of detecting emission from the stellar photosphere, the average flux ratio for a subset of stars in the sample resembles a gaussian centered roughly on unity with a dispersion (e.g., Rieke et al., 2005; Beichman et al., 2006; Su et al., 2006). In these stars, the observed flux is probably very close to the actual photospheric flux. Stars with are then likely debris disks; is the appropriate detection threshold for our models. When observations cannot reliably detect photospheric emission in stars without debris disks, most analyses adopt the predicted photospheric flux as the actual photospheric flux. The appropriate threshold for these studies is then .
5.2.1 Spitzer Observations of A-type Stars
To apply this model to observations, we first consider the Su et al. (2006) sample of A-type stars. This sample has 160 stars with high quality Spitzer 24 m and/or 70 m photometry, stellar spectral types B7–A6, and ages 5–850 Myr. Most stars in the sample have 24 m and 70 m fluxes consistent with the predicted photospheric fluxes. For these stars, Su et al. (2006) infer = 0.98 0.026 at 24 m and = 1.11 0.15 at 70 m. Thus, the detection thresholds are and . For = 3–5, roughly 33% of the stars have IR excesses, at levels ranging from 10% to several hundred times the flux from the stellar photosphere.
Figure 33 compares our predictions for disks with around 2 M⊙ stars with data from the Su et al. (2006) survey of A-type stars. To construct this plot, we adopt the conservative estimate of = = 5 and compute predicted detection probabilities at 24 m and at 70 m. For the data, we identify debris disks with excesses at the 5 level and calculate the observed detection frequency. To improve statistics, we bin the observations in discrete age bins. For each point in the plot, the horizontal error bar indicates the range of stellar ages used for the bin; the vertical error bar indicates the 1 uncertainty from Poisson statistics.
Despite the high quality of the Su et al. (2006) data, many sources have upper limits at 70 m. To provide an additional measure of the uncertainty in these data, we derive an upper limit to by assuming that every star with an upper limit has an IR excess. For the entire sample, this assumption yields an upper limit of = 0.67 (see also Su et al., 2006).
At both wavelengths, our predictions show similar trends. The models predict a slow rise in the detection probability from 1 Myr to 50–100 Myr, a plateau at 100–300 Myr, and a sharp decline from 300 Myr to 1 Gyr. Hotter dust in the inner disk evolves faster than cooler dust farther out in the disk. Thus, evolution at 24 m is faster than at 70 m. At both wavelengths, the slow rise in detection probability results from the detection of lower mass disks with smaller peak fluxes at later times. For 300 Myr, debris emission declines rapidly (Figures 29–30). This decline produces the steep drop in detection probability at later times.
Our predictions agree reasonably well with the observations. At early times ( 10 Myr), the model matches the 24 m data and lies in between the observed and upper limit to the data at 70 m. At intermediate times ( 50–200 Myr), the data fall a factor of 2–3 below predictions. At later times ( 500 Myr), the model again matches the 24 m data but overpredicts the 70 m data by a factor of 1.5–3. For the full ensemble of observations, our models predict detection probabilities of = 0.55 0.05 and = 0.81 0.04. Both of these are somewhat larger than the observed detection rates of 0.33 0.05 (Su et al., 2006). Our prediction at 70 m is close to the upper limit of 0.67.
These conclusions do not depend on the initial surface density relation or the fragmentation parameters. All our results suggest detection probabilities 0.53–0.57 and 0.81–0.88.
Modest changes to our calculations can modify significantly. To test the models in more detail, we derived detection probabilities assuming larger values for the slope of the size distribution for small grains and for the maximum stable grain size . Adopting = 3.67 increases predicted fluxes at all wavelengths, increasing the predicted detection probabilities to more than 0.90. In the context of our models, existing observations rule out this change. Adopting = 10 m reduces the predicted fluxes at all wavelengths. This change yields = 0.40 0.05 and = 0.62 0.04, very close to the observed value at 24 m and the upper limit at 70 m.
5.2.2 Spitzer and Submillimeter Observations of G-type Stars
To apply our model to G-type stars, we consider 70 m data from Spitzer and 350–1200 m data from several ground-based observatories. Most of these surveys did not detect the photospheres for a large fraction of program stars. Thus, we employ the second approach for the detection threshold in our analysis.
We consider several samples of G-type stars at each wavelength. At 70 m, the Beichman et al. (2006) and Trilling et al. (2008) surveys focus on nearby stars with typical ages of 1–15 Gyr. Data from the Formation and Evolution of Planetary Systems (FEPS) Spitzer Legacy program includes stars with a wide range of ages (1 Myr to 10 Gyr). At longer wavelengths, Roccatagliata et al. (2009) analyze 350 m and 1.2 mm observations of older stars ( 10 Myr) from the FEPS survey. Several deeper submm surveys describe data for nearby solar analogs (Greaves et al., 2009) and for stars in the Pleiades (Greaves et al., 2009).
Figure 34 compares our predictions with the observed detection frequencies. To construct this plot, we adopt a 5 detection threshold and compute observed and predicted detection rates. To provide an estimate for the sensitivity of our results to the outer disk radius, we include predictions for large disks with radii of 150 AU and for small disks with outer radii of 75 AU.
Our predictions agree well with observations at all wavelengths. At 70 m, our predictions match surveys with large (Beichman et al., 2006), intermediate (Trilling et al., 2008), and small (Carpenter et al., 2008) detection rates. The close match between our models and these observations suggests that the broad range in observed detection rates is a result of small number statistics and differences in target selection. Although any set of model disks with outer radii 75 AU agree with the 350 m data, the small sample size precludes any clear test of the models. Data at longer wavelengths yield a more severe test. Small disks match observations of nearby solar analogs (Greaves et al., 2009) better than large disks. Predictions for small and large disks agree with observations of FEPS and Pleiades stars.
6 CONCLUSIONS
Together with the discussion in KB08, the results described here provide a robust theoretical picture for the formation of icy planets and debris disks from a disk of icy planetesimals surrounding 1–3 M⊙ stars. These calculations set the context for the evolution of dusty debris in a dynamic system of planets and establish a framework for interpreting existing observations of debris disks around intermediate mass stars. Our analysis also suggests new observational tests of this picture.
We describe a suite of numerical calculations of planets growing from ensembles of icy planetesimals at 30–150 AU in disks around 1–3 M⊙ stars. Using our hybrid multiannulus coagulation code, we solve for the evolution of sizes and orbits of objects with radii of 1 m to 1000 km over the main sequence lifetime of the central star. These results allow us to constrain the growth of planets as a function of disk mass, planetesimal size, surface density law, stellar mass, and semimajor axis.
In disks with small planetesimals, debris disk formation is coincident with the formation of a planetary system. All calculations of icy planet formation with 1–10 km planetesimals at 30–150 AU lead to a collisional cascade which produces copious amounts of dust on timescales of 5–30 Myr. This dust is observable throughout the lifetime of the central star. Because we consider a broad range of input parameters, we derive the time evolution of (i) dust produced in the collisional cascade and (ii) the IR and submm emission from this dust as a function of the initial parameters.
In disks with larger planetesimals, debris disks form near the end of the main sequence lifetime of the central star. The collisional cascade is weak and produces little dust. This dust is barely observable with current technology. As long as the planetesimals are initially large, this conclusion is independent of the initial mass or surface density of the disk, the semimajor axis, or the stellar mass.
We divide the rest of this section into (i) theoretical considerations, (ii) observable consequences, and (iii) observational tests. The theoretical considerations build on the highlights of icy planet formation in §3.3. Observable consequences and tests of the calculations follow from the discussions in §4.3 and §5.
6.1 Theoretical Considerations
-
1.
Icy planet formation at 30–150 AU is self-limiting. Starting with a swarm of 10 km planetesimals, runaway growth produces a set of 100–500 km protoplanets. As the protoplanets grow, they stir up leftover planetesimals along their orbits. When the leftovers reach high , collisions produce debris instead of mergers. Protoplanets cannot accrete leftovers rapidly; a cascade of destructive collisions grinds the leftovers to dust. Poynting-Robertson drag and radiation pressure then remove the dust from the disk.
-
2.
In disks composed of 10 km planetesimals, the maximum sizes of icy planets at 30–150 AU depend primarily on the initial disk mass. The largest icy planets around 1–3 M⊙ stars have 1500–3500 km and 0.003–0.05 M⊕. These objects contain 3%–4% of the initial disk mass. Plausible ranges in the fragmentation parameters can reduce the maximum mass by a factor of 10. In addition to these robust limits on the maximum size of icy planets, the finite main sequence lifetimes of 1–3 M⊙ stars limits the formation of many large planets in the outer disk. Thus, the inner disk produces many more Pluto-mass planets than the outer disk (Tables 5–10).
-
3.
In disks composed of 10 km planetesimals, icy planets reach larger sizes. Our results suggest 6000–11500 km and 0.2–1.5 M⊕. These planets form slowly. By the time the central star evolves off the main sequence, large planets contain 10% of the initial disk mass. The weak collisional cascade produces little dust. Thus, Poynting-Robertson drag and radiation pressure remove little dust from the disk.
-
4.
At 30–50 AU, collisional cascades remove a substantial fraction of small planetesimals in the massive disks around 1–3 M⊙ stars. In disks with 0.1, 10% of the initial mass in small objects remains when the central star evolves off the main sequence. At larger disk radii ( 100 AU), more than 50% of the initial disk mass is still in small planetesimals at . Throughout lower mass disks with 0.1, most of the mass remains in small planetesimals.
-
5.
Collisional cascades produce copious amounts of dust. Dust starts to form during the transition from runaway to oligarchic growth, peaks when the largest objects first reach sizes of 1000 km, and slowly declines as objects reach their maximum sizes. This evolution is more sensitive to the initial sizes of the planetesimals than on the initial surface density law or the fragmentation parameters. In massive disks with small planetesimals, this evolution begins as the central star approaches the main sequence; in lower mass disks and in disks with large planetesimals, peak dust formation occurs as the central star evolves off the main sequence. In ensembles of disks with = 0.01–1, the peak mass in 0.001–1 mm (0.001–1 m) particles ranges from 0.002 to 10 lunar masses (0.002 to 10 M⊕).
-
6.
Radiative processes can remove large amounts of mass from the disk. During the early stages of the collisional cascade, radiation pressure produces a wind of small particles. This wind contains 60% to 100% of the mass lost from the disk. During the end stages of the cascade, Poynting-Robertson drag pulls the rest of the lost mass into regions with 30 AU.
-
7.
The impact of gas giant planets on debris disks is a major uncertainty in our calculations. Gas giants at 5–20 AU (e.g., Kennedy & Kenyon, 2008) produce small-scale fluctuations in the orbits of planetesimals at 30–150 AU (e.g., Mustill & Wyatt, 2009) and large-scale dynamical events throughout the disk (e.g., Gomes et al., 2005). These perturbations modify the evolution of the collisional cascade and impose structure in the radial distribution of small objects (e.g., Wilner et al., 2002; Moro-Martín & Malhotra, 2005; Quillen, 2006; Booth et al., 2009). Current observational constraints on the frequency of gas giants around G stars (Cumming et al., 2008) and A-type stars (Johnson et al., 2007) suggest gas giants probably form only in the most massive disks. Thus, gas giants probably cannot change our predictions for debris disks in low mass disks ( 0.1). In massive disks around 2–3 M⊙ stars, the rapid rise in dust production at 30–50 AU roughly coincides with the timescale for gas giant planet formation. Thus, gas giants probably enhance the dust production rate and may sometimes change the outcome of planet formation at 30–150 AU. In massive disks around 1–1.5 M⊙ stars, gas giants form well before the rise in the dust production. Here, gas giants probably play a major role in the evolution of the debris disk. Quantifying this role requires simulations that include gas giant planet formation in disks with dimensions of 3–150 AU. These simulations are now possible on high performance computers.
-
8.
Planetesimal formation is another uncertainty. Current simulations of the growth of small, micron-sized dust grains in a turbulent disk require accurate treatments of collisions, dust dynamics, and gas dynamics (e.g., Rice et al., 2006; Garaud, 2007; Kretke & Lin, 2007; Brauer et al., 2008; Cuzzi et al., 2008; Laibe et al., 2008; Youdin, 2008; Birnstiel et al., 2009). Recent results are inconclusive on the typical planetesimal size, with expected sizes ranging from meters to more than a thousand kilometers. Expected formation times are generally shorter than the typical evolution time of 1 Myr. Thus, our assumption of initial ensembles of 1 m to 100 km planetesimals is probably reasonable.
-
9.
Our models provide some guidance for models of planetesimal formation. Several recent numerical simulations of streaming instabilities in turbulent disks yield planetesimals with 100–1000 km (e.g., Johansen et al., 2007, 2009). Morbidelli et al. (2009) demonstrate that an initial ensemble of large planetesimals may resolve several outstanding issues in the formation of the asteroid belt in the Solar System. In the context of our calculations, however, the observed evolution of debris disks around A-type and G-type stars strongly favors disks with a significant amount of solid material in small ( 1–10 km) planetesimals at 30–150 AU. Although forming small planetesimals in a turbulent disk is challenge, the dead zones of protoplanetary disks are attractive locations for producing planetesimals with 0.1–1 km on short timescales (e.g., Brauer et al., 2008). Based on our results, identifying similar mechanisms to produce small planetesimals at 30–150 AU may provide important insights into the formation of debris disks and planetary systems.
6.2 Observational Consequences
Our calculations yield robust observational consequences of the collisional cascade.
-
1.
The dusty debris from the collisional cascade is directly observable throughout the main sequence lifetime of the central star. For disks around 1–3 M⊙ stars, the maximum fractional dust luminosity of is comparable to the maximum dust luminosities of known debris disks (Backman & Paresce, 1993; Rieke et al., 2005; Su et al., 2006; Rhee et al., 2007). With typical radial optical depths of 1–10 at maximum, this limit is roughly an order of magnitude smaller than theoretical maximum (e.g., Wyatt et al., 2007a; Heng & Tremaine, 2010). The dust temperature at the inner edge of a 30–150 AU disk scales with the temperature of the central star; thus, the predicted 24 m excess is very sensitive to the stellar mass. At 70 m, the predicted excesses scale roughly linearly with disk mass and stellar mass. The predicted 160–850 m excesses depend on the disk mass but are nearly independent of the stellar mass.
-
2.
The amount of dusty debris depends on the initial sizes of planetesimals. In our calculations, bright debris disks at 5–30 Myr require planetesimals with initial sizes 1 km. Calculations with 10–100 km planetesimals produce no debris around young stars and little debris around older stars. Thus, our results suggest planetesimals with initial sizes 1 km.
-
3.
The amount of debris depends weakly on the initial surface density law and the fragmentation parameters. Disks with similar total masses produce similar amounts of dust emission. Disks with stronger planetesimals produce more dust emission than disks with weaker planetesimals.
-
4.
Stellar evolution limits the brightness evolution of debris disks. Among coeval stars with ages 100 Myr (e.g., star clusters), lower mass stars have brighter debris disks. Among older stars near the main sequence turn-off (e.g., field stars), our results suggest that debris disks around massive stars are relatively brighter than debris disks around lower mass stars.
-
5.
The time evolution of , IR fluxes, and IR colors provide useful diagnostics of the source of the debris. When the collisional cascade begins, and IR excesses increase with time, reach a plateau, and then decline with time. IR colors generally become redder when IR excesses rise and bluer when IR excesses fall. This evolution contrasts with the expected evolution of a pre-existing disk of small particles responding to changes in the properties of the central star, where always declines with time.
6.3 Observational Tests
Observations of debris disks around A-type and G-type stars provide good tests of our predictions. More comprehensive comparisons with the data require calculations with a broader range of grain parameters than discussed here. For example, Kennedy & Wyatt (2010) develop an elegant semi-analytic model that captures many aspects of our planet formation calculations and apply this model to observations of A-type stars. By deriving the best set of fragmentation parameters and dust properties to fit the data, they infer robust constraints on the initial mass, radius, and surface density in the disk. Here, we focus on comparisons that test the ability of our calculations to explain the observed evolution and frequency of debris disks around A-type and G-type stars.
-
1.
Our calculations explain the observed time evolution of debris disk fluxes for solar-type stars (Figure 32). For an initial ensemble of 1 km planetesimals, the predicted evolution of the 70 m excess follows the apparent rise in source fluxes at 10–100 Myr, the peak at 100–300 Myr, and the decline from 300 Myr to 10 Gyr. Larger samples of young G stars (e.g., Currie et al., 2007a, 2007b) would provide a better discrimination among models with different initial conditions. Although predicted fluxes for models with a smallest stable grain size 1 m, a slope of the emissivity law for small grains 1, and a slope for the size distribution of small grains 3.5 improve our match to the data, our standard models explain 75% of the observed fluxes. These models also predict an undiscovered population of low luminosity debris disks. More sensitive surveys with Herschel can test this prediction and provide better guidance on our adopted values for and . Better constraints on and should also yield better guidance on .
-
2.
Our models predict very small 24 m excesses from dust at 30–150 AU around G-type stars. Matching the observed levels of 24 m emission requires another source of dust emission. Dust in the terrestrial zone is the best candidate. For young stars, predicted fluxes from terrestrial debris disks typically exceed observed fluxes (e.g., Kenyon & Bromley, 2004b, 2005). Although the average flux in model debris disks drops rapidly, catastrophic collisions can produce observable levels of debris around stars with ages exceeding 100 Myr (e.g., Grogan et al., 2001; Wyatt & Dent, 2002; Kenyon & Bromley, 2005; Wyatt et al., 2007a; Smith et al., 2008). Resolved observations of debris disk emission around G-type stars at 24 m would test model predictions for dust emission from the terrestrial zone and from material at 30–150 AU.
-
3.
Our calculations also match the observed time evolution for debris disks around A-type stars (Figures 29–30). For ensembles of planetesimals with initial sizes 1 km, our results match the apparent rise in fluxes at 5–10 Myr, the plateau at 10–30 Myr, and the decline from 30 Myr to 1 Gyr. The predicted rate of the decline, with 0.6–0.8, agrees with the observed rate of decline ( 0.5–1; Greaves & Wyatt, 2003; Rieke et al., 2005; Rhee et al., 2007; Wyatt, 2008). Models for disks around 2.5 M⊙ stars match the peak fluxes of A-type stars at 10–30 Myr; models for 2 M⊙ stars provide a better match to fluxes during the decline. Accurate estimates of stellar mass would improve our evaluation of these matches.
-
4.
Predicted colors for debris disks around A-type stars also agree with the observations reasonably well (Figure 31). Colors for disks with initial surface densities match the data somewhat better than colors for disks with steeper initial surface density laws. Models around 2 M⊙ stars also provide better matches to the data. These models cannot match the colors of the reddest sources; colors for debris disks with ages of 30–100 Myr can test the models in more detail. These models yield clear predictions for the fluxes at longer wavelengths as a function of the stellar mass and the initial disk surface density relation. Large surveys – such as the proposed JCMT Legacy Survey (Matthews et al., 2007), several Herschel key programs, and submm observations with ALMA and SOFIA – can test these predictions.
-
5.
Our predictions provide reasonable matches to the observed detection probabilities of debris disks around A-type and solar-type stars. For solar-type stars, our predictions for and agree with Spitzer and submm observations. Disks with outer radii of 75–100 AU may match the data better than disks with outer radii of 150 AU. Deeper surveys with Herschel will provide better constraints on the outer disk radius and will test our ability to predict detection probabilities for low luminosity debris disks. For young A-type stars, predictions for and agree well with observations; among older stars, we overpredict the detection rates by a factor of 2–3. Models with 5–10 m provide a better match to the data. Calculations which include the dynamical evolution of giant planets probably also change the detection probability at late times. More sensitive observations of A-type stars at 70–160 m would enable better tests of models with our standard values for and and would discriminate among models with different choices for these two parameters and models with gas giant planets.
-
6.
In their comprehensive analytic study of planetesimal disks, Heng & Tremaine (2010) show that emission from long-lived disks of m-sized planetesimals can mimic debris disks produced by a collisional cascade. Imaging and multi-wavelength spectral energy distributions can distinguish between these two possibilities. Planetesimals at a distance (in AU) from the central star emit as blackbodies with equilibrium grain temperatures, 278 . Grains in debris disks are hotter than blackbody grains and have an emissivity law with 0 (e.g., Backman & Paresce, 1993; Heng & Tremaine, 2010). Recent Spitzer data suggest debris disks have small grains (e.g., Su et al., 2005, 2008, 2009). Data from Herschel will yield direct measurements of and enable searches for long-lived planetesimal disks.
From the broad suite of calculations in KB08 and this paper, we conclude that debris disks are the inevitable outcome of icy planet formation in a disk of solid objects. The full set of models explains many of the general properties of debris disks, including the time evolution of IR excesses and colors and the frequency of debris disks as a function of stellar mass and time. Our results also lead to clear predictions which can be tested with new and existing observations.
References
- Adachi et al. (1976) Adachi, I., Hayashi, C., & Nakazawa, K. 1976, Progress of Theoretical Physics 56, 1756
- Alexander & Armitage (2006) Alexander, R. D. & Armitage, P. J. 2006, ApJ, 639, L83
- Andrews & Williams (2005) Andrews, S. M., & Williams, J. P. 2005, ApJ, 631, 1134
- Andrews & Williams (2007a) Andrews, S. M., & Williams, J. P. 2007a, ApJ, 659, 705
- Andrews & Williams (2007b) Andrews, S. M., & Williams, J. P. 2007b, ApJ, 671, 1800
- Andrews et al. (2009) Andrews, S. M., Wilner, D. J., Hughes, A. M., Qi, C., & Dullemond, C. P. 2009, ApJ, 700, 1502
- Artymowicz (1988) Artymowicz, P. 1988, ApJ, 335, L79
- Backman & Paresce (1993) Backman, D. E., & Paresce, F. 1993, in Protostars and Planets III, eds. E. H. Levy & J. I. Lunine, Tucson, Univ of Arizona, p. 1253
- Beichman et al. (2006) Beichman, C. A., et al. 2006, ApJ, 652, 1674
- Benz & Asphaug (1999) Benz, W., & Asphaug, E. 1999, Icarus, 142, 5
- Birnstiel et al. (2009) Birnstiel, T., Dullemond, C. P., & Brauer, F. 2009, A&A, 503, L5
- Booth et al. (2009) Booth, M., Wyatt, M. C., Morbidelli, A., Moro-Martín, A., & Levison, H. F. 2009, MNRAS, 399, 385
- Brauer et al. (2008) Brauer, F., Henning, T., & Dullemond, C. P. 2008, A&A, 487, L1
- Bromley & Kenyon (2006) Bromley, B., & Kenyon, S. J. 2006, AJ, 131, 2737
- Brown & Schaller (2007) Brown, M. E., & Schaller, E. L. 2007, Science, 316, 1585
- Bryden et al. (2006) Bryden, G., et al. 2006, ApJ, 636, 1098
- Burns, Lamy, & Soter (1979) Burns, J. A., Lamy, P. L., & Soter, S. 1979, Icarus, 40, 1
- Carpenter et al. (2008) Carpenter, J. M., et al. 2008, ApJS, 179, 423
- Carpenter et al. (2009a) Carpenter, J. M., et al. 2009, ApJS, 181, 197
- Carpenter et al. (2009b) Carpenter, J. M., Mamajek, E. E., Hillenbrand, L. A., & Meyer, M. R. 2009, ApJ, 705, 1646
- Chambers (2006) Chambers, J. 2006, Icarus, 180, 496
- Charnoz & Morbidelli (2007) Charnoz, S., & Morbidelli, A. 2007, Icarus, 188, 468
- Chen et al. (2005) Chen, C. H., et al. 2005, ApJ, 634, 1372
- Chen et al. (2009) Chen, C. H., Sheehan, P., Watson, D. M., Manoj, P., & Najita, J. R. 2009, ApJ, 701, 1367
- Ciesla (2007) Ciesla, F. J. 2007, ApJ, 654, L159
- Cumming et al. (2008) Cumming, A., Butler, R. P., Marcy, G. W., Vogt, S. S., Wright, J. T., & Fischer, D. A. 2008, PASP, 120, 531
- Currie et al. (2007a) Currie, T., et al. 2007, ApJ, 659, 599
- Currie et al. (2007b) Currie, T., Kenyon, S. J., Rieke, G., Balog, Z., & Bromley, B. C. 2007, ApJ, 663, L105
- Currie et al. (2008a) Currie, T., Kenyon, S. J., Balog, Z., Rieke, G., Bragg, A., & Bromley, B. 2008, ApJ, 672, 558
- Currie & Kenyon (2009) Currie, T., & Kenyon, S. J. 2009, AJ, 138, 703
- Currie et al. (2009) Currie, T., Lada, C. J., Plavchan, P., Robitaille, T. P., Irwin, J., & Kenyon, S. J. 2009, ApJ, 698, 1
- Currie et al. (2008b) Currie, T., Plavchan, P., & Kenyon, S. J. 2008b, ApJ, 688, 597
- Cuzzi et al. (2008) Cuzzi, J. N., Hogan, R. C., & Shariff, K. 2008, ApJ, 687, 1432
- Decin et al. (2003) Decin, G., Dominik, C., Waters, L. B. F. M., & Waelkens, C. 2003, ApJ, 598, 636
- Deller & Maddison (2005) Deller, A. T., & Maddison, S. T. 2005, ApJ, 625, 398
- Demarque et al. (2004) Demarque, P., Woo, J.-H., Kim, Y.-C., & Yi, S. K. 2004, ApJS, 155, 667
- Dullemond & Dominik (2005) Dullemond, C. P., & Dominik, C. 2005, A&A, 434, 971
- Faber & Quillen (2007) Faber, P., & Quillen, A. C. 2007, MNRAS, 382, 1823
- Garaud (2007) Garaud, P. 2007, ApJ, 671, 2091
- Gautier et al. (2008) Gautier, T. N., III, Rebull, L. M., Stapelfeldt, K. R., & Mainzer, A. 2008, ApJ, 683, 813
- Goldreich, Lithwick, & Sari (2004) Goldreich, P., Lithwick, Y., & Sari, R. 2004, ARA&A, 42, 549
- Gomes et al. (2005) Gomes, R., Levison, H. F., Tsiganis, K., & Morbidelli, A. 2005, Nature, 435, 466
- Gorlova et al. (2007) Gorlova, N., Balog, Z., Rieke, G. H., Muzerolle, J., Su, K. Y. L., Ivanov, V. D., & Young, E. T. 2007, ApJ, 670, 516
- Greaves & Wyatt (2003) Greaves, J. S., & Wyatt, M. C. 2003, MNRAS, 345, 1212
- Greaves et al. (2009) Greaves, J. S., Stauffer, J. R., Collier Cameron, A., Meyer, M. R., & Sheehan, C. K. W. 2009, MNRAS, 394, L36
- Greaves et al. (2009) Greaves, J. S., Wyatt, M. C., & Bryden, G. 2009, MNRAS, 397, 757
- Greenberg et al. (1984) Greenberg, R., Weidenschilling, S. J., Chapman, C. R., & Davis, D. R. 1984, Icarus, 59, 87
- Grigorieva et al. (2007) Grigorieva, A., Artymowicz, P., & Thébault, P. 2007, A&A, 461, 537
- Grogan et al. (2001) Grogan, K., Dermott, S. F., & Durda, D. D. 2001, Icarus, 152, 251
- Habing et al. (2001) Habing, H. J., et al. 2001, A&A, 365, 545
- Hayashi (1981) Hayashi, C. 1981, Prog Theor Phys Suppl, 70, 35
- Heng & Tremaine (2010) Heng, K., & Tremaine, S. 2010, MNRAS, 401, 867
- Hernández et al. (2006) Hernández, J., Briceño, C., Calvet, N., Hartmann, L., Muzerolle, J., & Quintero, A. 2006, ApJ, 652, 472
- Hernández et al. (2007) Hernández, J., et al. 2007, ApJ, 671, 1784
- Hernández et al. (2009) Hernández, J., Calvet, N., Hartmann, L., Muzerolle, J., Gutermuth, R., & Stauffer, J. 2009, 707, 705
- Hillenbrand et al. (2008) Hillenbrand, L. A., et al. 2008, ApJ, 677, 630
- Hughes et al. (2008) Hughes, A. M., Wilner, D. J., Qi, C., & Hogerheijde, M. R. 2008, ApJ, 678, 1119
- Iben (1967) Iben, I. Jr, 1967, ARA&A, 5, 571
- Ida & Makino (1993) Ida, S., & Makino, J. 1993, Icarus, 106, 210
- Isella et al. (2009) Isella, A., Carpenter, J. M., & Sargent, A. I. 2009, ApJ, 701, 260
- Johansen et al. (2007) Johansen, A., Oishi, J. S., Low, M.-M. M., Klahr, H., Henning, T., & Youdin, A. 2007, Nature, 448, 1022
- Johansen et al. (2009) Johansen, A., Youdin, A., & Mac Low, M.-M. 2009, ApJ, 704, L75
- Johnson et al. (2007) Johnson, J. A., et al. 2007, ApJ, 665, 785
- Kalas et al. (2008) Kalas, P., et al. 2008, Science, 322, 1345
- Kennedy & Kenyon (2008) Kennedy, G. M., & Kenyon, S. J. 2008, ApJ, 673, 502
- Kennedy & Kenyon (2009) Kennedy, G. M., & Kenyon, S. J. 2009, ApJ, 695, 1210
- Kennedy & Wyatt (2010) Kennedy, G. M., & Wyatt, M. C. 2010, MNRAS, in press (arXiv:1002.3469)
- Kenyon & Bromley (2001) Kenyon, S. J., & Bromley, B. C. 2001, AJ, 121, 538
- Kenyon & Bromley (2002a) Kenyon, S. J., & Bromley, B. C. 2002a, AJ, 123, 1757
- Kenyon & Bromley (2002b) Kenyon, S. J., & Bromley, B. C. 2002b, ApJ, 577, L35
- Kenyon & Bromley (2004a) Kenyon, S. J., & Bromley, B. C., 2004a, AJ, 127, 513
- Kenyon & Bromley (2004b) Kenyon, S. J., & Bromley, B. C., 2004b, ApJ, 602, L133
- Kenyon & Bromley (2004c) Kenyon, S. J., & Bromley, B. C., 2004c, AJ, 128, 1916
- Kenyon & Bromley (2005) Kenyon, S. J., & Bromley, B. C. 2005, AJ, 130, 269
- Kenyon & Bromley (2006) Kenyon, S. J., & Bromley, B. C. 2006, AJ, 131, 1837
- Kenyon et al. (2008) Kenyon, S. J., Bromley, B. C., O’Brien, D. C., & Davis, D. R. 2008, in The Solar System Beyond Neptune, edited by A. Barucci, H. Boehnhardt, D. Cruikshank, & A. Morbidelli, Tucson, Univ. of Arizona Press, p. 293
- Kenyon & Bromley (2008) Kenyon, S. J., & Bromley, B. C. 2008, ApJS, 179, 451 (KB08)
- Kenyon & Bromley (2009) Kenyon, S. J., & Bromley, B. C. 2009, ApJL, 690, L140
- Kenyon & Hartmann (1987) Kenyon, S. J., & Hartmann, L. 1987, ApJ, 323, 714
- Kenyon & Luu (1998) Kenyon, S. J., & Luu, J. X. 1998, AJ, 115, 2136
- Kenyon & Luu (1999) Kenyon, S. J., & Luu, J. X. 1999, AJ, 118, 1101
- Kimura et al. (2002) Kimura, H., Okamoto, H., & Mukai, T. 2002, Icarus, 157, 349
- Kokubo & Ida (1998) Kokubo, E., & Ida, S. 1998, Icarus, 131, 171
- Kobayashi & Tanaka (2010) Kobayashi, H. & Tanaka, H. 2010, Icarus, 206, 735
- Kretke & Lin (2007) Kretke, K. A., & Lin, D. N. C. 2007, ApJ, 664, L55
- Krivov et al. (2000) Krivov, A. V., Mann, I., & Krivova, N. A. 2000, A&A, 362, 1127
- Krivov et al. (2006) Krivov, A. V., Löhne, T., & Sremčević, M. 2006, A&A, 455, 509
- Krivov et al. (2008) Krivov, A. V., Müller, S., Löhne, T., & Mutschke, H. 2008, ApJ, 687, 608
- Laibe et al. (2008) Laibe, G., Gonzalez, J.-F., Fouchet, L., & Maddison, S. T. 2008, A&A, 487, 265
- Lecavelier Des Etangs et al. (1998) Lecavelier Des Etangs, A., Vidal-Madjar, A., & Ferlet, R. 1998, A&A, 339, 477
- Leinhardt et al. (2008) Leinhardt, Z. M., Stewart, S. T., & Schultz, P. H. 2008, in The Solar System Beyond Neptune, edited by A. Barucci, H. Boehnhardt, D. Cruikshank, & A. Morbidelli, Tucson, Univ. of Arizona Press, p. 195
- Leinhardt & Stewart (2009) Leinhardt, Z. M., & Stewart, S. T. 2008, Icarus, 199, 542
- Lestrade et al. (2009) Lestrade, J.-F., Wyatt, M. C., Bertoldi, F., Menten, K. M., & Labaigt, G. 2009, å, 506, 1455
- Lissauer (1987) Lissauer, J. J. 1987, Icarus, 69, 249
- Löhne et al. (2008) Löhne, T., Krivov, A. V., & Rodmann, J. 2008, ApJ, 673, 1123
- Mamajek (2009) Mamajek, E. E. 2009, American Institute of Physics Conference Series, 1158, 3
- Marois et al. (2008) Marois, C., Macintosh, B., Barman, T., Zuckerman, B., Song, I., Patience, J., Lafrenière, D., & Doyon, R. 2008, Science, 322, 1348
- Matthews et al. (2007) Matthews, B. C., et al. 2007, PASP, 119, 842
- Meyer et al. (2006) Meyer, M. R., et al. 2006, PASP, 118, 1690
- Meyer et al. (2008) Meyer, M. R., et al. 2008, ApJ, 673, L181
- Morales et al. (2009) Morales, F. Y., et al. 2009, ApJ, 699, 1067
- Moran et al. (2004) Moran, S. M., Kuchner, M. J., & Holman, M. J. 2004, ApJ, 612, 1163
- Morbidelli et al. (2004) Morbidelli, A., Emel’yanenko, V. V., & Levison, H. F. 2004, MNRAS, 355, 935
- Morbidelli et al. (2009) Morbidelli, A., Bottke, W. F., Nesvorný, D., & Levison, H. F. 2009, Icarus, 204, 558
- Moór et al. (2006) Moór, A., Ábrahám, P., Derekas, A., Kiss, C., Kiss, L. L., Apai, D., Grady, C., & Henning, T. 2006, ApJ, 644, 525
- Moro-Martín & Malhotra (2005) Moro-Martín, A., & Malhotra, R. 2005, ApJ, 633, 1150
- Motte & André (2001) Motte, F., & André, P. 2001, A&A, 365, 440
- Mustill & Wyatt (2009) Mustill, A. J., & Wyatt, M. C. 2009, MNRAS, 1211
- Nagasawa et al. (2007) Nagasawa, M., Thommes, E. W., Kenyon, S. J., Bromley, B. C., & Lin, D. N. C. 2007, Protostars and Planets V, 639
- Najita & Williams (2005) Najita, J., & Williams, J. P. 2005, ApJ, 635, 625
- Nesvorny (2009) Nesvorny, D. 2009, AAS/Division for Planetary Sciences Meeting Abstracts, 41, #27.
- Nesvorný et al. (2006) Nesvorný, D., Vokrouhlický, D., Bottke, W. F., & Sykes, M. 2006, Icarus, 181, 107
- Nesvorný et al. (2008) Nesvorný, D., Bottke, W. F., Vokrouhlický, D., Sykes, M., Lien, D. J., & Stansberry, J. 2008, ApJ, 679, L143
- Nomura & Nakagawa (2006) Nomura, H., & Nakagawa, Y. 2006, ApJ, 640, 1099
- O’Brien & Greenberg (2003) O’Brien, D. P., & Greenberg, R. 2003, Icarus, 164, 334
- Ohtsuki (1992) Ohtsuki, K. 1992, Icarus, 98, 20
- Ohtsuki, Stewart, & Ida (2002) Ohtsuki, K., Stewart, G. R., & Ida, S. 2002, Icarus, 155, 436
- Osterloh & Beckwith (1995) Osterloh, M., & Beckwith, S. V. W. 1995, ApJ, 439, 288
- Plavchan et al. (2009) Plavchan, P., Werner, M. W., Chen, C. H., Stapelfeldt, K. R., Su, K. Y. L., Stauffer, J. R., & Song, I. 2009, ApJ, 698, 1068
- Quillen (2006) Quillen, A. C. 2006, MNRAS, 372, L14
- Rafikov (2003) Rafikov, R. R. 2003, AJ, 125, 942
- Rafikov (2004) Rafikov, R. R. 2004, AJ, 128, 1348
- Rebull et al. (2008) Rebull, L. M., et al. 2008, ApJ, 681, 1484
- Rhee et al. (2007) Rhee, J. H., Song, I., Zuckerman, B., & McElwain, M. 2007, ApJ, 660, 1556
- Rice et al. (2006) Rice, W. K. M., Lodato, G., Pringle, J. E., Armitage, P. J., & Bonnell, I. A. 2006, MNRAS, 372, L9
- Rieke et al. (2005) Rieke, G. H., Su, K. Y. L., Stansberry, J. A., Trilling, D., Bryden, G., Muzerolle, J., White, B., Gorlova, N., Young, E. T., Beichman, C. A., Stapelfeldt, K. R., & Hines, D. C. 2005, ApJ, 620, 1010
- Roccatagliata et al. (2009) Roccatagliata, V., Henning, T., Wolf, S., Rodmann, J., Corder, S., Carpenter, J. M., Meyer, M. R., & Dowell, D. 2009, A&A, 497, 409
- Safronov (1969) Safronov, V. S. 1969, Evolution of the Protoplanetary Cloud and Formation of the Earth and Planets, Nauka, Moscow [Translation 1972, NASA TT F-677]
- Schaefer et al. (2009) Schaefer, G. H., Dutrey, A., Guilloteau, S., Simon, M., & White, R. J. 2009, ApJ, 701, 698
- Scholz et al. (2006) Scholz, A., Jayawardhana, R., & Wood, K. 2006, ApJ, 645, 1498
- Siegler et al. (2007) Siegler, N., Muzerolle, J., Young, E. T., Rieke, G. H., Mamajek, E. E., Trilling, D. E., Gorlova, N., & Su, K. Y. L. 2007, ApJ, 654, 580
- Smith et al. (2008) Smith, R., Wyatt, M. C., & Dent, W. R. F. 2008, A&A, 485, 897
- Song et al. (2005) Song, I., Zuckerman, B., Weinberger, A. J., & Becklin, E. E. 2005, Nature, 436, 363
- Spaute et al. (1991) Spaute, D., Weidenschilling, S. J., Davis, D. R., & Marzari, F. 1991, Icarus, 92, 147
- Stauffer et al. (2005) Stauffer, J. R., et al. 2005, AJ, 130, 1834
- Stern & Colwell (1997) Stern, S. A., & Colwell, J. E. 1997a, AJ, 114, 841
- Su et al. (2005) Su, K. Y. L., et al. 2005, ApJ, 628, 487
- Su et al. (2006) Su, K. Y. L., et al. 2006, ApJ, 653, 675
- Su et al. (2009) Su, K. Y. L., et al. 2009, ApJ, 705, 314
- Takeuchi & Artymowicz (2001) Takeuchi, T., & Artymowicz, P. 2001, ApJ, 557, 990
- Tanaka et al. (1996) Tanaka, H., Inaba, S., & Nakazawa, K. 1996, Icarus, 123, 450
- Thébault & Augereau (2007) Thébault, P., & Augereau, J.-C. 2007, A&A, 472, 169
- Thébault & Wu (2008) Thébault, P., & Wu, Y. 2008, A&A, 481, 713
- Trilling et al. (2007) Trilling, D. E., et al. 2007, ApJ, 658, 1289
- Trilling et al. (2008) Trilling, D. E., et al. 2008, ApJ, 674, 1086
- Weidenschilling (1977a) Weidenschilling, S. J. 1977a, Astrophys Sp Sci, 51, 153
- Weidenschilling (1977b) Weidenschilling, S. J. 1977b, MNRAS, 180, 57
- Weidenschilling (1989) Weidenschilling, S. J. 1989, Icarus, 80, 179
- Weidenschilling et al. (1997) Weidenschilling, S. J., Spaute, D., Davis, D. R., Marzari, F., & Ohtsuki, K. 1997, Icarus, 128, 429
- Wetherill & Stewart (1993) Wetherill, G. W., & Stewart, G. R. 1993, Icarus, 106, 190
- Williams & Wetherill (1994) Williams, D. R., & Wetherill, G. W. 1994, Icarus, 107, 117
- Williams & Andrews (2006) Williams, J. P., & Andrews, S. M. 2006, ApJ, 653, 1480
- Wilner et al. (2002) Wilner, D. J., Holman, M. J., Kuchner, M. J., & Ho, P. T. P. 2002, ApJ, 569, 115
- Wyatt (2005) Wyatt, M. C. 2005, A&A, 433, 1007
- Wyatt (2006) Wyatt, M. C. 2006, ApJ, 639, 1153
- Wyatt (2008) Wyatt, M. C. 2008, ARA&A, 46, 339
- Wyatt & Dent (2002) Wyatt, M. C., & Dent, W. R. F. 2002, MNRAS, 334, 589
- Wyatt et al. (2007a) Wyatt, M. C., Smith, R., Greaves, J. S., Beichman, C. A., Bryden, G., & Lisse, C. M. 2007, ApJ, 658, 569
- Wyatt et al. (2007b) Wyatt, M. C., Smith, R., Su, K. Y. L., Rieke, G. H., Greaves, J. S., Beichman, C. A., & Bryden, G. 2007, ApJ, 663, 365
- Youdin (2008) Youdin, A. 2008, arXiv:0807.1114
| Stellar Mass in | |||||
|---|---|---|---|---|---|
| 1.0 | 1.5 | 2.0 | 2.5 | 3.0 | |
| 0.01 | 0.003 | 0.004 | 0.005 | 0.006 | 0.008 |
| 0.03 | 0.008 | 0.013 | 0.017 | 0.021 | 0.025 |
| 0.10 | 0.025 | 0.038 | 0.050 | 0.063 | 0.075 |
| 0.33 | 0.083 | 0.125 | 0.167 | 0.208 | 0.250 |
| 1.00 | 0.250 | 0.375 | 0.500 | 0.625 | 0.750 |
| 0.01 | 0.0003 | 0.0004 | 0.0006 | 0.0007 | 0.0009 |
| 0.03 | 0.001 | 0.0015 | 0.002 | 0.024 | 0.003 |
| 0.10 | 0.003 | 0.004 | 0.006 | 0.007 | 0.009 |
| 0.33 | 0.010 | 0.015 | 0.019 | 0.024 | 0.029 |
| 0.50 | 0.014 | 0.022 | 0.029 | 0.036 | 0.043 |
| 1.00 | 0.029 | 0.044 | 0.057 | 0.071 | 0.086 |
| 2.00 | 0.057 | 0.088 | 0.114 | 0.142 | 0.172 |
| 3.00 | 0.086 | 0.131 | 0.171 | 0.214 | 0.258 |
| 22Main sequence lifetime in Gyr (Demarque et al., 2004) | 10.00 | 2.90 | 1.22 | 0.65 | 0.39 |
| Stellar Mass in | |||||
|---|---|---|---|---|---|
| 1.0 | 1.5 | 2.0 | 2.5 | 3.0 | |
| , , = 1 km, | |||||
| 0.01 | 18 | 14 | 24 | 25 | 20 |
| 0.03 | 16 | 17 | 15 | 26 | 15 |
| 0.10 | 17 | 17 | 14 | 19 | 15 |
| 0.33 | 18 | 17 | 17 | 16 | 15 |
| 1.00 | 16 | 17 | 13 | 15 | 15 |
| , , = 1 km, | |||||
| 0.01 | 14 | 37 | 16 | 16 | 18 |
| 0.03 | 16 | 44 | 15 | 15 | 21 |
| 0.10 | 15 | 16 | 15 | 27 | 21 |
| 0.33 | 19 | 15 | 20 | 18 | 18 |
| 0.50 | 18 | 18 | 17 | 17 | 17 |
| 1.00 | 15 | 22 | 17 | 15 | 15 |
| 2.00 | 15 | 30 | 17 | 16 | 15 |
| 3.00 | 18 | 12 | 22 | 15 | 21 |
| , , = 1 km, | |||||
| 0.01 | 7 | 8 | 7 | 7 | 8 |
| 0.03 | 7 | 9 | 7 | 7 | 7 |
| 0.10 | 7 | 9 | 7 | 10 | 7 |
| 0.33 | 7 | 7 | 7 | 9 | 7 |
| 1.00 | 14 | 8 | 7 | 9 | 12 |
| 3.00 | 13 | 7 | 7 | 9 | 7 |
| , , = 1 km, | |||||
| 0.01 | 7 | 7 | 7 | 7 | 8 |
| 0.03 | 7 | 7 | 12 | 7 | 7 |
| 0.10 | 7 | 7 | 7 | 7 | 7 |
| 0.33 | 8 | 7 | 8 | 7 | 7 |
| 1.00 | 8 | 7 | 7 | 9 | 7 |
| 3.00 | 7 | 7 | 7 | 8 | 7 |
| , , = 10 km, | |||||
| 0.01 | 14 | 9 | 7 | 7 | 7 |
| 0.03 | 7 | 8 | 7 | 11 | 7 |
| 0.10 | 12 | 10 | 7 | 11 | 8 |
| 0.33 | 14 | 7 | 7 | 7 | 9 |
| 1.00 | 15 | 8 | 9 | 8 | 8 |
| 3.00 | 7 | 7 | 7 | 7 | 8 |
| , , = 100 km, | |||||
| 0.01 | 7 | 8 | 7 | 8 | 7 |
| 0.03 | 7 | 9 | 8 | 8 | 7 |
| 0.10 | 7 | 7 | 12 | 7 | 7 |
| 0.33 | 9 | 7 | 10 | 9 | 10 |
| 1.00 | 7 | 7 | 10 | 10 | 7 |
| 3.00 | 7 | 7 | 7 | 7 | 7 |
| Parameter | (1) | (2) | (3) | Notes |
|---|---|---|---|---|
| (g cm-2) | 30 | 30 | 30 | (3) |
| (Myr) | 10 | 145 | 400 | (4) |
| (km) | 3500 | 2000 | 1250 | |
| (g yr-1) | ||||
| (Myr) | 2 | 5 | 4.5 | |
| (M⊕) | 0.33 | 0.026 | 0.038 | |
| (M⊕) | 11 | 1.0 | 1.25 |
| Parameter | 1 km only | 10 km only | 100 km only | Notes |
|---|---|---|---|---|
| (Myr) | 325 | 1200 | 7500 | (3) |
| (km) | 3000 | 4000 | 6000 | |
| (g yr-1) | (4) | |||
| (Myr) | 45 | 275 | 2000 (3) | |
| (M⊕) | 0.017 | 0.0037 | ||
| (M⊕) | 0.56 | 0.20 | 0.033 |
| 30–37 AU | 37–45 AU | 45–55 AU | 55–67 AU | 67–82 AU | 82–100 AU | 100–123 AU | 123–146 AU | ||
|---|---|---|---|---|---|---|---|---|---|
| 1.0 | 0.01 | 5 | 5 | 5 | 1 | 0 | 0 | 0 | 0 |
| 0.03 | 25 | 30 | 22 | 26 | 23 | 13 | 2 | 0 | |
| 0.10 | 69 | 72 | 59 | 66 | 50 | 55 | 31 | 14 | |
| 0.33 | 137 | 224 | 174 | 216 | 201 | 115 | 97 | 58 | |
| 1.00 | 220 | 363 | 367 | 555 | 465 | 490 | 415 | 165 | |
| 1.5 | 0.01 | 3 | 4 | 7 | 0 | 5 | 0 | 0 | 0 |
| 0.03 | 17 | 19 | 14 | 3 | 0 | 0 | 0 | 0 | |
| 0.10 | 44 | 39 | 27 | 21 | 26 | 8 | 0 | 0 | |
| 0.33 | 98 | 53 | 63 | 136 | 57 | 26 | 11 | 6 | |
| 1.00 | 390 | 413 | 539 | 668 | 957 | 877 | 1253 | 279 | |
| 2.0 | 0.01 | 0 | 0 | 0 | 0 | 0 | 0 | 0 | 0 |
| 0.03 | 62 | 48 | 31 | 23 | 5 | 0 | 0 | 0 | |
| 0.10 | 155 | 151 | 134 | 137 | 103 | 68 | 6 | 0 | |
| 0.33 | 247 | 274 | 301 | 379 | 335 | 287 | 220 | 59 | |
| 1.00 | 358 | 257 | 591 | 1264 | 872 | 822 | 1261 | 476 | |
| 2.5 | 0.01 | 3 | 1 | 0 | 0 | 0 | 0 | 0 | 0 |
| 0.03 | 74 | 66 | 46 | 33 | 14 | 0 | 0 | 0 | |
| 0.10 | 146 | 194 | 177 | 243 | 171 | 130 | 73 | 0 | |
| 0.33 | 224 | 348 | 378 | 478 | 543 | 500 | 288 | 126 | |
| 1.00 | 443 | 743 | 827 | 763 | 1142 | 1083 | 1218 | 219 | |
| 3.0 | 0.01 | 1 | 0 | 0 | 0 | 0 | 0 | 0 | 0 |
| 0.03 | 59 | 89 | 59 | 28 | 5 | 0 | 0 | 0 | |
| 0.10 | 142 | 250 | 194 | 196 | 240 | 104 | 38 | 0 | |
| 0.33 | 207 | 459 | 431 | 433 | 605 | 760 | 523 | 214 | |
| 1.00 | 543 | 685 | 1039 | 1270 | 1625 | 2046 | 1428 | 862 |
| 30–37 AU | 37–45 AU | 45–55 AU | 55–67 AU | 67–82 AU | 82–100 AU | 100–123 AU | 123–146 AU | ||
|---|---|---|---|---|---|---|---|---|---|
| 1.0 | 0.01 | 0 | 0 | 0 | 0 | 0 | 0 | 0 | 0 |
| 0.03 | 0 | 0 | 0 | 0 | 0 | 0 | 0 | 0 | |
| 0.10 | 1 | 0 | 1 | 0 | 0 | 0 | 0 | 0 | |
| 0.33 | 8 | 11 | 15 | 6 | 5 | 5 | 1 | 0 | |
| 1.00 | 48 | 55 | 32 | 47 | 42 | 20 | 19 | 5 | |
| 3.00 | 100 | 187 | 115 | 228 | 95 | 103 | 92 | 23 | |
| 1.5 | 0.01 | 0 | 0 | 0 | 0 | 0 | 0 | 0 | 0 |
| 0.03 | 0 | 0 | 0 | 0 | 0 | 0 | 0 | 0 | |
| 0.10 | 0 | 0 | 0 | 0 | 0 | 0 | 0 | 0 | |
| 0.33 | 16 | 11 | 15 | 15 | 5 | 0 | 0 | 0 | |
| 1.00 | 57 | 82 | 71 | 55 | 43 | 30 | 17 | 2 | |
| 3.00 | 137 | 152 | 202 | 167 | 264 | 143 | 69 | 21 | |
| 2.0 | 0.01 | 0 | 0 | 0 | 0 | 0 | 0 | 0 | 0 |
| 0.03 | 0 | 0 | 0 | 0 | 0 | 0 | 0 | 0 | |
| 0.10 | 0 | 0 | 0 | 0 | 0 | 0 | 0 | 0 | |
| 0.33 | 27 | 15 | 2 | 1 | 0 | 0 | 0 | 0 | |
| 1.00 | 47 | 95 | 48 | 46 | 35 | 5 | 0 | 0 | |
| 3.00 | 118 | 212 | 202 | 219 | 130 | 152 | 51 | 6 | |
| 2.5 | 0.01 | 0 | 0 | 0 | 0 | 0 | 0 | 0 | 0 |
| 0.03 | 0 | 0 | 0 | 0 | 0 | 0 | 0 | 0 | |
| 0.10 | 0 | 0 | 0 | 0 | 0 | 0 | 0 | 0 | |
| 0.33 | 21 | 20 | 7 | 5 | 1 | 0 | 0 | 0 | |
| 1.00 | 90 | 99 | 87 | 93 | 61 | 17 | 3 | 0 | |
| 3.00 | 153 | 218 | 225 | 247 | 179 | 204 | 159 | 28 | |
| 3.0 | 0.01 | 0 | 0 | 0 | 0 | 0 | 0 | 0 | 0 |
| 0.03 | 0 | 0 | 0 | 0 | 0 | 0 | 0 | 0 | |
| 0.10 | 0 | 0 | 0 | 0 | 0 | 0 | 0 | 0 | |
| 0.33 | 33 | 23 | 5 | 1 | 0 | 0 | 0 | 0 | |
| 1.00 | 105 | 104 | 100 | 79 | 59 | 15 | 0 | 0 | |
| 3.00 | 233 | 179 | 362 | 311 | 266 | 159 | 158 | 0 |
| 30–37 AU | 37–45 AU | 45–55 AU | 55–67 AU | 67–82 AU | 82–100 AU | 100–123 AU | 123–146 AU | ||
|---|---|---|---|---|---|---|---|---|---|
| 1.0 | 0.01 | 0 | 0 | 0 | 0 | 0 | 0 | 0 | 0 |
| 0.03 | 8 | 0 | 0 | 0 | 0 | 0 | 0 | 0 | |
| 0.10 | 11 | 10 | 8 | 2 | 0 | 0 | 0 | 0 | |
| 1.5 | 0.01 | 0 | 0 | 0 | 0 | 0 | 0 | 0 | 0 |
| 0.03 | 0 | 0 | 0 | 0 | 0 | 0 | 0 | 0 | |
| 0.10 | 15 | 14 | 7 | 1 | 0 | 0 | 0 | 0 | |
| 2.0 | 0.01 | 0 | 0 | 0 | 0 | 0 | 0 | 0 | 0 |
| 0.03 | 0 | 0 | 0 | 0 | 0 | 0 | 0 | 0 | |
| 0.10 | 7 | 3 | 0 | 0 | 0 | 0 | 0 | 0 | |
| 2.5 | 0.01 | 0 | 0 | 0 | 0 | 0 | 0 | 0 | 0 |
| 0.03 | 0 | 0 | 0 | 0 | 0 | 0 | 0 | 0 | |
| 0.10 | 16 | 11 | 2 | 0 | 0 | 0 | 0 | 0 | |
| 3.0 | 0.01 | 0 | 0 | 0 | 0 | 0 | 0 | 0 | 0 |
| 0.03 | 0 | 0 | 0 | 0 | 0 | 0 | 0 | 0 | |
| 0.10 | 7 | 5 | 3 | 0 | 0 | 0 | 0 | 0 |
| 30–37 AU | 37–45 AU | 45–55 AU | 55–67 AU | 67–82 AU | 82–100 AU | 100–123 AU | 123–146 AU | ||
|---|---|---|---|---|---|---|---|---|---|
| 1.0 | 0.01 | 0 | 0 | 0 | 0 | 0 | 0 | 0 | 0 |
| 0.03 | 7 | 0 | 0 | 0 | 0 | 0 | 0 | 0 | |
| 0.10 | 11 | 10 | 3 | 0 | 0 | 0 | 0 | 0 | |
| 0.33 | 13 | 8 | 13 | 5 | 6 | 0 | 0 | 0 | |
| 1.00 | 32 | 13 | 17 | 5 | 8 | 8 | 1 | 0 | |
| 3.00 | 77 | 51 | 42 | 26 | 17 | 6 | 8 | 0 | |
| 1.5 | 0.01 | 0 | 0 | 0 | 0 | 0 | 0 | 0 | 0 |
| 0.03 | 1 | 0 | 0 | 0 | 0 | 0 | 0 | 0 | |
| 0.10 | 10 | 5 | 2 | 0 | 0 | 0 | 0 | 0 | |
| 0.33 | 23 | 26 | 10 | 10 | 0 | 0 | 0 | 0 | |
| 1.00 | 66 | 38 | 25 | 19 | 19 | 5 | 0 | 0 | |
| 3.00 | 134 | 133 | 118 | 69 | 46 | 17 | 10 | 0 | |
| 2.0 | 0.01 | 0 | 0 | 0 | 0 | 0 | 0 | 0 | 0 |
| 0.03 | 0 | 0 | 0 | 0 | 0 | 0 | 0 | 0 | |
| 0.10 | 10 | 0 | 0 | 0 | 0 | 0 | 0 | 0 | |
| 0.33 | 34 | 25 | 6 | 3 | 0 | 0 | 0 | 0 | |
| 1.00 | 92 | 50 | 23 | 27 | 7 | 0 | 0 | 0 | |
| 3.00 | 243 | 219 | 138 | 112 | 100 | 33 | 1 | 0 | |
| 2.5 | 0.01 | 0 | 0 | 0 | 0 | 0 | 0 | 0 | 0 |
| 0.03 | 0 | 0 | 0 | 0 | 0 | 0 | 0 | 0 | |
| 0.10 | 17 | 3 | 0 | 0 | 0 | 0 | 0 | 0 | |
| 0.33 | 30 | 33 | 29 | 5 | 0 | 0 | 0 | 0 | |
| 1.00 | 119 | 127 | 77 | 27 | 6 | 2 | 0 | 0 | |
| 3.00 | 378 | 243 | 378 | 107 | 71 | 57 | 11 | 0 | |
| 3.0 | 0.01 | 0 | 0 | 0 | 0 | 0 | 0 | 0 | 0 |
| 0.03 | 0 | 0 | 0 | 0 | 0 | 0 | 0 | 0 | |
| 0.10 | 15 | 2 | 0 | 0 | 0 | 0 | 0 | 0 | |
| 0.33 | 35 | 51 | 20 | 0 | 0 | 0 | 0 | 0 | |
| 1.00 | 152 | 177 | 109 | 80 | 20 | 0 | 0 | 0 | |
| 3.00 | 233 | 553 | 232 | 202 | 186 | 48 | 5 | 0 |
| 30–37 AU | 37–45 AU | 45–55 AU | 55–67 AU | 67–82 AU | 82–100 AU | 100–123 AU | 123–146 AU | ||
|---|---|---|---|---|---|---|---|---|---|
| 1.0 | 0.01 | 0 | 0 | 0 | 0 | 0 | 0 | 0 | 0 |
| 0.03 | 0 | 0 | 0 | 0 | 0 | 0 | 0 | 0 | |
| 0.10 | 8 | 1 | 0 | 0 | 0 | 0 | 0 | 0 | |
| 0.33 | 16 | 13 | 6 | 0 | 0 | 0 | 0 | 0 | |
| 1.00 | 35 | 29 | 42 | 17 | 1 | 0 | 0 | 0 | |
| 3.00 | 54 | 16 | 26 | 29 | 3 | 0 | 0 | 0 | |
| 1.5 | 0.01 | 0 | 0 | 0 | 0 | 0 | 0 | 0 | 0 |
| 0.03 | 0 | 0 | 0 | 0 | 0 | 0 | 0 | 0 | |
| 0.10 | 3 | 0 | 0 | 0 | 0 | 0 | 0 | 0 | |
| 0.33 | 23 | 13 | 8 | 0 | 0 | 0 | 0 | 0 | |
| 1.00 | 59 | 49 | 32 | 14 | 0 | 0 | 0 | 0 | |
| 3.00 | 97 | 139 | 158 | 66 | 174 | 0 | 0 | 0 | |
| 2.0 | 0.01 | 0 | 0 | 0 | 0 | 0 | 0 | 0 | 0 |
| 0.03 | 0 | 0 | 0 | 0 | 0 | 0 | 0 | 0 | |
| 0.10 | 0 | 0 | 0 | 0 | 0 | 0 | 0 | 0 | |
| 0.33 | 14 | 1 | 0 | 0 | 0 | 0 | 0 | 0 | |
| 1.00 | 35 | 34 | 8 | 0 | 0 | 0 | 0 | 0 | |
| 3.00 | 251 | 277 | 177 | 66 | 0 | 0 | 0 | 0 | |
| 2.5 | 0.01 | 0 | 0 | 0 | 0 | 0 | 0 | 0 | 0 |
| 0.03 | 0 | 0 | 0 | 0 | 0 | 0 | 0 | 0 | |
| 0.10 | 0 | 0 | 0 | 0 | 0 | 0 | 0 | 0 | |
| 0.33 | 19 | 8 | 0 | 0 | 0 | 0 | 0 | 0 | |
| 1.00 | 68 | 93 | 30 | 1 | 0 | 0 | 0 | 0 | |
| 3.00 | 177 | 66 | 100 | 317 | 31 | 0 | 0 | 0 | |
| 3.0 | 0.01 | 0 | 0 | 0 | 0 | 0 | 0 | 0 | 0 |
| 0.03 | 0 | 0 | 0 | 0 | 0 | 0 | 0 | 0 | |
| 0.10 | 0 | 0 | 0 | 0 | 0 | 0 | 0 | 0 | |
| 0.33 | 27 | 6 | 0 | 0 | 0 | 0 | 0 | 0 | |
| 1.00 | 54 | 88 | 36 | 1 | 0 | 0 | 0 | 0 | |
| 3.00 | 305 | 396 | 252 | 225 | 20 | 0 | 0 | 0 |
| 30–37 AU | 37–45 AU | 45–55 AU | 55–67 AU | 67–82 AU | 82–100 AU | 100–123 AU | 123–146 AU | ||
|---|---|---|---|---|---|---|---|---|---|
| 1.0 | 0.01 | 0 | 0 | 0 | 0 | 0 | 0 | 0 | 0 |
| 0.03 | 0 | 0 | 0 | 0 | 0 | 0 | 0 | 0 | |
| 0.10 | 0 | 0 | 0 | 0 | 0 | 0 | 0 | 0 | |
| 0.33 | 8 | 0 | 0 | 0 | 0 | 0 | 0 | 0 | |
| 1.00 | 324 | 177 | 23 | 0 | 0 | 0 | 0 | 0 | |
| 3.00 | 748 | 796 | 824 | 613 | 231 | 7 | 0 | 0 | |
| 1.5 | 0.01 | 0 | 0 | 0 | 0 | 0 | 0 | 0 | 0 |
| 0.03 | 0 | 0 | 0 | 0 | 0 | 0 | 0 | 0 | |
| 0.10 | 0 | 0 | 0 | 0 | 0 | 0 | 0 | 0 | |
| 0.33 | 0 | 0 | 0 | 0 | 0 | 0 | 0 | 0 | |
| 1.00 | 363 | 125 | 7 | 0 | 0 | 0 | 0 | 0 | |
| 3.00 | 1083 | 1235 | 993 | 468 | 14 | 0 | 0 | 0 | |
| 2.0 | 0.01 | 0 | 0 | 0 | 0 | 0 | 0 | 0 | 0 |
| 0.03 | 0 | 0 | 0 | 0 | 0 | 0 | 0 | 0 | |
| 0.10 | 0 | 0 | 0 | 0 | 0 | 0 | 0 | 0 | |
| 0.33 | 0 | 0 | 0 | 0 | 0 | 0 | 0 | 0 | |
| 1.00 | 83 | 0 | 0 | 0 | 0 | 0 | 0 | 0 | |
| 3.00 | 1288 | 1076 | 255 | 1 | 0 | 0 | 0 | 0 | |
| 2.5 | 0.01 | 0 | 0 | 0 | 0 | 0 | 0 | 0 | 0 |
| 0.03 | 0 | 0 | 0 | 0 | 0 | 0 | 0 | 0 | |
| 0.10 | 0 | 0 | 0 | 0 | 0 | 0 | 0 | 0 | |
| 0.33 | 0 | 0 | 0 | 0 | 0 | 0 | 0 | 0 | |
| 1.00 | 296 | 26 | 0 | 0 | 0 | 0 | 0 | 0 | |
| 3.00 | 1729 | 1629 | 870 | 51 | 0 | 0 | 0 | 0 | |
| 3.0 | 0.01 | 0 | 0 | 0 | 0 | 0 | 0 | 0 | 0 |
| 0.03 | 0 | 0 | 0 | 0 | 0 | 0 | 0 | 0 | |
| 0.10 | 0 | 0 | 0 | 0 | 0 | 0 | 0 | 0 | |
| 0.33 | 0 | 0 | 0 | 0 | 0 | 0 | 0 | 0 | |
| 1.00 | 381 | 57 | 0 | 0 | 0 | 0 | 0 | 0 | |
| 3.00 | 1981 | 1741 | 790 | 19 | 0 | 0 | 0 | 0 |
| log (yr) | log | log | log | log | log |
|---|---|---|---|---|---|
| = 0.01 | |||||
| 5.05 | -5.20 | 0.000 | 0.012 | 0.039 | 0.024 |
| 5.15 | -5.21 | 0.000 | 0.012 | 0.039 | 0.024 |
| 5.25 | -5.21 | 0.000 | 0.012 | 0.039 | 0.024 |
| 5.35 | -5.22 | 0.000 | 0.012 | 0.039 | 0.024 |
| 5.45 | -5.22 | 0.000 | 0.012 | 0.038 | 0.024 |
| = 0.10 | |||||
| 5.05 | -4.28 | 0.000 | 0.077 | 0.222 | 0.154 |
| 5.15 | -4.32 | 0.000 | 0.077 | 0.222 | 0.154 |
| 5.25 | -4.35 | 0.000 | 0.077 | 0.222 | 0.154 |
| 5.35 | -4.39 | 0.000 | 0.077 | 0.221 | 0.153 |
| 5.45 | -4.40 | 0.000 | 0.073 | 0.214 | 0.148 |
| = 1.00 | |||||
| 5.05 | -3.98 | 0.001 | 0.166 | 0.407 | 0.301 |
| 5.15 | -4.00 | 0.001 | 0.159 | 0.388 | 0.285 |
| 5.25 | -4.02 | 0.001 | 0.157 | 0.383 | 0.279 |
| 5.35 | -4.03 | 0.001 | 0.155 | 0.378 | 0.273 |
| 5.45 | -4.07 | 0.001 | 0.149 | 0.360 | 0.257 |
| log (yr) | log | log | log | log | log |
|---|---|---|---|---|---|
| = 0.01 | |||||
| 5.05 | -5.03 | 0.000 | 0.023 | 0.054 | 0.028 |
| 5.15 | -5.04 | 0.000 | 0.023 | 0.054 | 0.028 |
| 5.25 | -5.05 | 0.000 | 0.023 | 0.054 | 0.028 |
| 5.35 | -5.06 | 0.000 | 0.023 | 0.054 | 0.028 |
| 5.45 | -5.07 | 0.000 | 0.023 | 0.053 | 0.028 |
| = 0.10 | |||||
| 5.05 | -5.55 | 0.000 | 0.011 | 0.029 | 0.017 |
| 5.15 | -5.50 | 0.000 | 0.011 | 0.029 | 0.017 |
| 5.25 | -5.45 | 0.000 | 0.011 | 0.029 | 0.017 |
| 5.35 | -5.39 | 0.000 | 0.011 | 0.029 | 0.017 |
| 5.45 | -5.35 | 0.000 | 0.012 | 0.033 | 0.018 |
| = 1.00 | |||||
| 5.05 | -3.89 | 0.003 | 0.224 | 0.426 | 0.273 |
| 5.15 | -3.99 | 0.003 | 0.214 | 0.405 | 0.256 |
| 5.25 | -3.98 | 0.003 | 0.202 | 0.378 | 0.234 |
| 5.35 | -4.02 | 0.003 | 0.189 | 0.349 | 0.211 |
| 5.45 | -4.06 | 0.003 | 0.175 | 0.314 | 0.182 |
tablenotetextcThe typical inter-quartile range in the predicted fluxes is 5% to 10% at 24 m and 5% at 70–850 m.
| log (yr) | log | log | log | log | log |
|---|---|---|---|---|---|
| = 0.01 | |||||
| 5.05 | -4.91 | 0.001 | 0.034 | 0.065 | 0.031 |
| 5.15 | -4.92 | 0.001 | 0.034 | 0.065 | 0.031 |
| 5.25 | -4.94 | 0.001 | 0.034 | 0.065 | 0.031 |
| 5.35 | -4.95 | 0.001 | 0.034 | 0.065 | 0.031 |
| 5.45 | -4.96 | 0.001 | 0.033 | 0.063 | 0.030 |
| = 0.10 | |||||
| 5.05 | -3.99 | 0.003 | 0.186 | 0.334 | 0.185 |
| 5.15 | -4.08 | 0.003 | 0.181 | 0.324 | 0.180 |
| 5.25 | -4.16 | 0.003 | 0.176 | 0.314 | 0.175 |
| 5.35 | -4.18 | 0.002 | 0.161 | 0.293 | 0.162 |
| 5.45 | -4.21 | 0.002 | 0.155 | 0.285 | 0.158 |
| = 1.00 | |||||
| 5.05 | -3.86 | 0.006 | 0.254 | 0.415 | 0.241 |
| 5.15 | -3.97 | 0.006 | 0.243 | 0.394 | 0.225 |
| 5.25 | -4.00 | 0.006 | 0.226 | 0.358 | 0.198 |
| 5.35 | -4.04 | 0.006 | 0.213 | 0.332 | 0.178 |
| 5.45 | -3.88 | 0.021 | 0.363 | 0.443 | 0.220 |
tablenotetextcThe typical inter-quartile range in the predicted fluxes is 5% to 10% at 24 m and 5% at 70–850 m.
| log (yr) | log | log | log | log | log |
|---|---|---|---|---|---|
| = 0.01 | |||||
| 5.05 | -4.38 | 0.006 | 0.107 | 0.132 | 0.051 |
| 5.15 | -4.40 | 0.006 | 0.106 | 0.130 | 0.050 |
| 5.25 | -4.42 | 0.006 | 0.105 | 0.128 | 0.049 |
| 5.35 | -4.44 | 0.006 | 0.101 | 0.124 | 0.047 |
| 5.45 | -4.46 | 0.006 | 0.097 | 0.120 | 0.046 |
| = 0.10 | |||||
| 5.05 | -3.79 | 0.015 | 0.267 | 0.341 | 0.160 |
| 5.15 | -4.03 | 0.013 | 0.243 | 0.319 | 0.148 |
| 5.25 | -4.06 | 0.012 | 0.229 | 0.303 | 0.139 |
| 5.35 | -4.09 | 0.011 | 0.217 | 0.290 | 0.132 |
| 5.45 | -4.12 | 0.010 | 0.203 | 0.272 | 0.123 |
| = 1.00 | |||||
| 5.05 | -3.85 | 0.024 | 0.301 | 0.373 | 0.174 |
| 5.15 | -3.87 | 0.040 | 0.341 | 0.391 | 0.179 |
| 5.25 | -3.46 | 0.099 | 0.508 | 0.520 | 0.238 |
| 5.35 | -3.29 | 0.139 | 0.597 | 0.586 | 0.268 |
| 5.45 | -3.26 | 0.153 | 0.618 | 0.594 | 0.268 |
tablenotetextcThe typical inter-quartile range in the predicted fluxes is 5% to 10% at 24 m and 5% at 70–850 m.
| log (yr) | log | log | log | log | log |
|---|---|---|---|---|---|
| = 0.01 | |||||
| 5.05 | -6.05 | 0.000 | 0.002 | 0.005 | 0.003 |
| 5.15 | -6.06 | 0.000 | 0.002 | 0.005 | 0.003 |
| 5.25 | -6.06 | 0.000 | 0.002 | 0.005 | 0.003 |
| 5.35 | -6.06 | 0.000 | 0.002 | 0.005 | 0.003 |
| 5.45 | -6.06 | 0.000 | 0.002 | 0.005 | 0.003 |
| = 0.10 | |||||
| 5.05 | -5.07 | 0.000 | 0.017 | 0.049 | 0.029 |
| 5.15 | -5.08 | 0.000 | 0.017 | 0.049 | 0.029 |
| 5.25 | -5.09 | 0.000 | 0.017 | 0.049 | 0.029 |
| 5.35 | -5.10 | 0.000 | 0.016 | 0.058 | 0.029 |
| 5.45 | -5.10 | 0.000 | 0.016 | 0.047 | 0.028 |
| = 1.00 | |||||
| 5.05 | -4.18 | 0.000 | 0.093 | 0.250 | 0.162 |
| 5.15 | -4.22 | 0.000 | 0.091 | 0.245 | 0.160 |
| 5.25 | -4.27 | 0.000 | 0.089 | 0.240 | 0.158 |
| 5.35 | -4.31 | 0.000 | 0.087 | 0.235 | 0.156 |
| 5.45 | -4.34 | 0.000 | 0.085 | 0.230 | 0.154 |
| log (yr) | log | log | log | log | log |
|---|---|---|---|---|---|
| = 0.01 | |||||
| 5.05 | -5.88 | 0.000 | 0.004 | 0.008 | 0.004 |
| 5.15 | -5.88 | 0.000 | 0.004 | 0.008 | 0.004 |
| 5.25 | -5.88 | 0.000 | 0.004 | 0.008 | 0.004 |
| 5.35 | -5.89 | 0.000 | 0.004 | 0.008 | 0.004 |
| 5.45 | -5.89 | 0.000 | 0.004 | 0.008 | 0.004 |
| = 0.10 | |||||
| 5.05 | -4.89 | 0.000 | 0.031 | 0.065 | 0.033 |
| 5.15 | -4.91 | 0.000 | 0.031 | 0.065 | 0.033 |
| 5.25 | -4.93 | 0.000 | 0.031 | 0.065 | 0.033 |
| 5.35 | -4.95 | 0.000 | 0.030 | 0.064 | 0.032 |
| 5.45 | -4.96 | 0.000 | 0.029 | 0.062 | 0.032 |
| = 1.00 | |||||
| 5.05 | -4.04 | 0.001 | 0.141 | 0.285 | 0.168 |
| 5.15 | -4.13 | 0.001 | 0.141 | 0.285 | 0.168 |
| 5.25 | -4.21 | 0.001 | 0.141 | 0.285 | 0.168 |
| 5.35 | -4.23 | 0.001 | 0.133 | 0.273 | 0.161 |
| 5.45 | -4.25 | 0.001 | 0.125 | 0.261 | 0.154 |
| log (yr) | log | log | log | log | log |
|---|---|---|---|---|---|
| = 0.01 | |||||
| 5.05 | -4.91 | 0.001 | 0.034 | 0.065 | 0.031 |
| 5.15 | -4.92 | 0.001 | 0.034 | 0.065 | 0.031 |
| 5.25 | -4.94 | 0.001 | 0.034 | 0.065 | 0.031 |
| 5.35 | -4.95 | 0.001 | 0.034 | 0.065 | 0.031 |
| 5.45 | -4.96 | 0.001 | 0.033 | 0.063 | 0.030 |
| = 0.10 | |||||
| 5.05 | -3.99 | 0.003 | 0.176 | 0.314 | 0.175 |
| 5.15 | -4.08 | 0.003 | 0.176 | 0.314 | 0.175 |
| 5.25 | -4.16 | 0.003 | 0.176 | 0.314 | 0.175 |
| 5.35 | -4.18 | 0.003 | 0.161 | 0.293 | 0.162 |
| 5.45 | -4.21 | 0.003 | 0.155 | 0.284 | 0.158 |
| = 1.00 | |||||
| 5.05 | -3.86 | 0.006 | 0.254 | 0.415 | 0.241 |
| 5.15 | -3.97 | 0.006 | 0.243 | 0.394 | 0.225 |
| 5.25 | -4.00 | 0.006 | 0.226 | 0.358 | 0.198 |
| 5.35 | -4.04 | 0.006 | 0.213 | 0.332 | 0.178 |
| 5.45 | -3.88 | 0.021 | 0.363 | 0.443 | 0.220 |
| log (yr) | log | log | log | log | log |
|---|---|---|---|---|---|
| = 0.01 | |||||
| 5.05 | -4.38 | 0.005 | 0.113 | 0.136 | 0.053 |
| 5.15 | -4.40 | 0.005 | 0.109 | 0.132 | 0.051 |
| 5.25 | -4.42 | 0.005 | 0.105 | 0.128 | 0.049 |
| 5.35 | -4.44 | 0.005 | 0.101 | 0.124 | 0.047 |
| 5.45 | -4.46 | 0.005 | 0.097 | 0.120 | 0.045 |
| = 0.10 | |||||
| 5.05 | -4.00 | 0.014 | 0.257 | 0.335 | 0.157 |
| 5.15 | -4.03 | 0.013 | 0.243 | 0.319 | 0.148 |
| 5.25 | -4.06 | 0.012 | 0.229 | 0.303 | 0.139 |
| 5.35 | -4.09 | 0.011 | 0.217 | 0.290 | 0.132 |
| 5.45 | -4.12 | 0.010 | 0.203 | 0.272 | 0.123 |
| = 1.00 | |||||
| 5.05 | -3.85 | 0.024 | 0.301 | 0.373 | 0.174 |
| 5.15 | -3.87 | 0.040 | 0.341 | 0.391 | 0.179 |
| 5.25 | -3.46 | 0.099 | 0.508 | 0.520 | 0.238 |
| 5.35 | -3.29 | 0.139 | 0.597 | 0.586 | 0.268 |
| 5.45 | -3.26 | 0.153 | 0.618 | 0.594 | 0.268 |
| log (yr) | log | log | log | log | log |
|---|---|---|---|---|---|
| = 0.01 | |||||
| 5.05 | -6.05 | 0.000 | 0.002 | 0.005 | 0.003 |
| 5.15 | -6.06 | 0.000 | 0.002 | 0.005 | 0.003 |
| 5.25 | -6.06 | 0.000 | 0.002 | 0.005 | 0.003 |
| 5.35 | -6.06 | 0.000 | 0.002 | 0.005 | 0.003 |
| 5.45 | -6.06 | 0.000 | 0.002 | 0.005 | 0.003 |
| = 0.10 | |||||
| 5.05 | -5.06 | 0.000 | 0.017 | 0.049 | 0.029 |
| 5.15 | -5.08 | 0.000 | 0.017 | 0.049 | 0.029 |
| 5.25 | -5.09 | 0.000 | 0.017 | 0.049 | 0.029 |
| 5.35 | -5.10 | 0.000 | 0.017 | 0.048 | 0.029 |
| 5.45 | -5.10 | 0.000 | 0.016 | 0.047 | 0.028 |
| log (yr) | log | log | log | log | log |
|---|---|---|---|---|---|
| = 0.01 | |||||
| 5.05 | -5.88 | 0.000 | 0.004 | 0.008 | 0.004 |
| 5.15 | -5.88 | 0.000 | 0.004 | 0.008 | 0.004 |
| 5.25 | -5.88 | 0.000 | 0.004 | 0.008 | 0.004 |
| 5.35 | -5.88 | 0.000 | 0.004 | 0.008 | 0.004 |
| 5.45 | -5.89 | 0.000 | 0.004 | 0.008 | 0.004 |
| = 0.10 | |||||
| 5.05 | -4.89 | 0.000 | 0.031 | 0.065 | 0.033 |
| 5.15 | -4.90 | 0.000 | 0.031 | 0.065 | 0.033 |
| 5.25 | -4.92 | 0.000 | 0.031 | 0.065 | 0.033 |
| 5.35 | -4.94 | 0.000 | 0.031 | 0.065 | 0.033 |
| 5.45 | -4.95 | 0.000 | 0.030 | 0.063 | 0.032 |
| log (yr) | log | log | log | log | log |
|---|---|---|---|---|---|
| = 0.01 | |||||
| 5.05 | -5.75 | 0.000 | 0.005 | 0.010 | 0.004 |
| 5.15 | -5.76 | 0.000 | 0.005 | 0.010 | 0.004 |
| 5.25 | -5.76 | 0.000 | 0.005 | 0.010 | 0.004 |
| 5.35 | -5.76 | 0.000 | 0.005 | 0.010 | 0.004 |
| 5.45 | -5.77 | 0.000 | 0.005 | 0.010 | 0.004 |
| = 0.10 | |||||
| 5.05 | -4.77 | 0.001 | 0.044 | 0.079 | 0.036 |
| 5.15 | -4.80 | 0.001 | 0.044 | 0.079 | 0.036 |
| 5.25 | -4.83 | 0.001 | 0.044 | 0.079 | 0.036 |
| 5.35 | -4.84 | 0.001 | 0.042 | 0.077 | 0.035 |
| 5.45 | -4.86 | 0.001 | 0.040 | 0.074 | 0.034 |
| log (yr) | log | log | log | log | log |
|---|---|---|---|---|---|
| = 0.01 | |||||
| 5.05 | -5.58 | 0.000 | 0.008 | 0.010 | 0.004 |
| 5.15 | -5.58 | 0.000 | 0.008 | 0.010 | 0.004 |
| 5.25 | -5.59 | 0.000 | 0.008 | 0.010 | 0.004 |
| 5.35 | -5.59 | 0.000 | 0.008 | 0.010 | 0.004 |
| 5.45 | -5.60 | 0.000 | 0.008 | 0.010 | 0.004 |
| = 0.10 | |||||
| 5.05 | -4.59 | 0.003 | 0.067 | 0.085 | 0.034 |
| 5.15 | -4.62 | 0.003 | 0.065 | 0.083 | 0.033 |
| 5.25 | -4.66 | 0.003 | 0.063 | 0.081 | 0.032 |
| 5.35 | -4.70 | 0.003 | 0.061 | 0.079 | 0.030 |
| 5.45 | -4.72 | 0.003 | 0.059 | 0.076 | 0.029 |
| Parameter | (1) | (2) | (3) | Notes |
|---|---|---|---|---|
| Fragmentation () | ||||
| (g cm-2) | 30 | 30 | 30 | (c) |
| (Myr) | 7.5 | 25 | 10 | |
| log | (d) | |||
| 400 | 55 | 110 | (e) | |
| 600 | 65 | 80 | ||
| 200 | 40 | 40 | (f) | |
| 200 | 25 | 25 | (g) |
| Parameter | 1 km only | 10 km only | 100 km only | Notes |
|---|---|---|---|---|
| (Myr) | 9 | 50 | 325 | (c) |
| log | (d) | |||
| 80 | 15 | 2 | ||
| 65 | 15 | 2 | ||
| 30 | 10 | 2 | (e) | |
| 20 | 5 | 1.25 | (f) |