11email: apalau@laeff.inta.es 22institutetext: Departament d’Astronomia i Meteorologia (IEEC-UB), Institut de Ciències del Cosmos, Universitat de Barcelona, Martí i Franquès, 1, E-08028 Barcelona, Spain 33institutetext: Harvard-Smithsonian Center for Astrophysics, 60 Garden Street, Cambridge, MA 02138, USA 44institutetext: Academia Sinica, Institute of Astronomy and Astrophysics, P.O. Box 23-141, Taipei 106, Taiwan 55institutetext: INAF, Osservatorio Astrofisico di Arcetri, Largo E. Fermi 5, 50125 Firenze, Italy 66institutetext: Max-Planck-Institut for Astronomy, Knigstuhl 17, 69117 Heidelberg, Germany
Three intermediate-mass YSOs with different properties emerging from the same natal cloud in IRAS 00117+6412††thanks: The fits files for Figs. 1, 2, and 4 are also available in electronic format at the CDS via anonymous ftp to cdsarc.u-strasbg.fr (130.79.128.5) or via http://cdsweb.u-strasbg.fr/cgi-bin/qcat?J/A+A/.
Abstract
Aims. Our main aim is to study the influence of the initial conditions of a cloud in the intermediate/high-mass star formation process.
Methods. We observed with the VLA, PdBI, and SMA the centimeter and millimeter continuum, N2H+ (1–0), and CO (2–1) emission associated with a dusty cloud harboring a nascent cluster with intermediate-mass protostars.
Results. At centimeter wavelengths we found a strong source, tracing a UCH ii region, at the eastern edge of the dusty cloud, with a shell-like structure, and with the near-infrared counterpart falling in the center of the shell. This is presumably the most massive source of the forming cluster. About to the west of the UCH ii region and well embedded in the dusty cloud, we detected a strong millimeter source, MM1, associated with centimeter and near-infrared emission. MM1 seems to be driving a prominent high-velocity CO bipolar outflow elongated in the northeast-southwest direction, and is embedded in a ridge of dense gas traced by N2H+, elongated roughly in the same direction as the outflow. We estimated that MM1 is an intermediate-mass source in the Class 0/I phase. About to the south of MM1, and still more deeply embedded in the dusty cloud, we detected a compact millimeter source, MM2, with neither centimeter nor near-infrared emission, but with water maser emission. MM2 is associated with a clump of N2H+, whose kinematics reveal a clear velocity gradient and additionally we found signposts of infall motions. MM2, being deeply embedded within the dusty cloud, with an associated water maser but no hints of CO outflow emission, is an intriguing object, presumably of intermediate mass.
Conclusions. The UCH ii region is found at the border of a dusty cloud which is currently undergoing active star formation. Two intermediate-mass protostars in the dusty cloud seem to have formed after the UCH ii region and have different properties related to the outflow phenomenon. Thus, a single cloud with similar dust emission and similar dense gas column densities seems to be forming objects with different properties, suggesting that the initial conditions in the cloud are not determining all the star formation process.
Key Words.:
Stars: formation – ISM: dust – ISM: H ii regions – ISM: individual objects: IRAS 00117+6412 – Radio continuum: ISM| Epoch of | Phase Calibrators | Flux | Beam | P.A. | cont. rms | |||||
| (cm) | Obs | Config | Observation | (Bootstrapped Flux, Jy) | Calibrators | () | () | (m) | Ref. | |
| 6.0 | VLA | C | 2006 Oct 27 | 0102+584 () | 3C48 | 0.03 | 1 | |||
| 3.6 | VLA | B | 1992 Jan 6 | 2230+697 () | 3C48 | 0.10 | 3 | |||
| 3.6 | VLA | C | 2006 Oct 27 | 0102+584 () | 3C48 | 0.02 | 1 | |||
| 3.6 | VLA | D | 2004 Jul 10+13 | 0102+584 () | 3C48 | 0.04 | 2 | |||
| 1.3 | VLA | Ca | 1992 May 25 | 0228+673 () | 3C48 | 0.6 | 3 | |||
| 1.3 | VLA | D | 2004 Jul 10+13 | 0102+584 () | 3C48 | 0.07 | 2 | |||
| 0.7 | VLA | D | 2007 May 12 | 0102+584 () | 3C286 | 0.17 | 1 | |||
| 0.32 | PdBI | CD | 2004 Oct 17 + Dec 7 | 0212+735 () | MWC349 | 0.18 | 1 | |||
| 2145+067 | ||||||||||
| 0.12 | PdBI | CD | 2004 Oct 17 + Dec 7 | 0212+735 () | MWC349 | 1.0 | 1 | |||
| 2145+067 | ||||||||||
| 0.13 | SMA | compact | 2007 Jun 28 | 0102+584 () | Uranus | 0.8 | 1 | |||
| 0014+612 () | ||||||||||
-
a
Data from the VLA archive. The low sensitivity of the archival dataset does not allow to obtain better maps (when we combined the C and D configuration data) than previous VLA-D data maps (Sánchez-Monge et al. sanchezmonge2008 (2008)).
-
References:
(1) This work, (2) Sánchez-Monge et al. sanchezmonge2008 (2008), (3) VLA archival data.
1 Introduction
It is well established that intermediate (2–8 ) and high-mass ( ) stars form in cluster environments (e. g., Kurtz et al. kurtz2000 (2000); Evans et al. evans2009 (2009)), and that at the very first stages of their formation, they are embedded within dense and cold gas and dust from their original natal cloud. However, it is not clear to what extent the initial conditions of the natal cloud are determining the star formation story of the cloud and the properties of the nascent stars of low, intermediate, and high mass, forming within it. Regarding the star formation story, there is increasing evidence that a single cloud can undergo different episodes of star formation, as suggested by studies of deeply embedded clusters observed at spatial scales similar to the cluster member separation ( AU). In these studies, the intermediate/high-mass young stellar objects (YSOs) in the forming cluster seem to be in different evolutionary stages (judging from the peak of their spectral energy distributions: Beuther et al. beuther2007 (2007); Palau et al. 2007a ,b; Leurini et al. leurini2007 (2007); Williams et al. williams2009 (2009)).
Concerning the properties of the intermediate/high-mass YSOs forming within the cloud, a few studies toward massive star-forming regions have revealed that two objects formed in the same environment may have very different properties in the ejection of matter, with one YSO driving a highly collimated outflow nearby another YSO driving an almost spherical mass ejection (e. g., Torrelles et al. torrelles2001 (2001), torrelles2003 (2003); Zapata et al. zapata2008 (2008)), indicating that the initial conditions in the cloud may not be the only agent determining the formation and evolution of the intermediate/high-mass members in a forming cluster. While most of these cases have been found at very high spatial scales ( AU), a broad observational base in other regions and at other spatial scales is required to properly understand the role of initial conditions of the cloud in the cluster formation process and ultimately in the formation of intermediate/high-mass stars.
In this paper we show a high angular resolution study of a deeply embedded cluster whose intermediate-mass protostars show differences not only in their spectral energy distributions, but also in the ejection phenomena associated with the YSOs. The region, IRAS 00117+6412, was selected from the list of Molinari et al. (molinari1996 (1996)) in a search for deeply embedded clusters which are luminous ( ) and nearby (distance kpc). The IRAS source has a bolometric luminosity of 1400 and is located at a distance of 1.8 kpc (Molinari et al. molinari1996 (1996)). The millimeter single-dish image reported by Sánchez-Monge et al. (sanchezmonge2008 (2008)) shows strong emission with some substructure, tracing a dusty cloud, and the centimeter emission reveals an ultra-compact H ii (UCH ii) region, associated with the brightest 2MASS source of the field at the eastern border of the dusty cloud. The dusty cloud is associated with an embedded cluster reported by Kumar et al. (kumar2006 (2006)), two H2O masers spots (Cesaroni et al. cesaroni1988 (1988); Wouterloot et al. wouterloot1993 (1993)), and CO (2–1) bipolar outflow emission (Zhang et al. zhang2005 (2005); Kim & Kurtz kimkurtz2006 (2006)). All this is suggestive of the dusty cloud harboring a UCH ii region and a deeply embedded stellar cluster forming in its surroundings.
We conducted high-sensitivity radio interferometric observations in order to study the different millimeter sources embedded in the dusty cloud. To properly characterize the protostars, we also studied the distribution of dense gas, outflow and ionized gas emission. In the present paper we show the first results obtained from N2H+ dense gas and CO outflow emission, focusing mainly on the intermediate/high-mass content of the protocluster.
2 Observations
2.1 Very Large Array observations
IRAS 00117+6412 was observed with the Very Large Array (VLA111The Very Large Array (VLA) is operated by the National Radio Astronomy Observatory (NRAO), a facility of the National Science Foundation operated under cooperative agreement by Associated Universities, Inc.) at 6 and 3.6 cm with 5–8 EVLA antennae in the array. The phase center of these observations was , and . The integration time was about 45 minutes at both wavelengths. Absolute flux calibration was achieved by observing 3C48, with an adopted flux density of 5.48 Jy at 6 cm, and 3.15 Jy at 3.6 cm. The data reduction followed the VLA standard guidelines for calibration and imaging, using the NRAO package AIPS. Images were performed using different weightings. The robust parameter of Briggs (briggs1995 (1995)) was set equal to 1 and 3 (almost natural) respectively at 6 and 3.6 cm. The configuration of the array, observing dates, phase calibrator and bootstrapped fluxes, synthesized beams and the continuum rms noise achieved are listed in Table 1.
The observations at 7 mm (together with NH3 and SiO molecular line observations, Busquet et al. in prep.) were carried out with 9 EVLA antennae in the array. In order to minimize the effects of atmospheric fluctuations, we used the technique of fast switching (Carilli & Holdaway carilliholdaway1997 (1997)) between the source and the phase calibrator over a cycle of 120 seconds, with 80 seconds spent on the target and 40 seconds on the calibrator. The on-source integration time was about 1.8 hours. Absolute flux and phase calibrations were achieved by observing 3C286 (1.45 Jy) and 0102+584 (see Table 1). Data reduction was performed following the VLA guidelines for the calibration of high frequency data, using the NRAO package AIPS. The image was constructed using natural weighting and tapering the uv-data at 50 k to increase the signal-to-noise ratio.
Searching the archive of the VLA, we found B-array data at 3.6 cm and C-array data at 1.3 cm observed in 1992 (project AC295). The data were reduced with the standard AIPS procedures.
 |
2.2 Plateau de Bure Interferometer observations
The continuum emission at 3 and 1.2 mm was observed simultaneously together with the N2H+ (1–0), and CS (5–4) molecular transitions with the Plateau de Bure Interferometer (PdBI222The Plateau de Bure Interferometer (PdBI) is operated by the Institut de Radioastronomie Millimetrique (IRAM), which is supported by INSU/CNRS (France), MPG (Germany), and IGN (Spain).). The observations were carried out during 2004 October 17 and December 7, with the array in the D (5 antennae) and C (6 antennae) configurations, respectively. The phase center was , and , and the projected baselines ranged from 24.0 to 229.0 m. The system temperatures were K for the receiver at 3.2 mm, and K for the receiver at 1.2 mm for both days. Atmospheric phase correction based on the 1.2 mm total power was applied. The receiver at 3.2 mm was tuned to 93.17378 GHz (lower sideband) to cover the N2H+ (1–0) transition, for which we used a correlator unit of 20 MHz of bandwidth and 512 spectral channels, providing a spectral resolution of 0.04 MHz (0.13 km s-1). The receiver at 1.2 mm was tuned to 244.93556 GHz (upper sideband), covering the CS (5–4) transition, and the CH3OH 50–40 A+ and 5-1–4-1 E transitions. The CS and CH3OH line emission at 1.2 mm will be presented in a subsequent paper (Busquet et al., in prep.). For the continuum measurements we used two correlator units of 320 MHz in each band for both receivers. The FWHM of the primary beam was at 3.2 mm, and at 1.2 mm.
| Wavelength | Beam | P.A. | rms | a | a | Deconv. Size | P.A. | |||
|---|---|---|---|---|---|---|---|---|---|---|
| (cm) | Instrument | () | () | (Jy beam-1) | (mJy beam-1) | (mJy) | () | () | ||
| \adl@mkpreaml\@addtopreamble\@arstrut\@preamble | \adl@mkpreaml\@addtopreamble\@arstrut\@preamble | |||||||||
| \adl@mkpreaml\@addtopreamble\@arstrut\@preamble | ||||||||||
| 6.0 | VLA-C | |||||||||
| 3.6 | VLA-CD | |||||||||
| 3.6 | VLA-BCD | |||||||||
| 1.3c | VLA-D | |||||||||
| 0.7 | VLA-D | |||||||||
| 0.32 | PdBI-CD | … | … | … | ||||||
| 0.13 | SMA-comp | … | … | … | ||||||
| 0.12d | PdBI-CD | … | … | … | ||||||
| \adl@mkpreaml\@addtopreamble \@arstrut\@preamble | \adl@mkpreaml\@addtopreamble\@arstrut\@preamble | |||||||||
| \adl@mkpreaml\@addtopreamble\@arstrut\@preamble | ||||||||||
| 6.0 | VLA-C | … | … | … | ||||||
| 3.6 | VLA-CD | |||||||||
| 3.6 | VLA-BCD | |||||||||
| 1.3 | VLA-D | … | … | … | ||||||
| 0.7 | VLA-D | … | … | … | ||||||
| 0.32 | PdBI-CD | |||||||||
| 0.13 | SMA-comp | |||||||||
| 0.12d | PdBI-CD | |||||||||
| \adl@mkpreaml\@addtopreamble \@arstrut\@preamble | \adl@mkpreaml\@addtopreamble\@arstrut\@preamble | |||||||||
| \adl@mkpreaml\@addtopreamble\@arstrut\@preamble | ||||||||||
| 6.0 | VLA-C | … | … | … | ||||||
| 3.6 | VLA-CD | … | … | … | ||||||
| 3.6 | VLA-BCD | … | … | … | ||||||
| 1.3 | VLA-D | … | … | … | ||||||
| 0.7 | VLA-D | … | … | … | ||||||
| 0.32 | PdBI-CD | |||||||||
| 0.13 | SMA-comp | |||||||||
| 0.12d | PdBI-CD | |||||||||
-
a
Primary beam corrected (mainly affecting the millimeter data). In case of non-detection at one of the frequencies, an upper limit of 4 was used. Error in intensity is . Error in flux density has been calculated as , where is the rms noise level of the map, and are the size of the source and the beam respectively, and is the error in the flux scale, which takes into account the uncertainty on the calibration applied to the flux density of the source ().
- b
- c
-
d
1.2 mm PdBI continuum map done with natural weighting; for flux densities and coordinates for the different subcondensations detected in the uniform-weighted map, see Table 3.
Bandpass calibration was performed by observing 3C454.3 for October 17 and 2145+067 for December 7. We used the source 0212+735 to calibrate the phases and amplitudes of the antennae for both days. The rms noise of the phases was for the data at 3.2 mm and at 1.2 mm. The absolute flux density scale, calibrated with MWC349 on October 17 and 2145+067 on December 7, has an estimated uncertainty of around 15%. Data were calibrated using CLIC and imaged with MAPPING, both part of the GILDAS software package. Imaging of the 3 and 1.2 mm emission was performed using natural and uniform weighting, respectively. See Table 1 for details on the synthesized beams and the rms noises.
| \adl@mkpreamc\@addtopreamble\@arstrut\@preamble | b | b | Deconv. Sizec | P.A.c | Menvd | |||
|---|---|---|---|---|---|---|---|---|
| Source | (m) | (mJy) | () | (°) | () | |||
| MM1-maine | 00 14 26.051 | 64 28 43.69 | 1.46 | |||||
| MM1-S | 00 14 26.065 | 64 28 42.26 | 0.20 | |||||
| MM1-SW | 00 14 25.861 | 64 28 42.25 | 0.24 | |||||
-
a
Synthesized beam of the uniform-weighted map is with P.A.°. The rms noise level of the map is 1.11 mJy beam-1.
-
b
Primary beam corrected. Error in intensity and flux density as in Table 2.
-
c
Deconvolved sizes and P.A. obtained from a fit with two Gaussian for MM1-main, and one single Gaussian for MM1-S and MM1-SW.
-
d
Masses derived assuming a dust mass opacity coeffecient at 1.2 mm of 0.9 g cm-1 (agglomerated grains with thin ice mantles in cores of densities cm-3, Ossenkopf & Henning ossenkopfhenning1994 (1994)), and a dust temperature of 30 K. The uncertainty in the masses due to the opacity law is estimated to be of a factor of 2.
-
e
Throughout all the text, we refer to MM1-main as MM1, for simplicity.
2.3 Submillimeter Array observations
The Submillimeter Array (SMA333The SMA is a joint project between the Smithsonian Astrophysical Observatory and the Academia Sinica Institute of Astronomy and Astrophysics, and is funded by the Smithsonian Institution and the Academia Sinica.; Ho et al. ho2004 (2004)) in the compact configuration was used to observe the 1.3 mm continuum emission and the 12CO (2–1) molecular transition line (centered at 230.538 GHz, upper sideband) on 2007 June 28. The phase center of the observations was , and , and the projected baselines ranged from 9 to 78 k (12–101 m). System temperatures ranged between 80 and 200 K. The zenith opacities, measured with the NRAO tipping radiometer located at the Caltech Submillimeter Observatory, were good during the track, with (225 GHz). The correlator, with a bandwidth of 1.968 GHz, was set to the standard mode, which provided a spectral resolution of 0.8125 MHz (or 1.06 km s-1 per channel) across the full bandwidth. The FWHM of the primary beam at 230 GHz was . The flagging and calibration of the data were done with the MIR-IDL444The MIR cookbook by Charlie Qi can be found at http://cfa-www.harvard.edu/cqi/mircook.html package. The passband response was obtained from observations of 3C454.3. The baseline-based calibration of the amplitudes and phases was performed using the sources 0102+584 and 0014+612. Flux calibration was set by using Uranus, and the uncertainty in the absolute flux density scale was %. Imaging and data analysis were conducted using the standard procedures in MIRIAD (Sault et al. sault1995 (1995)) and AIPS (see Table 1 for details). The continuum was obtained by averaging all the line-free channels of the upper sideband and the lower sideband.
3 Results
3.1 Centimeter continuum emission
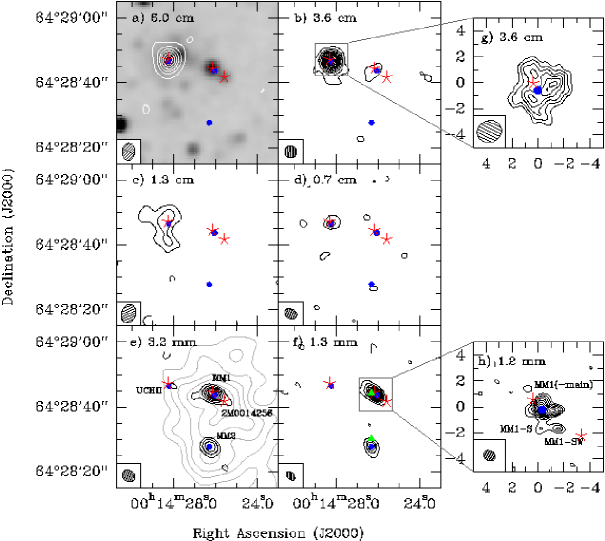
We detected centimeter radio continuum emission at all wavelengths. In Fig. 1a we show the 6 cm continuum emission of the region. The field is dominated by a strong and compact source associated with the brightest infrared source in the field, which is the counterpart of the UCH ii region detected at 3.6 cm by Sánchez-Monge et al. (sanchezmonge2008 (2008)). Additionally, the wide field of the VLA at 6 cm allows us to detect two unresolved sources to the north and east of the UCH ii region. The northern one, with the coordinates of (J2000.0) = 00h14m03s.21, and (J2000.0) = +643226.5, has a primary beam corrected flux density of mJy. The eastern one, with the coordinates of (J2000.0) = 00h14m57s.69, and (J2000.0) = +642849.6, has a primary beam corrected flux density of mJy. Both sources are outside the region shown in Fig. 1a.
At 3.6 cm, we improved the angular resolution of previous observations by a factor of five. These observations reveal two sources in the field: an eastern source coincident with the UCH ii region, and a second and fainter source located to the west. Fig. 1b shows the resulting image after combining the new VLA C-configuration observations with previous VLA D-configuration observations (Sánchez-Monge et al. sanchezmonge2008 (2008)). Since the combined dataset has a better uv-coverage, we recovered faint structure to the south of the UCH ii region similar to the double-source structure detected at 1.3 cm by Sánchez-Monge et al. (sanchezmonge2008 (2008)). The faint source to the west of the UCH ii region is coincident with the main 1.2 mm peak detected with the IRAM 30 m telescope (Sánchez-Monge et al. sanchezmonge2008 (2008)). By combining the 3.6 cm VLA-C and VLA-D datasets with archival VLA-B data we improved the angular resolution up to . With this angular resolution, the faint source to the west of the UCH ii region is marginally detected, and the UCH ii region shows a shell morphology with three main peaks and with the 2MASS source falling at the center of the peaks (see Fig. 1g).
In Fig. 1c we show, for completeness’ sake, the 1.3 cm continuum emission map from Sánchez-Monge et al. (sanchezmonge2008 (2008)). At 7 mm we detected one compact source at the position of the UCH ii region (Fig. 1d).
In Table 2 we summarize the main results of the sources detected in the region at different wavelengths. The Table gives for each source the coordinates, peak intensity, flux density, deconvolved size and position angle.
 |
|
 |
3.2 Millimeter continuum emission
Figure 1e shows the 3.2 mm PdBI continuum emission of the region. There are two compact strong sources at 3.2 mm: the strongest source, MM1, lying to the west of the UCH ii region; and the other source, MM2, being located to the south of MM1. The peak of MM1 is associated with the faint 3.6 cm source shown in Fig. 1b and with a near-infrared 2MASS source. MM1 is partially extended to the southwest, also spatially coincident with a second infrared source detected in the 2MASS (J+), hereafter 2M0014256 (cf. Fig. 1e). Note that the -2MASS image shows no infrared emission toward MM2 (cf. Fig.1a).
The SMA map at 1.3 mm shows two compact sources clearly associated with MM1 and MM2 (Fig. 1f). The 1.2 mm maps from the PdBI, with an angular resolution three times better than the SMA images, but only covering the region of MM1 within the primary beam of , show that this source splits up into at least three subcondensations: a compact core, MM1-main, elongated in the east-west direction and with faint extensions towards the north and the south; a faint 4 source about to the south of MM1-main, MM1-S; and a faint source at 5 located to the southwest of MM1-main, MM1-SW (see Fig. 1h and Table 3). We note that the PdBI 1 mm and SMA 1 mm flux densities are completely consistent, if we take into account that the PdBI is filtering out emission at smaller scales than the SMA. Throughout all the paper we will refer to MM1-main as MM1.
In Table 2 we summarize the main results of the sources detected in the region at millimeter wavelengths (see Sect. 3.1 for a description of the table). For both MM1 and MM2, we estimated the mass of the dust component assuming dust temperatures of 30 K and 20 K for MM1 and MM2, respectively (as a first approximation, since MM1 is associated with near-infrared emission, while MM2 is not), and a dust mass opacity coefficient at 1.3 mm of 0.9 g cm-1 (agglomerated grains with thin ice mantles in cores of densities cm-3, Ossenkopf & Henning ossenkopfhenning1994 (1994)). With these assumptions, we estimated a mass for MM1 of , and a mass for MM2 of (both derived from the (SMA) flux at 1.3 mm given in Table 2). In order to properly estimate the spectral index between 3.2 mm (PdBI) and 1.3 mm (SMA), we made the SMA image using the same -range as the PdBI data (9–72 k). By measuring the flux densities in the maps in the common -range, we obtained a spectral index of for MM1 and for MM2. Finally, we estimated the fraction of missing flux resolved out by the SMA at 1.3 mm by comparing the total flux of MM1 plus MM2 with the flux density measured with the IRAM 30 m Telescope of 1.2 Jy (Sánchez-Monge et al. sanchezmonge2008 (2008)), and found that the fraction of flux filtered out by the SMA is 92%.
3.3 N2H+ emission
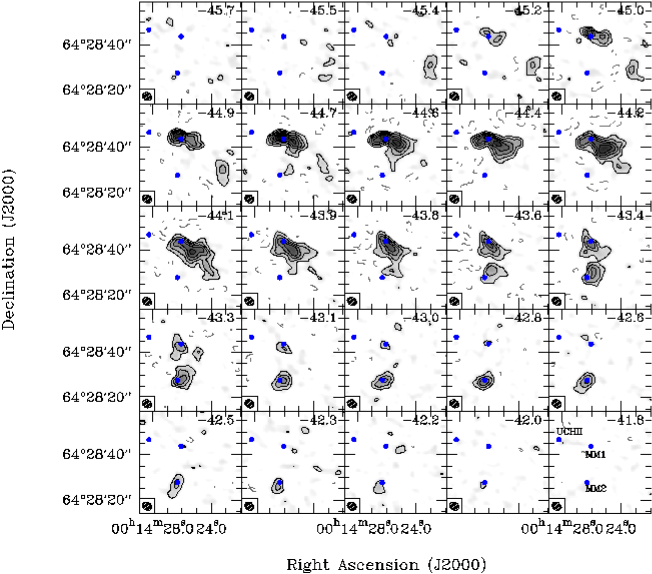
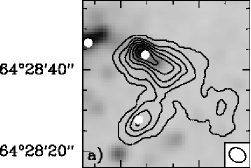
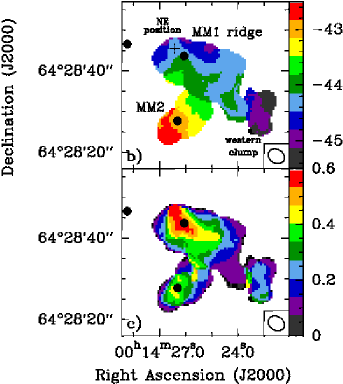
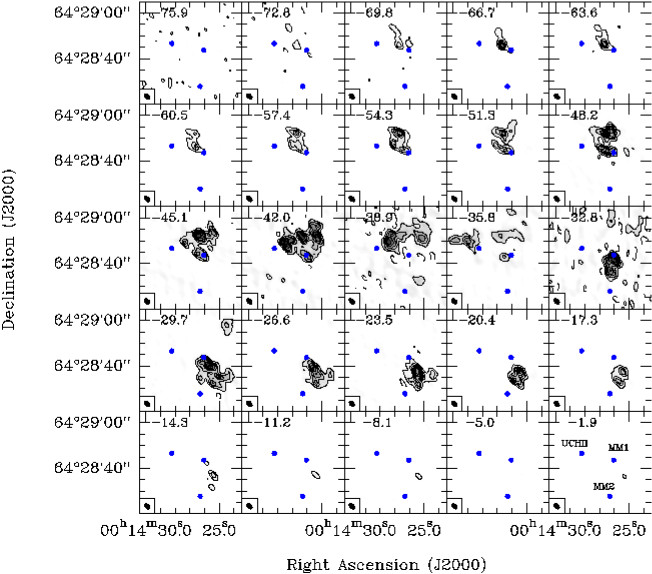
Figure 2 shows the N2H+ (1–0) channel maps of the hyperfine line (hereafter, the ‘isolated’ hyperfine) toward IRAS 00117+6412. Close to the systemic velocity555The systemic velocity for IRAS 00117+6412 is km s-1 (Molinari et al. molinari1996 (1996); Zhang et al. zhang2005 (2005)), and the N2H+ (1–0) hyperfine adopted as reference line in this work was . However, since the hyperfine adopted as reference is blended with two other hyperfines, we will make our analysis with the hyperfine which is isolated, the line, which is at 8 km s-1 with respect to the line adopted as reference. Therefore, the reference velocity (corresponding to the systemic velocity) in the analysis of the N2H+ emission from the isolated hyperfine is km s-1. and spanning km s-1, the emission appears as a ridge at the MM1 position (labeled as the MM1 ridge) and is elongated roughly in the east-west direction (PA). While at redshifted velocities the emission is only associated with MM2 (hereafter, the MM2 clump), the most blueshifted velocities show some faint emission towards the west of MM2 (western clump). The zero-order moment map integrated for the isolated hyperfine of N2H+(1–0) is presented in Fig. 3a, overlaid on a -band image of 2MASS. The MM1 ridge has a length of and the crest is coinciding well with the peak and elongation of the 3.2 mm continuum emission (Fig. 1e). As for the MM2 clump, it has a size of , with the peak position also coinciding with the millimeter peak, and is elongated in the southeast-northwest direction (PA). Finally, it is worth noting that the MM2 clump and the western clump fall at a region which is completely dark in the near-infrared, as seen in the -2MASS image of Fig. 3a.
3.4 CO (2–1) emission
Channel maps of the CO (2–1) emission are displayed in Fig. 4. The CO (2–1) emission appears spanning a wide range of velocities, from up to km s-1 (systemic velocity at km s-1). Blueshifted emission appears in different clumps toward the north and northeast of MM1, while redshifted emission appears toward the southwest of MM1, suggesting a bipolar structure centered on MM1.
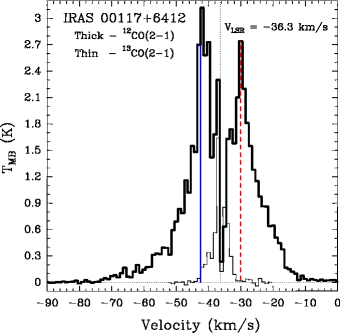
The spectrum of the emission integrated over all the region is shown in Fig. 5, together with a preliminary spectrum of 13CO (Busquet et al., in prep.). The CO spectrum shows a dip from up to km s-1 with respect to the systemic velocity, which could be due to self-absorption by cold foreground gas or opacity effects, as the dip is coincident with the peak of the 13CO line. We note that the dip could be partially produced by the missing short-spacing information in the interferometer data as well. In order to make a rough estimate of the fraction of flux filtered out by the SMA (due to the lack of sampling at spacings smaller than 9 k), we compared the single-dish spectrum (from Zhang et al. zhang2005 (2005)) at certain velocities with the SMA spectrum (extracted from the channel maps of Fig. 4 convolved to the single-dish beam, of ) at the position of the IRAS source. The missing flux is around 99% for the systemic velocities, indicating that at these velocities the CO emission mainly comes from structures much larger than , which is the largest angular scale observable by an interferometer whose shortest baseline is k (see Appendix for details). On the other hand, the missing flux decreases as one moves to higher velocities. For example, the fraction of missing flux goes down to 50% at and 5 km s-1 (with respect to the systemic velocity) for the blueshifted and redshifted sides, respectively; and the SMA recovers all the single-dish flux at and 7 km s-1 with respect to the systemic velocity. This indicates that the high-velocity CO (2–1) emission has a characteristic source size .
 |
4 Analysis
4.1 N2H+ kinematics: moments and pv-plots
In order to study the kinematics of the dense gas as traced by N2H+, we computed the first-order moment for the isolated hyperfine of N2H+(1–0), which does not suffer from blending with other hyperfines (Fig. 3b). The first-order moment map shows a velocity gradient in the MM1 ridge, spanning velocities of to km s-1, centered approximately on MM1, and perpendicular to the elongation of the ridge. Another clear velocity gradient can be seen toward MM2 at red velocities, from to km s-1. Note that both velocity gradients observed toward MM1 and MM2 have the blueshifted velocities toward the northwest and the redshifted velocities toward the southeast. In Fig. 3c we show the second-order moment map of the region, tracing the velocity dispersion, which is largest toward MM1 and MM2, and in general along the MM1 ridge, reaching (linewidth) values of 0.9–1.4 km s-1, much larger than the thermal linewidth for N2H+, of around 0.22 km s-1 at 30 K. The western clump is the more quiescent emission in the region, with linewidths of up to 0.6 km s-1. In addition, the first-order moment reveals an abrupt change in velocity in the western clump (Fig. 3b), which could be indicative of the clump being kinematically decoupled from the MM1 ridge and the MM2 clump.
 |
 |
| Velocityc | Linewidthc | (N2H+) | ||||||
| Object | Linea | (K km s-1) | (km s-1) | (km s-1) | b | (K) | (cm-2) | |
| MM1 | 1 | 3.1 | ||||||
| 2 | 3.4 | |||||||
| MM1-NE | 1 | 3.3 | ||||||
| 2 | 3.2 | |||||||
| MM2 | 3.1 | |||||||
-
a
For MM1 and the NE position of the MM1 ridge, the hyperfine structure is fitted with two velocity components. For MM2 the fit is made with one single velocity component.
-
b
. is the optical depth of the main hyperfine, adopted to be the line. The otpical depth of the isolated line can be obtained by multiplying by the factor 3/7.
-
c
When errors are not given, the velocity and linewidth have been fixed from a fit of two Gaussian to the isolated line. When errors are given, the fit of two Gaussian to the isolated line was used to provide initial values for the velocity and linewidth of the hyperfine fit.
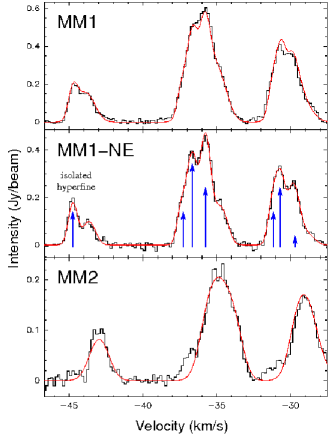
In Fig. 6 we show the N2H+ spectra for MM1, for a position in the northeastern (NE) side of the MM1 ridge (see positions in Fig. 3b), and for MM2. Note that the lines are broad, as can be seen in the isolated hyperfine line (at km s-1), and suggestive of a double velocity component. See Sects. 4.2 and 4.3 for a further analysis and discussion on these spectra.
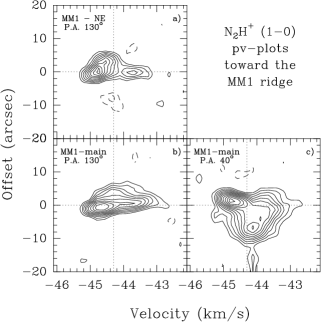
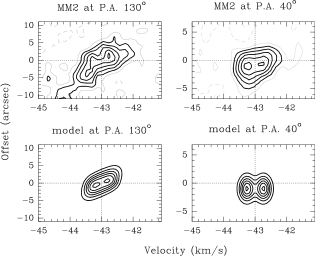
We additionally built position-velocity (pv) cuts to further study the kinematics of the region. In Fig. 7 we show two cuts in the direction of the velocity gradient seen in the MM1 ridge (at PA°, for MM1 and a position to the NE of MM1, see positions in Fig. 3b), and one cut along the elongation of the ridge (PA=40°). The three cuts show emission spanning from to km s-1, with one compact component at the blueshifted velocities of ()–() km s-1, and a broad red component at km s-1. The emission from the NE position and from MM1 follow the same general trend of a blue component with a small velocity gradient and a red broad component with no gradient (better seen in the cut of the NE position, Fig. 7a). For the perpendicular cut (PA=40°, centered on MM1, Fig. 7c), we also find a velocity gradient with the redshifted velocities at negative values, or to the southwest of the cut, and the blueshifted toward the northeast. Regarding MM2, the velocity gradient is also measured at a PA=130°, coincident with the elongation of the MM2 clump (Fig. 3b), and is well seen in the pv-plot at PA=130°, with a double peak (Fig. 8-top). However, the perpendicular cut does not show any gradient, although the double peak is also there. We refer the reader to the subsequent sections for the interpretation of the kinematics of the N2H+ dense gas toward MM1 and MM2.
 |
4.2 N2H+ kinematics: MM1 ridge
In order to fit the hyperfine spectra toward MM1 and the NE position of the ridge (spectra shown in Fig. 6), we assumed two velocity components. We initially fitted two Gaussian to the isolated line to estimate the initial values of the velocities and linewidths for the two velocity components. With these initial values, we fitted the hyperfine spectra with two velocity components for the NE position and MM1. The results are listed in Table 4 and shown in Fig. 6. The fits can reproduce the data reasonably well.
For MM1, the derived two velocity components at km s-1, with a linewidth of km s-1, and km s-1, with a linewidth of km s-1, were already seen in the pv-plots of MM1 at PA=130° shown in Fig. 7 (note that in Fig. 7 we show the isolated line, which was not taken as the reference line, and the component fitted at km s-1 corresponds to km s-1, while the component at km s-1 corresponds to km s-1 in the pv-plot). For the NE position of the ridge, the two velocity components are found again around and km s-1, and the redshifted component has a broader linewidth than the blueshifted component, as in the MM1 spectrum. We note that the red component is optically thinner than the main component. This red component, which shows no velocity gradient, could be tracing a filament intercepting the line of sight maybe connecting the MM1 ridge and MM2, as the velocity of this red component is similar to the velocity of MM2. Finally, we showed in Sect. 4.1 (Fig. 7a) that the blue component (corresponding to the strongest component in the spectra) has a small velocity gradient which could be tracing the global rotation of the MM1 ridge.
In Table 4 we also list the excitation temperature derived from the fits and the N2H+ column density calculated assuming that the filling factor is and following Caselli et al. (2002b ). We note that the excitation temperature of K, and the N2H+ column densities are similar to the values found in low-mass star-forming regions (e. g., Caselli et al. 2002a ; Chen et al. chen2007 (2007); Kirk et al. kirk2009 (2009)), and slightly smaller than the values found in massive star-forming regions observed with interferometers (e. g., Palau et al. 2007a ; Beuther & Henning beutherhenning2009 (2009)). The small excitation temperature obtained is suggestive of either low density and/or cold gas. Note however that our values could be affected by the missing flux problem caused by the lack of short -spacings in the interferometric data (for the PdB, the largest angular scale detectable is , see Appendix, while in Palau et al. (2007a ) and Beuther & Henning (beutherhenning2009 (2009)), the largest angular scale was 20–, which means that our PdB data are more affected by the missing flux problem).
| Parameter | Value | Fixed/free parameter and comments | |
|---|---|---|---|
| Disk central velocity (km s-1) | Fixed from observed PA=40° pv-plot | ||
| Disk outer radius (′′, adopted as reference radius) | Fixed from emission size | ||
| Disk inner radius (′′) | Fixed: upper limit from SMA data (see main text) | ||
| Intensity power law index | Fixed following other studies of disk-like structures (see main text) | ||
| Infall velocity power law index | Fixed, free-fall | ||
| Rotation velocity power law index | Fixed, solid rigid rotation | ||
| Reference infall velocity (km s-1) | Free: fitted in the PA=40° pv-plot | ||
| Reference rotation velocity (km s-1) | Free: fitted in the PA=130° pv-plot, after fitting the ref. infall vel. | ||
 |
| size | a | a | a | a | a | a | a | |||
| Lobe | (yr) | (arcsec) | (cm-2) | () | ( yr-1) | ( km s-1) | ( km s-1 yr-1) | (erg) | () | |
| Red | 3600 | 0.05 | 1.2 | 0.46 | ||||||
| Blue | 3300 | 0.05 | 1.4 | 0.85 | ||||||
| All | 3500 | 0.10 | 2.6 | 1.31 | ||||||
-
a
Parameters are calculated for an inclination with respect to the plane of the sky equal to 0°, and are corrected for opacity effects. refers to CO column density.
 |
4.3 N2H+ kinematics: MM2
We fitted the N2H+ (1–0) spectrum toward MM2 with a single velocity component (Fig. 6-bottom). As can be seen in the figure, there is some excess of emission at blueshifted velocities, which could be contamination from the MM1 ridge (which has an extension toward the south at blueshifted velocitites with respect to the MM2 clump, at around ()–() km s-1, as seen in Fig. 2). Alghough the excess of emission is quite clear, a fit with two velocity components for the MM2 N2H+ hyperfine spectrum could not be well determined666This is because the two-velocity-components hyperfine fit is strongly dependent on the adopted initial values. For the case of MM1 and the NE position of the MM1 ridge, this problem was solved by fitting two Gaussian to the line which is isolated, for which both velocity components are well detected. However, in the case of MM2, the velocity component at km s-1 is barely detected in the isolated line (see Fig. 6-bottom), hindering the estimate of the initial values.. From the parameters obtained from the fit, we derived the excitation temperature and N2H+ column density as in the previous section, and the values found for MM2 are very similar to the values found for MM1.
In order to further constrain the N2H+ kinematics toward MM2, we approached the flattened structure seen in N2H+ to a model of a spatially infinitely thin disk seen edge-on, with a power-law intensity as function of radius, consisting of a superposition of optically thin rings undergoing infall and rotation (also described as power-laws). We computed the synthetic pv-plots along the projected major and minor axes of the disk, with angular and spectral resolutions of and km s-1, respectively. The modeled emission is shown in Fig. 8-bottom, and the adopted/fitted parameters are listed in Table 5.
The disk structure is modeled with an inner and outer radius. The outer radius is constrained from the N2H+ emission in the observed pv-plot, and is also taken as the reference radius for the rotation and infall power-laws. The intensity power-law index was adopted to be , as used in other models of disk-like structures around intermediate/high-mass YSOs (e. g., Beltrán et al. beltran2004 (2004)). For the infall we assumed a free-fall infall velocity, and for the rotation law we assumed a solid rigid rotation, as recent studies show that these initial conditions are able to account for most observational properties of star-forming cores (e. g., Tscharnuter et al. tscharnuter2009 (2009); Walch et al. walch2009 (2009); Zhilkin et al. zhilkin2009 (2009)). The free parameters are the reference infall velocity and the reference rotation velocity.
We constrained the upper limit of the inner radius from the SMA map at 1 mm, which has an angular resolution of , and hence any inner gap must have a radius . On the other hand, the N2H+ data further constrain the inner radius to , as a smaller inner radius clearly cannot reproduce the double peak in the PA=130° pv-plot. We conclude that the inner radius covers the range of 0.8–, and adopted the mean value of . We derived the reference infall velocity from the PA=40° pv-plot (only affected by infall), of km s-1. We note that to include infall in the model is necessary in order to reproduce the double peak seen in the pv-plot at PA=40°. Finally, we fitted the rotation velocity from the PA=130° pv-plot (affected by both infall and rotation). We note that in the PA=130° pv-plot the velocity component at could be contaminated by the MM1 ridge, and hence we focused our fit on the two central peaks at around km s-1. The resulting reference rotation velocity is km s-1. We also note that if we fit the data adopting an inner radius of or , the new parameters are similar, within the uncertainties, to the parameters derived for an inner radius of .
 |
 |
From the fitted infall velocity, one can estimate the mass of the central object by using , with being the inclination angle to the plane of the sky. Thus, taking km s-1 at a reference radius of , and assuming an inclination of 90°, we obtain a mass , where the lower limit accounts for the inclination assumption. We note that the true mass however is likely not larger than a few tenths of solar mass, because we estimated the inclination of the MM2 N2H+ core from its deconvolved major and minor axis (), and obtained an inclination, assuming it is intrinsically circular, of °, which is very close to the assumed inclination. It is interesting to compare the mass derived from infall, which is indicative of the mass already accreted onto the protostellar core, with the mass derived from the millimeter continuum emission for MM2 (around 1.7 , Sect. 3.2), which is tracing the mass of the envelope and disk surrounding the central core. For Class 0 sources it is typically assumed that these two masses should be of the same order. Thus, the obtained accreted mass smaller than the disk+envelope mass is suggesting that the central protostellar object in MM2 has just recently formed.
4.4 CO kinematics: moments and pv-plots
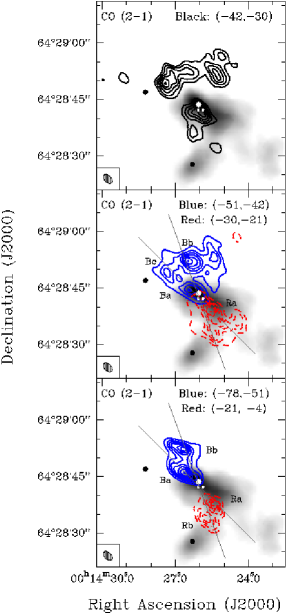
We constructed the zero-order moment maps of the CO emission integrated over three different velocity ranges: (1) systemic velocities from to km s-1 with respect to the systemic velocity (Fig. 9-top), (2) moderate velocities from to km s-1, and from to km s-1 with respect to the systemic velocity (Fig. 9-middle), and (3) high velocities from km s-1 to most negative velocities, and from km s-1 to most positive velocities with respect to the systemic velocity (Fig. 9-bottom). At systemic velocities the emission appears concentrated in two main structures, a clump associated with the N2H+ MM1 ridge, and a multipeaked-arch located to the north of MM1, just bordering the N2H+ emission. At moderate and high velocities, which are less affected by the missing short spacings in the interferometric data, the emission has a bipolar structure centered near the position of MM1 and is elongated in the northeast-southwest direction (see Fig. 9-middle and bottom). At blue moderate velocities, the emission splits up into two main peaks: Ba, close to the position of MM1 and elongated in the northeast-southwest direction, and Bb, located northwards of MM1 and with a round shape. A third fainter clump, Bc, is located to the northeast of MM1. Regarding the redshifted emission, it appears as an elongated cone-like structure, with one main clump, Ra, which is well aligned with the Ba clump, with a position angle of °, and centered toward the southwest of MM1. At higher velocities, the emission is found toward Ba, Bb, Ra, and toward a second redshifted clump, Rb, which was not very prominent at moderate velocities. Clumps Bb and Rb are aligned at a position angle of °, and centered near MM1. Note that the position angles of the high-velocity CO emission are almost perpendicular to the direction of the N2H+ velocity gradient, found at °.
| 2MASS | \adl@mkpreamc\@addtopreamble\@arstrut\@preamble | |||||||||
|---|---|---|---|---|---|---|---|---|---|---|
| Source | Identification | colora | colora | IRexcessb | ||||||
| UCH ii | 00 14 28.29 | 64 28 47.19 | ||||||||
| MM1 | 00 14 26.16 | 64 28 44.44 | ||||||||
| 2M0014256 | 00 14 25.59 | 64 28 41.70 | ||||||||
-
a
Uncertainties in the colors are typically mag.
-
b
The infrared excess is measured as the difference between the color and the color corresponding to a reddened main-sequence star (following the reddening law of Rieke & Lebofsky riekelebofsky1985 (1985)), i. e., .
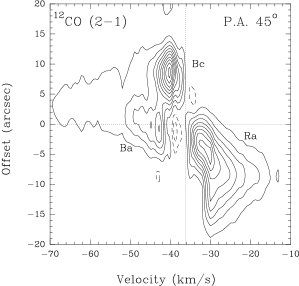
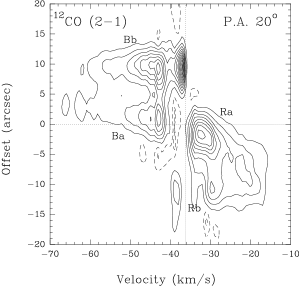
We performed different pv-plots close to MM1 at PA=45°, and PA=20°(see Fig. 10), in the two directions indicated in Fig. 9. Both pv-plots have been convolved with a Gaussian ( at PA=135° and 110°, respectively). In both plots, positive and negative positions correspond respectively to northeastern and southwestern positions with respect to MM1. In the first cut (45°) we can distinguish a strong velocity gradient from clump Ra to clump Ba, with velocities increasing with distance, following a Hubble-law pattern (up to 34 km s-1 with respect to the systemic velocity in the case of clump Ba). We note that in the cut at PA=45°, the clump Bc shows moderate velocity emission of up to 14 km s-1 with respect to the systemic velocity. Regarding the pv plot at PA=20°, the redshifted emission and the blueshifted clump Ba also follow a Hubble-law, as in the cut at 45°.
We calculated the energetics of the outflow for each blue and red lobe separately (for the blue lobe we included both clumps Ba and Bb), assuming that all the emission comes from a single outflow, and listed the values in Table 6. The expressions used to calculate the outflow CO column density, , from the transition , and the outflow mass, , are given in Palau et al. (2007b ). We adopted an opacity in the line wings of (from preliminary 13CO data), and an excitation temperature of K, estimated from the spectrum in Fig. 5 (assuming that CO is optically thick and adopting a line temperature of 2.7 K). For the red lobe we integrated from to km s-1, and for the blue lobe from to km s-1. The dynamical timescale of the outflow, , was derived by dividing the size of each lobe by the maximum velocity reached in the outflow with respect to the systemic velocity ( km s-1 for the red lobe, and km s-1 for the blue lobe).
4.5 IRAS, MSX and 2MASS emission
With the aim of finding the possible infrared counterparts of the sources studied in this work, we searched the IRAS, MSX and 2MASS surveys (the region has not been observed by Spitzer). While the IRAS position error ellipse makes it difficult to disentangle the contribution from the UCH ii region and MM1, we superposed the MSX emission on our millimeter maps and found that the MSX emission is compact and clearly peaking at the UCH ii region. Thus, this is suggestive of the major part of the IRAS and MSX fluxes, at least up to m, coming from the UCH ii region. However, at 60 and 100 m the contribution of the UCH ii region and MM1 is not clear, and for this reason we refrained from building the spectral energy distributions. As for the 2MASS Point Source Catalog (Skrutskie et al. skrutskie2006 (2006)), in Table 7 we show the 2MASS photometry for the 2MASS counterparts of the UCH ii region, MM1, and for 2M0014256. From the 2MASS magnitudes, we estimated the () and () colors and measured the infrared excess as the difference between the () color and the () color corresponding to a reddened main-sequence star (following the reddening law of Rieke & Lebofsky riekelebofsky1985 (1985)). The 2MASS sources associated with the UCH ii region and MM1 show a moderate infrared excess typical of Class II sources, while 2M0014256 seems to be a reddened main-sequence star, or a Class III source. A detailed analysis of the low-mass content of the forming cluster in IRAS 00117+6412 will be presented in a subsequent paper (Busquet et al., in prep.).
5 Discussion
5.1 A shell-like UCH ii region
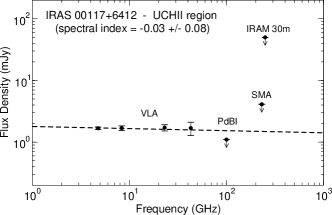
The centimeter range (from 6 cm up to 7 mm) of the spectral energy distribution of the UCH ii region can be fitted assuming free-free optically thin emission from ionized gas with a spectral index of (see Fig. 11; the spectral index was calculated from the fluxes measured in the images at 6, 3.6, 1.3 cm and 7 mm made with the -range shared at all the wavelengths, 4.35–55 k). We calculated the physical parameters of the H ii region at 3.6 cm (in the CD configuration) assuming the emission is optically thin. The results are consistent with a UCH ii region with a size of pc, a brightness temperature of 12.4 K, an emission measure of cm-6 pc, an electron density of 2000 cm-3, a mass of inonized gas of (estimated from the beam averaged electron density and the observed size of the source), and a flux of ionizing photons of s-1. These parameteres are consistent with a UCH ii region driven by an early-type B2 star (from Panagia panagia1973 (1973)), as already stated by Sánchez-Monge et al. (sanchezmonge2008 (2008)).
The high angular resolution centimeter observations presented in this work reveal that the UCH ii region reported in Sánchez-Monge et al. (sanchezmonge2008 (2008)) already has a shell-like structure. The average radius of the shell (from an average of the three subcondensations) is , which corresponds to 2200 AU or 0.01 pc. From this radius, one can make a rough estimate of the dynamical timescale, either assuming a classical expansion of an HII region at km s-1, or the expansion of a wind-driven bubble (as typically assumed to explain the shell-like morphologies of UCH ii regions, e. g., Garay & Lizano garaylizano1999 (1999)). In the first case (classical HII region), the dynamical timescale is yr, while in the second case (stellar wind blown bubble) the dynamical timescale is yr (assuming the stellar wind dominates over the classical expansion of the UCH ii region, an initial ambient density of cm-3, and following Castor et al. castor1975 (1975), and Garay & Lizano garaylizano1999 (1999), yielding an expanding velocity km s-1). The lifetimes derived from both assumptions are much smaller than Myr, the lifetime estimate for UCH ii regions of , from the RMS survey by Mottram et al. 2009 (in prep.). This could be indicative of the UCH ii region in IRAS 00117+6412 having undergone in the past a period of strong quenching (due to a high-mass accretion rate, Walmsley et al. walmsley1995 (1995)), before expanding as a classical HII region or as a wind-blown bubble. Alternatively, if the classical HII region expansion or the wind-blown bubble assumptions are correct, we could be witnessing the very first stages of the expansion of an ionized shell around a B2-type ( ) YSO. However, the fact that we do not detect significant dust or dense gas emission associated with the UCH ii region suggests that the object is in the process of disrupting its natal cloud, and most likely has a lifetime similar to the Myr given by Mottram et al. (2009, in prep.). In addition, diffuse optical emission can be seen to the northeast of the UCH ii region in the blue and red plates of the Palomar Observatory Sky Survey II, supporting the fact that the UCH ii region is not deeply embedded and is emerging from its natal cloud.
From the bolometric luminosity and the spectral type of the UCH ii region one can estimate the mass and the evolution time from the birthline by placing the object in a HR diagram. Following the models of Palla & Stahler (pallastahler1990 (1990), pallastahler1993 (1993)), and adopting an effective temperature of K (Panagia panagia1973 (1973)), the mass of the star ionizing the UCH ii region is about 5–6 , and the star is already placed at the ZAMS, which most likely is reached after Myr for a star of this mass (e. g., Palla & Stahler pallastahler1993 (1993); Bernasconi & Maeder bernasconimaeder1996 (1996)). This estimate agrees with the previous estimate of the lifetime of a UCH ii region of (derived from Mottram et al. 2009, in prep.) of Myr.
 |
5.2 MM1: multiple sources and a spectacular outflow
In previous sections we showed that MM1 is associated with a 2MASS source with infrared excess. Dense gas emission traced by N2H+ and faint centimeter emission are also associated with MM1. These properties suggest that MM1 is most likely in a phase of moderate/intense accretion, possibly in the Class 0/I stage, with typical ages of (0.5–1) yr (e. g., Evans et al. evans2009 (2009)). On the other hand, the estimated envelope mass of 3.0 and the magnitude of the near-infrared emission (similar to the magnitudes of the UCH ii region, which has a luminosity of ) are suggestive of MM1 being possibly an intermediate-mass YSO. In particular, from the outflow momentum rate () we can estimate the luminosity of the object powering the outflow (assuming one single outflow). Using the relation from Hatchell et al. (hatchell2007 (2007)) we obtain , and with the relation from Bontemps et al. (bontemps1996 (1996)) we obtain , consistent with a driving source of intermediate mass.
We note that concerning the driving source(s) of the outflow(s), we discard 2M0014256 as a possible candidate because its near-infrared excess is much smaller than that of MM1 (see Table 7), and lies slightly off from the line joining the high-velocity clumps Ba and Ra, or Bb and Rb. The only aspect suggestive of 2M0014256 being associated with the star-forming region is the elongation seen at 3.2 mm, which matches well with the position of the 2MASS source (see Fig. 1e). However, such an elongation at 3.2 mm could be tracing dust entrained by the outflow, as the elongation and the Ba and Ra lobes are very well aligned. If 2M0014256 was really associated with the region one would expect some compact emission associated with it in the 1 mm continuum maps (which have higher angular resolution than the 3.2 mm continuum maps), but as this is not found, it suggests that the elongation is made of extended emission.
Another aspect favoring the scenario that MM1 could be the driving source of the outflow is that MM1 is associated with centimeter emission, typically found toward Class 0/I sources driving outflows. Since we only detect the source in the centimeter range at 3.6 cm we can only estimate a range of possible spectral indices, , which is consistent with thermal free-free emission from ionized gas (the spectral index was calculated from the images at 6, 3.6, and 1.3 cm made with the same -range). The fact that the centimeter source is elongated in a position angle of °, almost perpendicular to the CO outflow, could be due to contribution from the different subcondensations associated with MM1. Additionally, from the work of Shirley et al. (shirley2007 (2007)), we estimated the predicted centimeter flux which can be accounted for from the outflow momentum rate, and obtained a flux density at 3.6 cm of mJy. Since we measured a flux density at 3.6 cm of 0.17 mJy, we conclude that all the centimeter emission associated with MM1 can be accounted for through ionization by shocks from the outflow.
The interpretation of the high-velocity CO bipolar outflow and the identification of the driving source(s) are not straightforward. A possibility is that clumps Ba and Ra are tracing an outflow with a position angle of 45° powered by one of the subcondensations of MM1, maybe MM1-S, as it falls exactly at the center of symmetry of clumps Ba and Ra (although it is less massive than MM1-main); and that Bb and Rb are tracing a second outflow with a position angle of 20°, possibly powered by MM1-main, as it shows an elongated structure in the east-west direction, almost perpendicular to the Bb-Rb outflow. Another possibility is that all the CO emission comes from a single wide-angle outflow, which would be driven by MM1-main (since it shows an east-west elongation), and would be excavating a cavity, seen at moderate velocities. If this was true, the eastern wall of the cavity, corresponding to clump Ba, would have very high-velocity emission (up to km s-1 with respect to the systemic velocity). A similar case in the literature is found for G240.31+0.07 (Qiu et al. qiu2009 (2009)), a massive YSO driving a wide-angle outflow, and with velocity in the walls of up to 27 km s-1 with respect to the systemic velocity. Such a high velocity in the cavity wall could be explained through precession of the outflow axis and episodic mass ejection. Arce & Goodman (arcegoodman2001 (2001)) study the position-velocity relation for episodic outflows and show that clumps at different positions from the driving source are expected. Each one of these clumps shows a wide range of velocities (see e. g., Fig. 2 in Arce & Goodman arcegoodman2001 (2001)). This can also be seen in the pv-plot of IRAS 00117+6412 at 20° (Fig. 10-bottom). In the figure, both the blueshifted and the redshifted sides show a pair of clumps, each one spanning a range of km s-1. Thus, both possibilities seem plausible for this target, both mutiple outflows driven by different subcondensations of MM1, and a single wide-angle episodic outflow.
5.3 MM2: an intriguing protostellar object
In Sect. 4.3 we modeled the N2H+ emission toward MM2 as a disk structure undergoing infall and rotation. The infall and rotation velocities (at ) can be compared with those derived from other protostellar cores. Beltrán et al. (beltran2005 (2005)) model, for the high-mass case for example, two massive cores with infall velocities of 1–2 km s-1, and rotation velocities of km s-1, at spatial scales of 5000–10000 AU. On the other hand, infall and rotation velocities for low/intermediate-mass protostars are around 0.1–0.4 and 0.2 km s-1, respectively, at spatial scales of AU (Beltrán et al. beltran2004 (2004); Ward-Thompson et al. wardthompson2007 (2007); Carolan et al. carolan2008 (2008)). From the infall and rotation velocities at the reference radius derived in Sect. 4.3 for MM2, and using the assumed infall and rotation power laws (Table 5), we found an infall and rotation velocity of 0.29 and 0.2 km s-1 respectively at 3000 AU, which is more similar to the velocities derived for low/intermediate-mass cores than to the velocities derived for high-mass cores. In addition, the flattened structure was modeled with an inner gap of . We note that this inner gap must not necessarily be a physically real gap. First, it could be an opacity effect. However, this possiblity can be discarded because the opacity of the isolated line (the hyperfine used to fit the model in Sect. 4.3) estimated from the fits is (see Table 4), which is clearly optically thin. Second, a more plausible option is that the N2H+ gap is reflecting the depletion of N2H+ in the center, maybe due to freezing-out of N2H+ due to high densities and low temperatures in the center, as found in very young (sometimes pre-protostellar) and dense ( cm-3) regions (Belloche & André bellocheandre2004 (2004); Pagani et al. pagani2007 (2007)). High angular resolution observations of the continuum millimeter emission would help assess the nature of this N2H+ gap.
It is worth noting that the properties of MM2 are quite different from those of MM1. MM2 has no infrared emission and is embedded in a dusty compact condensation and in a dense gas clump, which seems to be undergoing rotation and infall motions. As there is water maser emission associated with the MM2 peak (see Fig. 1f), indicative of stellar activity, one would classify this source as Class 0, judging from its lack of infrared emission and its strong and compact millimeter continuum emission. However, YSOs in the Class 0 evolutionary stage are typically associated with strong and collimated molecular outflows (e. g., Bachiller bachiller1996 (1996)), while we found no hints of (high-velocity) CO associated with MM2. Furthermore, water masers associated with YSOs are related to accretion or ejection processes (e. g., Furuya et al. furuya2003 (2003)), and observational studies suggest a connection between water masers and the outflow phenomenon (e. g., Zhang et al. zhang2001 (2001)). Thus, the lack of outflow emission associated with MM2 is intriguing. Different possibilities could explain this behavior (lack of outflow in an apparent Class 0 source with water maser emission). First, the object could be driving an outflow very faint in CO, but which could be well traced by other molecules such as SiO (studies of high-mass star-forming regions show that some molecular outflows are faint or not detected in CO while they are strong in SiO, and viceversa, Beuther et al. beuther2004 (2004); Zapata et al. zapata2006 (2006)). However, a preliminary reduction of SiO (1–0) data observed with the VLA (Busquet et al., in prep.) show no outflow hints. A second possibility would be that the outflow has not been created yet (the protostellar wind would still be in the phase of sweeping the ambient material out). The caveat with this possibility is that observations seem to indicate that outflows appear at the very first stages of the protostar formation (e. g., Bachiller bachiller1996 (1996)), and the probability of witnessing such a short-lived phenomenon is low. Third, the ejection process in this source could be different from the standard paradigm of a strong and collimated outflow associated with a Class 0 source. This is found for some objects in massive star-forming regions (Torrelles et al. torrelles2001 (2001), torrelles2003 (2003)), which show spherical ejections traced by water masers. Thus, the true evolutionary stage of MM2 remains an open question. A study of the water maser emission with the highest angular resolution available would be of great help to elucidate the process of accretion/ejection in this enigmatic object.
In order to make a rough estimate of the MM2 luminosity we used the water maser luminosity reported by Wouterloot et al. (wouterloot1993 (1993)) toward MM2, of , which we corrected to our adopted distance. From a correlation between the water maser luminosity and the bolometric luminosity of the YSO associated with the maser (Furuya et al. furuya2003 (2003), furuya2007 (2007)), we estimated a luminosity for MM2 of , suggesting that MM2 is of intermediate-mass.
5.4 Different objects emerging from the same natal cloud
The results obtained toward IRAS 00117+6412 reveal that the dusty cloud harbours about three intermediate-mass YSOs showing different properties. One of the sources seems to be an intermediate-mass UCH ii region with a shell-like structure, located at the eastern border of the dusty cloud, and almost deprived from dust and dense gas, with an estimated luminosity of , and an estimated age of Myr. Another source, MM1, is deeply embedded within the dusty cloud, has about 400–600 , and an estimated age around yr. Thus, MM1 presumably formed after the UCH ii region. Finally, MM2, of about , remains the most enigmatic object in this region, as it seems to be deeply embedded in gas and dust and has a water maser associated, but no signs of CO outflow activity. This could be a new type of object undergoing a special process of matter ejection (such as spherical mass ejection).
In summary, our observations show that the formation of stars within the nascent cluster in IRAS 00117+6412 seems to take place in different episodes. In addition, these observations show that the similar initial conditions within a cloud (similar dust mass, excitation temperature, and dense gas column density, as found for MM1 and MM2) can yield objects with very different properties. This indicates that these initial conditions may not be decisive in determining some of the properties of the YSOs forming within the cloud, such as the ejection properties, a result already found at much smaller spatial scales by Torrelles et al. (torrelles2001 (2001), torrelles2003 (2003)).
6 Conclusions
In this paper we study with high angular resolution the centimeter, and millimeter continuum, and N2H+ (1–0), and CO (2–1) emission of the intermediate-mass YSOs forming within a dusty cloud, with the goal of assessing the role of the initial conditions in the star formation process in clusters. Our conclusions can be summarized as follows:
-
1.
A UCH ii region is found at the eastern border of the dusty cloud, with a shell-like structure and a flat spectral index, . The estimated age and mass of the underlying star is Myr and .
-
2.
Deeply embedded within the dusty cloud, we have discovered a millimeter source, MM1, associated with a 2MASS infrared source, which is driving a CO (2–1) powerful and collimated high-velocity outflow, oriented in the southwest-northeast direction. The mass derived from the millimeter continuum emission for MM1 is . MM1 is embedded within a ridge of dense gas as traced by N2H+, which seems to be rotating roughly along the outflow axis. MM1 is associated with centimeter emission, whose spectral index is compatible with an ionized wind, and at 1.2 mm splits up into different subcomponents when observed with an angular resolution of . From the derived outflow momentum rate, we estimated a luminosity for MM1 of 400–600 . Thus, MM1 seems to be a Class 0/I intermediate-mass YSO.
-
3.
About to the south of MM1, our observations revealed a dust compact condensation, MM2, lying in a dark infrared region, associated with water maser emission and a dense core traced by N2H+ emission. The mass from the dust emission is , and the N2H+ excitation temperature and column density are similar to the ones derived for MM1. The dense core in MM2 is rotating in the same sense as the ridge associated with MM1 and seems to be undergoing infall. We modeled the MM2 dense core as a disk-like structure with an inner radius of and an outer radius of , with a rotation velocity in the outer radius of km s-1, and an infall velocity at the same radius of km s-1. The non-detection of CO at any velocity toward MM2 makes this object intriguing.
-
4.
Although MM1 and MM2 formed within the same cloud and have similar dust and dense gas emission, their properties, specially concerning the ejection phenomenon, seem to be different and could be indicating that the initial conditions in a cloud forming a cluster are not the only agent determining the properties of the members of the cluster.
Acknowledgements.
A. P. is grateful to Itziar de Gregorio-Monsalvo for useful discussions. A.P. is partially supported by the MICINN grant ESP2007-65475-C02-02, the program ASTRID S0505/ESP-0361 from La Comunidad de Madrid and the Europan Social Fund, and the Spanish MICINN under the Consolider-Ingenio 2010 Program grant CSD2006-00070. A.P., A.S.-M., G.B. and R.E. are supported by the Spanish MICINN grant AYA2005-08523-C03, and the MICINN grant AYA2008-06189-C03 (co-funded with FEDER funds). This publication makes use of data products from the Two Micron All Sky Survey, which is a joint project of the University of Massachusetts and the Infrared Processing and Analysis Center/California Institute of Technology, funded by the National Aeronautics and Space Administration and the National Science Foundation.References
- (1) Anglada, G. 1996, Radio Emission from the Stars and the Sun, 93, 3
- (2) Arce, H. G., & Goodman, A. A. 2001, ApJ, 551, L171
- (3) Bachiller, R. 1996, ARA&A, 34, 111
- (4) Belloche, A., & André, P. 2004, A&A, 419, 35
- (5) Beltrán, M. T., Girart, J. M., Estalella, R., & Ho, P. T. P. 2004, A&A, 426, 941
- (6) Beltrán, M. T., Cesaroni, R., Neri, R., Codella, C., Furuya, R. S., et al. 2005, A&A, 435, 901
- (7) Bernasconi, P. A., & Maeder, A. 1996, A&A, 307, 829
- (8) Beuther, H., & Henning, Th. 2009, A&A, 503, 859
- (9) Beuther, H., Schilke, P., & Gueth, F. 2004, ApJ, 608, 330
- (10) Beuther, H., Zhang, Q., Bergin, E. A., Sridharan, T. K., Hunter, T. R., et al. 2007, A&A, 468, 1045
- (11) Bontemps, S., Andre, P., Terebey, S., & Cabrit, S. 1996, A&A, 311, 858
- (12) Briggs, D. 1995, PhD Thesis, New Mexico Inst. of Mining and Technology
- (13) Carilli, C. L., & Holdaway, M. A. 1997, Millimeter Array Technical Memo 173 (NRAO)
- (14) Carolan, P. B., Redman, M. P., Keto, E., & Rawlings, J. M. C. 2008, MNRAS, 383, 705
- (15) Caselli, P., Benson, P. J., Myers, P. C., & Tafalla, M. 2002a, ApJ, 572, 238
- (16) Caselli, P., Myers, P. C., & Thaddeus, P. 1995, ApJ, 455, L77
- (17) Caselli, P., Walmsley, C. M., Zucconi, A., Tafalla, M., Dore, L., & Myers, P. C. 2002b, ApJ, 565, 344
- (18) Castor, J., McCray, R., & Weaver, R. 1975, ApJ, 200, L107
- (19) Cesaroni, R., Palagi, F., Felli, M., et al. 1988, A&AS, 76, 445
- (20) Chen, X., Launhardt, R., & Henning, Th. 2007, ApJ, 669, 1058
- (21) Evans, N. J., Dunham, M. M., Joergensen, J. K., Enoch, M. L., Merín, B., et al. 2009, ApJS, 181, 321
- (22) Furuya, R. S., Kitamura, Y., Wootten, A., Claussen, M. J., & Kawabe, R. 2003, ApJS, 144, 71
- (23) Furuya, R. S., Kitamura, Y., Wootten, A., Claussen, M. J., & Kawabe, R. 2007, ApJS, 171, 349
- (24) Garay, G., & Lizano, S. 1999, PASP, 111, 1049
- (25) Hatchell, J., Fuller, G. A., & Richer, J. S. 2007, A&A, 472, 187
- (26) Ho, P. T. P., Moran, J. M., Lo, K. Y. 2004, ApJ, 616, 1
- (27) Kim, K.-T., & Kurtz, S. E. 2006, ApJ, 643, 978
- (28) Kirk, J. M., Crutcher, R. M., Ward-Thompson, D. 2009, ApJ, 701, 1044
- (29) Kumar, M. S. N., Keto, E., & Clerkin, E. 2006, A&A, 449, 1033
- (30) Kurtz, S., Cesaroni, R., Churchwell, E., Hofner, P., & Walmsley, C. M. 2000, in Protostars and Planets IV, eds. V. Mannings, A. P. Boss, S. S. Russell, Tucson: University of Arizona Press, p. 299
- (31) Leurini, S., Beuther, H., Schilke, P., Wyrowski, F., Zhang, Q., et al. 2007, A&A, 475, 925
- (32) Molinari, S., Brand, J., Cesaroni, R., & Palla, F. 1996, A&A, 308, 573
- (33) Ossenkopf, V., & Henning, T. 1994, A&A, 291, 943
- (34) Pagani, L., Bacmann, A., Cabrit, S., & Vastel, C. 2007, A&A, 467, 179
- (35) Palau, A., Estalella, R., Girart, J. M., Ho, P. T. P., Zhang, Q., et al. 2007a, A&A, 465, 219
- (36) Palau, A., Estalella, R., Ho, P. T. P., Beuther, H., & Beltrán, M. T. 2007b, A&A, 474, 911
- (37) Palla, F., & Stahler, S. W. 1990, ApJ, 360, L47
- (38) Palla, F., & Stahler, S. W. 1993, ApJ, 418, 414
- (39) Panagia, N. 1973, AJ, 78, 929
- (40) Qiu, K., Zhang, Q., Wu, J., & Chen, H.-R. 2009, ApJ, 696, 66
- (41) Rieke, G. H., & Lebofsky, M. J. 1985, ApJ, 288, 618
- (42) Sault, R. J., Teuben, P. J., & Wright, M. C. H. 1995, Astronomical Data Analysis Software and Systems IV, 77, 433
- (43) Sánchez-Monge, Á., Palau, A., Estalella, R., Beltrán, M. T., & Girart, J. M. 2008, A&A, 485, 497
- (44) Shirley, Y. L., Claussen, M. J., Bourke, T. L., Young, C. H., & Blake, G. A. 2007, ApJ, 667, 329
- (45) Skrutskie, M. F., et al. 2006, AJ, 131, 1163
- (46) Torrelles, J. M., Patel, N. A., Anglada, G., Gómez, J. F., Ho, P. T. P., et al. 2003, ApJ, 598, L115
- (47) Torrelles, J. M., Patel, N. A., Gómez, J. F., Ho, P. T. P., Rodríguez, L. F., et al. 2001, ApJ, 560, 853
- (48) Tscharnuter, W. M., Schönke, J., Gail, H.-P., & Lüttjohann, E. 2009, A&A, 504, 109
- (49) Walch, S., Burkert, A., Whitworth, A., Naab, T., & Gritschneder, M. 2009, MNRAS, 400, 13
- (50) Walmsley, C. M., Cesaroni, R., Olmi, L., Churchwell, E., & Hofner, P. 1995, Ap&SS, 224, 173
- (51) Ward-Thompson, D., André, P., Crutcher, R., Johnstone, D., Onishi, T., & Wilson, C. 2007, Protostars and Planets V, 33
- (52) Williams, J. P., Mann, R. K., Beaumont, C. N., Swift, J. J., Adams, J. D., et al. 2009, ApJ, 699, 1300
- (53) Womack, M., Ziurys, L. M., & Wyckoff, S. 1992, ApJ, 387, 417
- (54) Wouterloot, J. G. A., Brand, J., & Fiegle, K 1993, A&AS, 98, 589
- (55) Zapata, L. A., Ho, P. T. P., Rodríguez, L.F., et al. 2006, ApJ, 653, 398
- (56) Zapata, L. A., Leurini, S., Menten, K. M., Schilke, P., Rolffs, R., et al. 2008, AJ, 136, 1455
- (57) Zhang, Q., Hunter, T. R., Brand, J., Sridharan, T. K., Cesaroni, R. et al. 2005, ApJ, 625, 864
- (58) Zhang, Q., Hunter, T. R., Brand, J., Sridharan, T. K., Molinari, S. et al. 2001, ApJ, 552, L167
- (59) Zhilkin, A. G., Pavlyuchenkov, Y. N., & Zamozdra, S. N. 2009, Astronomy Reports, 53, 590
Appendix A Emission filtered out by an interferometer
In this appendix we describe the estimation of the fraction of flux filtered out by an interferometer. Consider a bidimensional Gaussian source with the flux density and the half-power diameter . Its intensity, , can be expressed as
| (1) |
The visibility, , of the Gaussian source corresponds to the fourier transform of the intensity (Eq. 1),
| (2) |
and thus, the half-power radius, , is
| (3) |
or in practical units, in and, in
| (4) |
From Eq. 4 we can estimate the largest structure, , sensitive to an interferometer with the shortest baseline being ,
| (5) |