Phonon dispersion and anomalies in one-layer high-temperature superconductors
Abstract
Phonon dynamics, charge response and the phonon density of states are calculated for the high-temperature superconductors HgBa2CuO4 and Bi2Sr2CuO6 within a microscopic model for the electronic density response. The results are compared with previous calculations for La2CuO4 and Nd2CuO4. Our main focus is on the phononanomalies which are connected with the high-frequency oxygen bond-stretching modes (OBSM) found before in our calculations for -doped La2CuO4 and -doped Nd2CuO4. We investigate the question if the characteristic softening of the OBSM and the related strong coupling to the electrons is also present in HgBa2CuO4 and Bi2Sr2CuO6. In particular the importance of the contribution of the more delocalized Cu state besides the localized Cu state on the softening is investigated and the different anticrossing behaviour due to the presence of several phonon modes with the same symmetry as the OBSM is studied. This makes the identification of the anomalies quite complicate. Furthermore, the influence of electronic polarization processes at ions out of the CuO plane in the ionic layers on the phonon dynamics is calculated. In this context the qualitative type of charge response, i.e. the presence or not of possible metallic charge fluctuations at the Hg or Bi ion, respectively, linked via the apex oxygen to the CuO plane, proves to be very sensitive for certain phonon modes. All the calculations are compared to the experimental results available so far. The latter, however, are rather incomplete for the Hg and the Bi compound.
pacs:
74.25.Kc, 63.20.Dj, 74.72.-h, 63.10.+a1 Introduction
In recent literature there is increasing evidence that the electron-phonon interaction (EPI) is significant in the cuprate based high-temperature superconductors (HTSC’s) and it is argued that phonons might play an important role for the electron dynamics in the HTSC’s; see, e.g. Refs. [1, 2, 3, 4, 5, 6, 7, 8]. It is known from the experiments for some time that the frequencies of the oxygen bond-stretching modes (OBSM) are strongly renormalized (softened) upon doping in the -doped cuprates [3, 9, 10, 11, 12, 13, 14, 15]. Quite recently first evidence of an anomalous dispersion of the OBSM also has been reported in a Bi cuprate [16] which, among other things, will be investigated theoretically in this work. Anomalous softening of the OBSM, not existing in the undoped insulating state, also has been observed in the -doped metallic state of Nd2CuO4 [17, 18, 19]. The phonon dispersion and the charge response in Nd2CuO4 have been calculated in [20] and the result compares well with the measured anomalous dispersion.
All these findings support a generic nature of the OBSM phonon anomalies in the HTSC’s. The frequency renormalization and a corresponding increase of the linewidths point to a strong coupling of these phonons to the charge carriers. Deviations from the presumably generic dispersion for the OBSM in form of a sharp softening have recently been reported in inelastic neutron scattering (INS) and high resolution inelastic x-ray scattering (IXS) experiments, respectively, for La2-xBaxCuO4 at [6] and [21]. This has been related to the possibility of stripe formation in this compound.
According to our calculations the origin of the phonon anomalies is a strong nonlocal EPI due to specific screening effects in form of a polarization created by metallic charge fluctuations (CF’s) on the outer shells of the Cu and Oxy ions in the CuO plane; see, e.g. [22, 23, 24]. This type of screening characteristic for a strongly inhomogeneous electronic system like the cuprates with a strong component of ionic binding and a corresponding density distribution which is mainly concentrated at the ions in the CuO plane leads for the -doped cuprates [22, 24] and also for the -doped Nd2CuO4 [20] to an anomalous behaviour of the dispersion.
The specific form of screening yields for the OBSM in metallic La2CuO4 and Nd2CuO4 a downward dispersion of the anomalous longitudinal branch with high frequencies along the (1,0,0) and the (1,1,0) direction, respectively. In case of Nd2CuO4, however, the dispersion of the branches with high frequencies comprising the anomalous OBSM is more complex than in La2CuO4 because there are in contrast to La2CuO4 several branches of the same symmetry type nearby in energy leading to complex anticrossing phenomena [20]. Such a possibility is also investigated for HgBa2CuO4 and Bi2Sr2CuO6 in this work.
The anomalous dispersion cannot be understood within a typical lattice dynamical model, like the shell model, extended by a homogeneous electron gas screening that is diagonal in reciprocal space. This type of dielectric response always yields an increasing dispersion when passing from the center of the Brillouin zone (BZ) into the zone, because of an incomplete screening of the phonon-induced changes of the Coulomb potential at shorter distances. In contrast, the anomalous softening of the OBSM in particular of the oxygen half-breathing mode ( anomaly halfway the direction) and the full oxygen breathing mode (O at the point of the BZ) is a result of an ”overscreening” of the phonon induced changes of the Coulomb potential. The overscreening effect has been shown by our calculations to be due to nonlocally excited CF’s localized at the Cu and Oxy sites in the CuO plane accompanied by (dynamic) charge ordering in form of localized stripes of alternating sign in the plane [22, 25]. Expressed in terms of the density response matrix in reciprocal space such a strong nonlocal EPI effect and ”overscreening” of the OBSM is related to the off-diagonal elements (local field effect) being apparently very important in the cuprates as revealed by the anomalous softening found in our studies.
In our calculations a sufficiently broad set of orbital degrees of freedom (Cu, Cu, O), the full three dimensional long range Coulomb interaction as well as the short range local repulsion of the electrons, especially the important on-site repulsion mediated by the localized Cu orbital, is considered quantitatively. All the resulting couplings arising in the dynamical matrix are microscopically well defined and can be calculated.
From our investigations, see, e.g. Ref. [26], we extract a strong EPI for the phonon anomalies and O, which can well be treated in adiabatic approximation. Moreover, we find a very strong nonadiabatic enhancement of the coupling compared to the adiabatic case for phonon-like modes, like O (axial oxygen breathing mode at the point of the BZ) , from a small nonadiabatic region around the -axis. In this region poor dynamical screening due to the slow charge dynamics around the -axis of the long range polar Coulomb interaction of the ions leads in metallic LaCuO4 to low-energy plasmons mixing with certain interlayer phonons of the same symmetry. For a discussion of phonon-plasmon mixing in the cuprates, see also [27]. An essential nonlocal interaction of holes with -axis polarized optical phonons in the HTSC’s has also been reported in [28, 29].
Our calculations show that besides the more delocalized Cu state the short range part of the Coulomb interaction related to the localized Cu orbital is particular important for the and O mode polarized and propagating in the CuO plane while the strong long range nonlocal polar Coulomb interaction plays an important role for O and similar phonons polarized and propagating along the -axis. Thus, the relevance, of both, short range electron repulsion in the correlated Cu state as well as long range polar coupling of the electrons to the phonons, is demonstrated by our calculations of the phonon anomalies in the cuprates. Consequently, any quantitative study of the physics of the normal or superconducting state of the cuprates should consider electron correlations and strong nonlocal EPI on an equal footing.
The paper is organized as follows. In section 2 the theory and modeling is shortly reviewed. Section 3 presents the calculations for the phonon dynamics, charge response and the phonon density of states of HgBa2CuO4 and Bi2Sr2CuO6 and a comparison with earlier calculations of LaCuO4 and Nd2CuO4. The main focus is on the OBSM phonon anomalies in the various materials and the effect of the charge response in the ionic layers on the dispersion. A summary of the paper is given in section 4 and the conclusions are drawn.
2 Theory and modeling
In the following a brief survey of the theory and modeling is presented. A detailed description can be found in [23] and in particular in [30] where the calculation of the coupling parameters of the theory is presented.
The local part of the electronic charge response and the EPI is approximated in the spirit of the quasi-ion approach [20, 31] by an ab initio rigid ion model (RIM) taking into account covalent ion softening in terms of (static) effective ionic charges calculated from a tight-binding analysis. The tight-binding analysis supplies these charges as extracted from the orbital occupation numbers of the (tight-binding) orbital in question:
| (1) |
stands for the -component of the eigenvector of band at the wavevector in the first BZ; the summation in equation (1) runs over all occupied states and gives the number of the elementary cells in the (periodic) crystal.
In addition, scaling of the short range part of certain pair potentials between the ions is performed to simulate further covalence effects in the calculation in such a way that the energy-minimized structure is as close as possible to the experimental one [32]. Structure optimization and energy minimization is very important for a reliable calculation of the phonon dynamics through the dynamical matrix. Taking just the experimental structure data as is done in many cases in the literature may lead to uncontrolled errors in the phonon calculations.
The RIM with the corrections just mentioned then serves as an unbiased reference system for the description of the HTSC’s and can be considered as a first approximation for the insulating state of these compounds because of the strong ionic nature of bonding in the cuprates. Starting with such an unprejudiced rigid reference system non-rigid electronic polarization processes are introduced in form of more or less localized electronic charge-fluctuations (CF’s) at the outer shells of the ions. Especially in the metallic state of the HTSC’s the latter dominate the nonlocal contribution of the electronic density response and the EPI and are particularly important in the CuO planes. In addition, anisotropic dipole-fluctuations (DF’s) are admitted in our approach [30, 33]. They prove to be specifically of interest for the ions in the ionic layers mediating the dielectric coupling and for the polar modes. Thus, the basic variable of our model is the ionic density which is given in the perturbed state by
| (2) |
is the density of the unperturbed ion, as used in the RIM, localized at the sublattice of the crystal and moving rigidly with the latter under displacement. The and describe the amplitudes and the form-factors of the CF’s and the last term in equation (2) represents the dipolar deformation of an ion with amplitude (dipole moment) and a radial density distribution . denotes the unit vector in the direction of . The are approximated by a spherical average of the orbital densities of the ionic shells calculated in LDA taking self-interaction effects (SIC) into account. The dipole density is obtained from a modified Sternheimer method in the framework of LDA-SIC [30]. All SIC-calculations are performed for the average spherical shell in the orbital-averaged form according to Perdew and Zunger [34]. For the correlation part of the energy per electron the parametrization given in [34] has been used.
The total energy of the crystal is obtained by assuming that the density can be approximated by a superposition of overlapping densities . The in equation (2) are also calculated within LDA-SIC taking environment effects, via a Watson sphere potential and the calculated static effective charges of the ions into account. The Watson sphere method is only used for the oxygen ions and the depth of the Watson sphere potential is set as the Madelung potential at the corresponding site. Such an approximation holds well in the HTSC’s [32, 35]. Finally, applying the pair-potential approximation we get for the total energy:
| (3) |
The energy depends on both the configuration of the ions and the electronic (charge) degrees of freedom (EDF) of the charge density, i.e. and in equation (2). are the energies of the single ions. , denote the elementary cells and , the corresponding sublattices. The second term in equation (3) is the interaction energy of the system, expressed in terms of anisotropic pair-interactions . Both and in general depend upon via in equation (2).
The pair potentials in equation (3) can be seperated into long range Coulomb contributions and short range terms, for details see e.g. Ref [30].
From the adiabatic condition
| (4) |
the electronic degrees of freedom can be eliminated, an expression for the atomic force constants can be given and from this the dynamical matrix in harmonic approximation can be derived as
| (5) | |||||
The first term on the right hand side denotes the contribution from the RIM. , are the masses of the ions and is a wave vector from the first BZ.
The quantities and in equation (5) represent the Fourier transforms of the electronic coupling coefficients and are calculated from the energy in equation (3), i.e.
| (6) | |||||
| (7) |
denotes the EDF (CF and DF in the present model, see equation (2)) in an elementary cell. The coefficients describe the coupling between the EDF and the displaced ions (bare electron-phonon coupling), and the coefficients determine the interaction between the EDF. The phonon frequencies and the corresponding eigenvectors of the modes are obtained from the secular equation for the dynamical matrix in equation (5), i.e.
| (8) |
The Eqs. (5)-(8) are generally valid and, in particular, are independent of the specific model for the decomposition of the perturbed density in equation (2) and the pair approximation in equation (3) for the energy. The lenghty details of the calculation of the coupling coefficients and cannot be reviewed in this paper. They are presented in [30]. In this context we note that the coupling matrix of the EDF-EDF interaction, whose inverse appears in equation (5) for the dynamical matrix, can be written in matrix notation as
| (9) |
is the inverse of the proper polarization part of the density response matrix and contains the kinetic part to the interaction while embodies the Hartree and exchange-correlation contribution, because they are related to the second functional derivatives with respect to the density of the kinetic energy and the exchange-correlation energy, respectively [23]. needed for the dynamical matrix and the EPI is closely related to the linear density response matrix and to the inverse dielectric matrix , respectively.
Only very few attempts have been made to calculate the phonon dispersion and the EPI of the HTSC’s using the linear response method in form of density functional perturbation theory (DFPT) within LDA [36, 37, 38, 39]. These calculations correspond to calculating and in DFT-LDA and for the metallic state only. On the other hand, in our microscopic modeling DFT-LDA-SIC calculations are performed for the various densities in equation (2) in order to obtain the coupling coefficients and . Including SIC is particularly important for localized orbitals like Cu in the HTSC’s. Our theoretical results for the phonon dispersion [22, 24, 26, 33], which compare well with the experiments, demonstrate that the approximative calculation of the coupling coefficients in our approach is sufficient, even for the localized Cu states. Written in matrix notation we get for the density response matrix the relation
| (10) |
The CF-CF submatrix of the matrix can approximately be calculated for the metallic (but not for the undoped and underdoped) state of the HTSC’s from a TBA of a single particle electronic bandstructure. In this case the electronic polarizability in tight-binding representation reads:
| (11) | |||||
, and in equation (11) are the occupation numbers, the single-particle energies and the expansion coefficientes of the Bloch-functions in terms of tight-binding functions.
The self-consistent change of an EDF at an ion induced by a phonon mode with frequency and eigenvector can be derived in the form
| (12) | |||||
with the displacement of the ions
| (13) | |||||
The self-consistent response per unit displacement of the EDF in equation (12) is calculated in linear response theory as:
| (14) |
The generalization for the quantity in Eqs. (9) and (10) needed for the kinetic part of the charge response in the nonadiabatic regime, where dynamical screening effects must be considered, can be achieved by adding to the differences of the single-particle energies in the denominator of the expression for in equation (11). Other possible nonadiabatic contributions to related to dynamical exchange-correlation effects and the phonons themselves are beyond the scope of the present approach. Using equation (10) for the dielectric matrix, , and the frequency-dependent version of the irreducible polarization part, , according to equation (11), the free-plasmon dispersion is obtained from the condition,
| (15) |
The coupled-mode frequencies of the phonons and the plasmons must be determined self-consistently from the secular equation (8) for the dynamical matrix which now contains the frequency implicitly via in the response function . Such a nonadiabatic approach is necessary for a description of the interlayer phonons and the charge-response within a small region around the -axis as performed in [22, 26].
3 Results and discussion
3.1 Ionic reference system and structural data
For a definitive discussion of the renormalization of the phonon modes introduced by the nonlocal EPI effects related to the electronic polarization processes of CF and DF type, a quantitative reference model for the calculation of the phonon dispersion based essentially on the important component of ionic binding is necessary. A suitable model sketched in section 2 which represents approximately the local EPI effects is provided by the ab initio rigid-ion model, extended by covalent ion softening and scaling of the short range part of certain pair potentials.
| La2CuO4 | Nd2CuO4 | HgBa2CuO4 | Bi2Sr2CuO6 |
|---|---|---|---|
| La: 2.28+ | Nd: 2.35+ | Hg: 1.44+ | Bi: 2.28+ |
| Ba: 1.69+ | Sr: 1.85+ | ||
| Cu: 1.22+ | Cu: 1.22+ | Cu: 1.70+ | Cu: 1.22+ |
| Oxy: 1.42- | Oxy: 1.42- | Oxy: 1.56- | Oxy: 1.42- |
| Oz: 1.47- | Oz: 1.54- | Oz: 1.70- | Oz: 1.47- |
| O3: 1.85- |
| La2CuO4 [43] | Nd2CuO4 [44] | HgBa2CuO4 [45] | Bi2Sr2CuO6 [46] | ||||
|---|---|---|---|---|---|---|---|
| 3.763 | 4.155 | 3.8995 | 3.741 | ||||
| (3.810) | (3.945) | (3.875) | (3.798) | ||||
| 13.197 | 12.102 | 9.521 | 23.490 | ||||
| (13.240) | (12.171) | (9.513) | (24.662) | ||||
| 3.5 | 2.9 | 2.4 | 6.3 | ||||
| (3.5) | (2.9) | (2.5) | (6.5) | ||||
| 0.185 | 0.250 | 0.313 | 0.109 | ||||
| (0.182) | (0.250) | (0.294) | (0.105) | ||||
| 0.134 | 0.153 | 0.183 | 0.199 | ||||
| (0.138) | (0.149) | (0.198) | (0.186) | ||||
| 0.189 | |||||||
| (0.184) | |||||||
| 0.068 | |||||||
| (0.071) | |||||||
| Cu-Oxy= | 1.881 | Cu-Oxy= | 2.078 | Cu-Oxy= | 1.950 | Cu-Oxy= | 1.870 |
| (1.895) | (1.972) | (1.940) | (1.896) | ||||
| Cu-Oz= | 2.441 | Cu-Oz= | 3.670 | Cu-Oz= | 2.980 | Cu-Oz= | 2.556 |
| (2.407) | (3.622) | (2.793) | (2.585) | ||||
| Oz-La= | 2.382 | Oz-Nd= | 2.389 | Oz-Hg= | 1.800 | Oz-Bi= | 1.893 |
| (2.381) | (2.323) | (1.966) | (1.944) | ||||
A modified ionic description is quite general a good starting point for the physics in the cuprates in particular for their insulating state. In this context we also refer to the work in [40, 41, 42]. In our calculations we found a suitable set of static effective charges given in table 1 which together with covalent scaling leads to a good overall agreement with the experimental structural data, shown in table 2. The charges of the Cu and the Oxy ions in the CuO plane are taken identical for La2CuO4, Nd2CuO4 and Bi2Sr2CuO6. They result from a tight-binding analysis of the ab initio band structure in La2CuO4 [32]. This means that the CuO plane is treated as generic for these materials as far as the effective charges are concerned. On the other hand, for HgBa2CuO4 these charges have to be chosen more ionic, otherwise the phonon modes are too low in frequency as compared with the experiment. In all the materials covalent scaling of the short range pair potential between the Cu and the Oxy ions in the plane is very essential and in case of HgBa2CuO4 and Bi2Sr2CuO6 in addition between the apex oxygen Oz and Hg and Oz and Bi, respectively.
This is consistent with a significant shorter distance of the Oz-Hg and Oz-Bi link as compared to Oz-La or Oz-Nd in La2CuO4 and Nd2CuO4, respectively (Oz-Hg: 1.97 Å; Oz-Bi: 1.94 Å; Oz-La: 2.38 Å; Oz-Nd: 2.32 Å). Thus, the overlap of the orbital densities in the Oz-Hg and Oz-Bi bond is sufficiently large and consequently metallic CF’s between the partially occupied Oz2p and Hg orbitals and the Oz2p and Bi orbitals, respectively, can be expected. The important effect of such CF’s on certain phonon modes will be discussed in section 3.2.
3.2 Phonon dispersion, charge response and phonon density of states
The calculation of the phonon dispersion in this section is based on the dynamical matrix given in equation (5) within adiabatic approximation which has been shown to be a good approximation for all phonon modes outside a small region around the -axis, where, on the other hand, a nonadiabatic approach is necessary [22, 26]. As discussed, e.g. in Ref. [26], the nonadiabatic region around the -axis is so small that it cannot be resolved by INS experiments or other probes so far. Thus, only an average of the dispersion can be measured along the direction for modes of symmetry because of their coupling to a low lying -axis plasmon as discussed in [26]. Consequently, all results for the -phonons propagating and polarized along the -axis calculated in adiabatic approximation or reported in the experiments must be interpreted as an average over the small region with a nonadiabatic charge repsonse.
Anisotropic DF’s being particular important along the -axis and for ions in the ionic layers [20, 33, 47] have been taken into account in all computations of the phonon modes in this paper.
The subsequent calculations are representative for the well doped metallic state of the materials where a fully developed Fermi surface exists. Investigations of the charge response and phonon dynamics of the underdoped pseudogap state and the insulating state of the cuprates have been performed in [20, 24, 33]. These calculations are based on a microscopic modeling of the electronic polarizability in terms of rigorous orbital specific compressibility-incompressibility sum rules for in the long wave-length limit in order to discriminate between the charge response of the different electronic sates of the cuprates.
In the following we discuss the effect of the renormalization of the phonon dispersion by metallic CF’s which are of particular importance for the anomalous high-frequency oxygen bond-stretching modes OBSM. In our earlier calculations of the phonon anomalies and the phonon dispersion of La2CuO4 and Nd2CuO4 [20, 24, 33, 48] we have applied successfully a parameterized description (-model) for the electronic polarizabality matrix in equation (11). This model highlights besides the effect of the localized Cu state the importance of the delocalized Cu-component in the charge response and for the softening of the anomalous OBSM phonon modes. The importance of the Cu orbital for a realistic description of the electronic structure of the HTSC’s has also been pointed out in Refs. [49, 50].
In order to demonstrate selectively the renormalization effect introduced by the Cu orbital for the OBSM not only within the -model approach we have calculated approximately using for the electronic band structure of the CuO plane an eleven-band-model (11BM: based on Cu and O states [51]) and a twelve-band-model (12BM) which takes the Cu state in addition into account.


In figure 1 the result for the electronic band structure of the 11BM and the 12BM is displayed and in figure 2 the corresponding results for the OBSM phonon anomalies are shown for the case of La2CuO4. The important contribution of the Cu degree of freedom in the charge response for the anomalies is evident by inspection of the dotted and broken curve in figure 2. The full curve relies on a diagonal -model [48] where the matrix elements of the polarizability matrix = 2.8 eV-1, = 0.055 eV-1 and = 0.2 eV-1 have been extracted from the full polarizability matrix, as obtained from a tight-binding analysis of the electronic band structure for La2CuO4 (31BM [52]) within the framework of the local density approximation (LDA) of density functional theory (DFT). The value for , however, has been slightly increased compared with the 31BM from 0.05 eV-1 to 0.055 eV-1 in order to optimize the calculated result for the branch in comparison to the experiment.
Using the 11BM or the 12BM, respectively, as generic models for the electronic structure of the CuO plane also in the calculation of the phonon dispersion of Nd2CuO4, HgBa2CuO4 and Bi2Sr2CuO6 we find that the softening of the OBSM due to the Cu CF’s is of the same size as for La2CuO4 displayed in figure 2.
| La2CuO4 | Nd2CuO4 | |||||
| Cu | Cu | O | Cu | Cu | O | |
| O | -23.216 | / | -18.860 | / | ||
| -19.949 | -13.255 | -16.976 | -13.129 | |||
| -16.946 | / | -6.520 | -14.221 | / | -5.666 | |
| -15.393 | -8.685 | -3.283 | -13.284 | -8.473 | -3.152 | |
| HgBa2CuO4 | Bi2Sr2CuO6 | |||||
| Cu | Cu | O | Cu | Cu | O | |
| O | -24.231 | / | -22.078 | / | ||
| -17.100 | -13.576 | -17.081 | -11.575 | |||
| -17.528 | / | -8.865 | -13.881 | / | -8.756 | |
| -16.276 | -9.228 | -5.904 | -11.955 | -6.473 | -4.002 | |
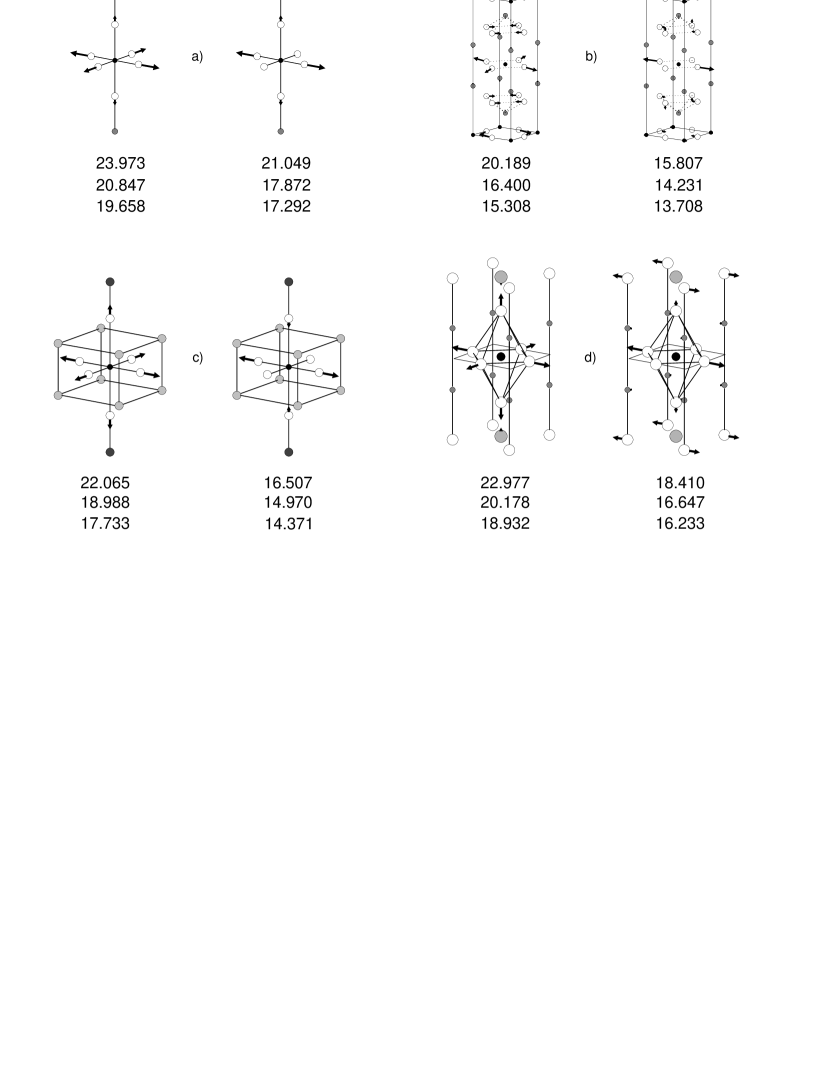
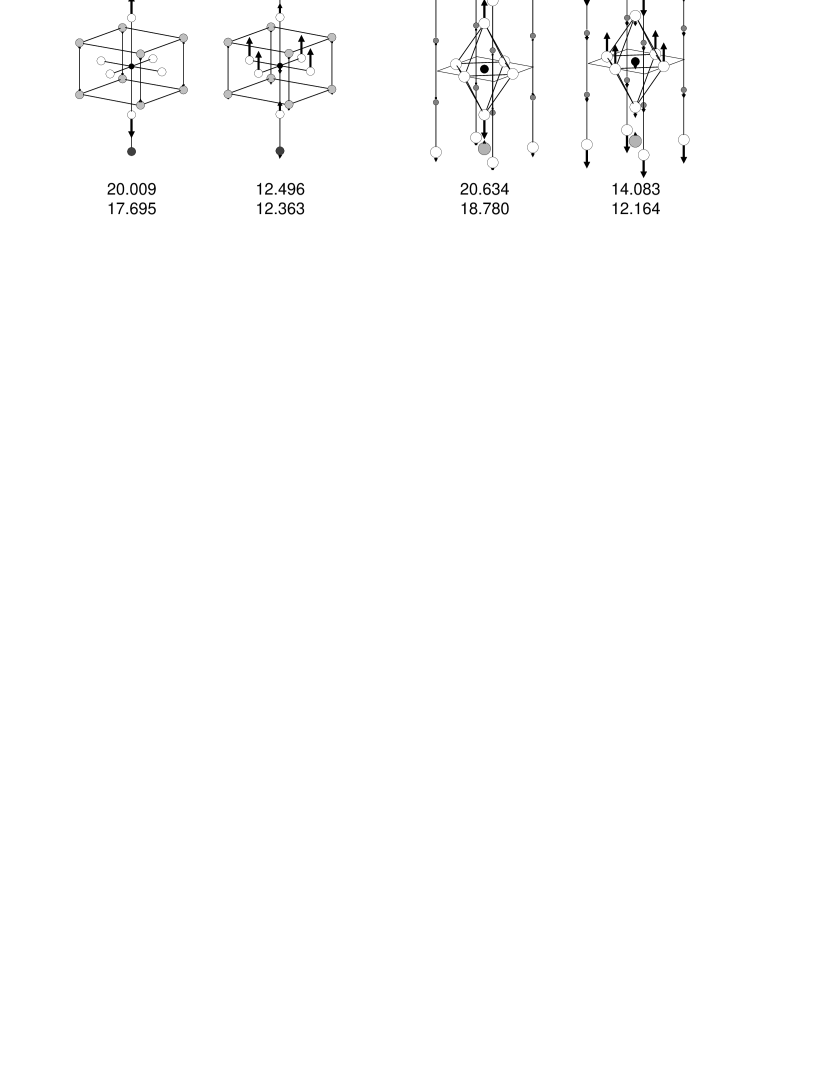
The detailed results for the renormalization of the OBSM are shown in figure 3 where the displacement patterns of the half-breathing mode ( anomaly) and the full breathing mode O are given. Moreover, we have listed the corresponding frequencies in THz as calculated in the RIM, the 11BM and the 12BM. It should be noted, that due to the simple tetragonal elementary cell, in HgBa2CuO4 the full breathing mode is located at and the half-breathing mode at , but to be consistent with the other three compounds we keep the denotation and O also for HgBa2CuO4.
A measure for the electron-phonon coupling strength is given by the mode- and orbital selective charge fluctuations from equation (12) and the related renormalization of the corresponding phonon modes. We find a very strong renormalization of the mode frequencies by the electronic polarizations processes which nearly exclusively results from the nonlocally excited CF’s listed in table 3. The softening for O as compared to the RIM is in the range between 4 THz and 5 THz and for between 2 THz and 4 THz. The largest softening for occurs in La2CuO4 partly due to the fact that there is virtually no anticrossing with other modes of symmetry.
The significant renormalization of the OBSM in all the compounds investigated so far signals a strong nonlocal electron-phonon coupling in the cuprates. This strong coupling, in particular the effect of the Cu orbital, can also be read off from the calculated magnitude of the phonon induced charge response given in table 3 in terms of the CF’s according to equation (12).
Our calculations for HgBa2CuO4 and Bi2Sr2CuO6 in the following, are based on the -model approach because unlike to La2CuO4 no reliable tight-binding parametrization of a first principles band structure is available for these compounds. Even if a tight-binding parametrization of a typical DFT-LDA based band structure would exist it would be not sufficient to describe the dynamics of the modes in the HTSC polarized and propagating along the -axis. This is, because typical DFT-LDA calculations are much too isotropic and underestimate the anisotropy of the real materials by far. For a detailed discussion of this interesting topic in case of La2CuO4 and its relevance for the nonadiabatic charge response and the related phonon-plasmon mixing, see Refs. [26, 53]. A short comment should be made concerning the size of the electron-phonon coupling strength of the adiabatic OBSM with amplitudes within the plane (, O) compared to modes with out of plane amplitudes as the nonadiabatic apex oxygen bond-stretching mode O. Like in the present paper in our calculations for La2CuO4 [26] an already strong coupling of the adiabatic modes and O has been found. However, for the nonadiabatic O mode with out of plane amplitudes we obtain in addition a very strong increase of the coupling as compared to the adiabatic in plane modes.
Phonon-plasmon mixing in the nonadiabatic region around the -axis provides an extra channel for the formation of cooper pairs. For a suitable strength of interlayer coupling it becomes possible to achieve large contributions to the coupling from both, the phonon-like and the plasmon-like modes, as discussed in [22, 55]. Assuming, that the phonon-plasmon contribution to pairing is significant this finding could help in the search of new high- materials. This can be accomplished by changing the out of plane solid-state chemistry in order to tune the interlayer coupling.
| HgBa2CuO4 | |||||||||
|---|---|---|---|---|---|---|---|---|---|
| -2dim | 5.17 | 20.01 | 2.61 | 4.20 | 3.44 | 4.87 | 12.50 | 17.55 | |
| -3dim | 4.63 | 17.70 | 2.61 | 4.20 | 3.31 | 4.86 | 12.36 | 17.32 | |
| Exp. [56] | 4.83 | 17.75 | 2.25 | 5.04 | |||||
| Exp. [59] | 2.58 | 4.50 | 10.67 | 18.80 | |||||
| Bi2Sr2CuO6 | |||||||||
| -2dim | 4.18 | 7.02 | 14.06 | 20.63 | 2.99 | 5.09 | 9.25 | 14.08 | 18.67 |
| -3dim | 4.16 | 5.89 | 13.59 | 18.78 | 2.79 | 5.08 | 9.17 | 12.16 | 18.10 |
| Exp. [57] | 2.07 | 3.57 | 13.61 | 18.71 | |||||
| Exp. [58] | 3.60 | 6.00 | 13.76 | 18.74 | |||||
| Exp. [60] | 3.27 | 4.95 | 9.02 | 11.54 | 17.57 |
Within our -model approach we can model the charge response for ions out of the CuO plane by adjusting the corresponding polarizability matrix elements of these ions in order to obtain a reasonable description of the frequency of certain phonon modes which are most sensitive to the charge response of the most important out-of-plane ions. So, as a first approximation we take the -model for the CuO plane as introduced for La2CuO4 above also for HgBa2CuO4 and Bi2Sr2CuO6. From table 4 a comparison of the calculated frequencies of the Raman modes with the experiment shows that the largest difference between theory and experiment appears for the Raman mode O with the highest frequency. Here the apex oxygen ion vibrates along the -axis against the Hg or Bi ion, respectively, which are located just above the apex oxygen, see figure 4. As already mentioned in section 3.1 there is a relatively short distance between Oz and Hg or Bi, respectively, and consequently metallic CF’s can be expected which should renormalize the corresponding modes.
In order to investigate this effect we extend the -model for the CuO plane (-2dim) by allowing for metallic charge fluctuations on the Oz, Hg and Bi ions (-3dim). The corresponding matrix elements , , for HgBa2CuO4 and , for Bi2Sr2CuO6 are determined in such a way that the calculated and measured frequencies for O are very close, see table 4 and figure 4.
Moreover, we extract from the results in table 4 that also the other calculated Raman modes are improved by allowing CF’s at these ions out of the CuO plane. In case of Bi2Sr2CuO6 it is remarkable that also an infrared active mode is softened by nearly 2 THz if the out-of-plane CF’s are in addition admitted. As can be expected, in this mode the Oz and the Bi ion are vibrating against each other, compare with figure 4. It should be noted that in calculations of the infrared and Raman active modes for La2CuO4 and Nd2CuO4 with CF’s allowed in the -model on Oz, La or Nd, respectively, these CF only do have a minor influence on the phonon frequencies.

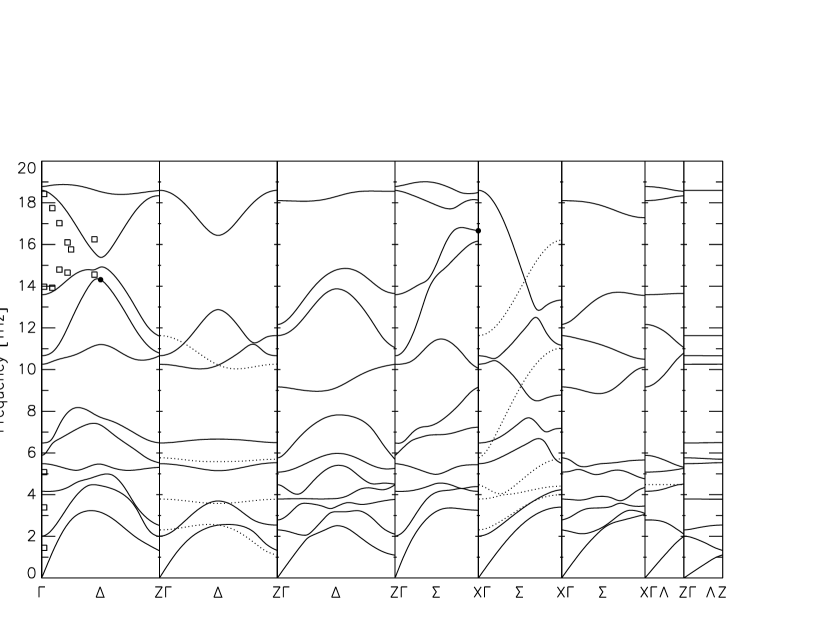
In figure 5 and 6 the calculated phonon dispersion of HgBa2CuO4 and Bi2Sr2CuO6 is displayed in the main-symmetry direction , and . In addition, an interpretation of the IXS-phonon spectra for HgBa2CuO4 [12, 54] and for Bi2Sr2CuO6 [16] is added to the figures in form of open squares and circles.
In case of HgBa2CuO4 a minor deficit is visible in form of one slightly unstable acoustic mode which is related to lattice vibrations propagating along the -axis where the Oz and Ba ions are vibrating in phase parallel to the CuO plane. This instability is already present in the RIM and most likely is a result of the more open structure of HgBa2CuO4 and thus of the the growing importance of non-central forces.
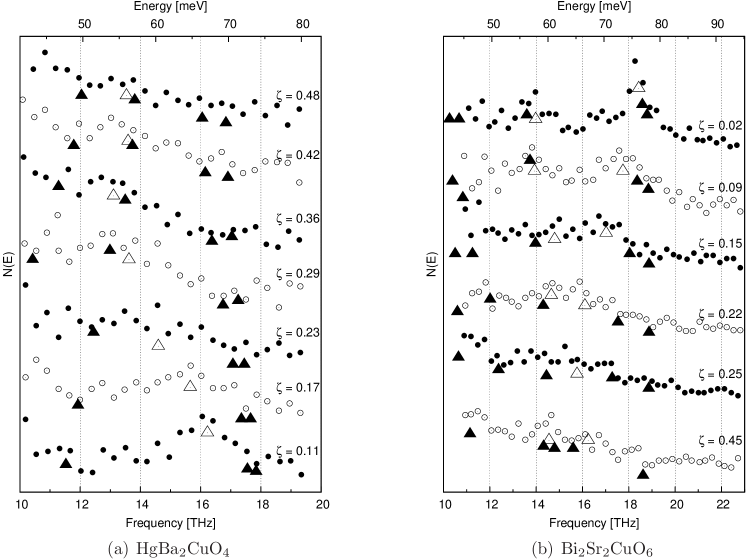
The interpretation of the IXS-spectra in Refs. [12, 54] and [16], respectively, are based on a Voigt fit. The positions of the peaks resulting from this fit are displayed in the IXS-spectra shown in figure 7(a) for HgBa2CuO4 and 7(b) for Bi2Sr2CuO6 as open triangles. In addition, we have plotted in this figure the calculated frequencies of the -modes in the energy range considered, including the half-breathing mode, at the corresponding wavevectors (full triangles).
At first one notices that for HgBa2CuO4 only one phonon peak has been fitted in the energy range shown in figure 7(a). On the other hand, we find in this range of energy a phonon spectrum which is much more complex comprising up to four modes, see figure 5. In the fit for Bi2Sr2CuO6 [16] only two phonon peaks have been fitted in the range of energy shown in figure 7(b), while according to our calculations in figure 6 there are up to five modes in this range which can interact with each other and constitute a highly nontrivial anticrossing scenarium. Quite general we can say that the IXS-spectra reveal for small values in HgBa2CuO4 one and in Bi2Sr2CuO6 two marked peaks. However, the strength of the peaks strongly decreases for larger values such that at the peaks are very weak and an unique interpretation seems not possible. Moreover, the dips in the phonon dispersion curves as extracted from the interpretation of the IXS-spectra at for HgBa2CuO4 [12] and at for Bi2Sr2CuO6 [16] are not found in our calculations. However, as a result of the complex anticrossing scenario we obtain a pronounced dip at in Bi2Sr2CuO6 and two half-breathing modes below the dip with somewhat smaller frequencies, see figure 6. The higher one has a displacement pattern as shown in figure 3 (d) and in the lower one the apex oxygen and the oxygens in the ionic layer vibrate with opposite phases compared to figure 3 (d). This holds also true for the -point, where two breathing modes occur, see figure 6. The higher one has the displacement pattern as shown in figure 3 (d), and in the lower one the apex oxygen and the Bismuth ion vibrate with opposite phases compared to figure 3 (d).
In case of HgBa2CuO4 we do not find a pronounced dip for the modes in the relevant range of energy. We obtain as a result of four interacting modes two branches with the highest frequencies showing a downward dispersion from to while the anomalous half-breathing mode is found at a lower energy and turns out to be the end point of the branch with the third highest frequency. Similar as in the case of Bi2Sr2CuO6 we find in HgBa2CuO4 two breathing modes at the point. The lower one has a displacement pattern where the apex oxygen vibrates in opposite direction as compared to the higher frequency breathing mode displayed in figure figure 3 (c).
So, we guess from our calculations for HgBa2CuO4 and Bi2Sr2CuO6 that the dip in the interpretation of the IXS-spectra may be an artefact of the complex anticrossing behaviour of several modes in the frequency range under consideration. However, we admit concerning our results, that our microscopic model for the electronic polarizability applied to the calculation of the phonon dynamics of HgBa2CuO4 and Bi2Sr2CuO6 is not fully ab initio.
The reliability of our calculated phonon dispersion may be judged from the conformance of our results with the phonon branches in HgBa2CuO4 at lower frequencies measured so far and displayed in figure 5 for the model -3dim.
The experimental and calculated results for the Raman and infrared active modes [56, 57, 58, 59, 60] are listed in table 4 for both compounds and a good agreement is found for the measured and the calculated data in model -3dim. This fact together with the good results in model -3dim for the dispersion underlines the importance of the electronic polarization processes of certain ions in the ionic layers and in general of the physics of the third dimension perpendicular to the CuO plane.

The effect introduced by the CF’s on the Oz, Hg and Bi ions outside of the CuO plane on the phonon dispersion by itself is demonstrated in figure 8 for both compounds by comparing the results of model -2dim (broken lines) with those of model -3dim (full lines). Only the branches are shown where large differences appear. The most significant renormalization of the dispersion emerges for the modes with the highest frequencies.

Finally, in figure 9, the calculated phonon density of states (DOS) is shown for HgBa2CuO4 and Bi2Sr2CuO6, respectively, and is compared with the experimental findings for both compounds. The theoretical results have been obtained with model -3dim. They compare quite well with the experimental results for both, the width of the spectra and their peak structure. Of course the assignment of the peaks is difficult in detail because the experimental data are broadened.
A calculation of the partial phonon density of states, not shown in this work, demonstrates that the DOS in the lower frequency range is dominated by Cu-, Ba-, Hg-vibrations and by Cu-, Bi-, Sr-vibrations, respectively. On the other hand, the high-frequency part of the spectrum is nearly exclusively governed by the oxygen modes.
From figure 9 (a) and (b) also the difference of the DOS in the model -3dim and the RIM generated by the electronic polarization processes can be extracted. From the calculated results we find a significant decrease of the width of the spectra together with a characteristic redistribution of spectral weight particularly in the high-frequency part. The latter is dominated by strongly coupling high-frequency oxgen vibrations living in this part of the spectra and suffering a corresponding softening compared to the RIM. The pronounced peaks which are generated by this softening also mean that there is considerable phase space for this strongly coupling modes.
4 Summary and conclusions
We have shown that for a reliable description of phonon dynamics and charge response in HgBa2CuO4 and Bi2Sr2CuO6 a broad set of orbital degrees of freedom (Cu, Cu, O) must be taken into account to model the electronic structure of the CuO plane. Moreover, for an ample representation of the real three-dimensional compounds electronic degrees of freedom beyond the strictly two-dimensional electronic structure must be considered.
We found that in the link between the CuO plane and the ionic layers of the cuprates electronic polarization processes of CF type are essential at certain ions. In HgBa2CuO4 O and Hg CF’s and in Bi2Sr2CuO6 O and Bi CF’s, respectively, are significant processes. CF’s on these ions are promoted by the short distance of the Oz-Hg and Oz-Bi bond. Allowance of CF’s on these ions outside of the CuO plane (model -3dim) leads to a much better depiction of the phonon dispersion curves, the Raman active and the infrared active modes, in particular for those where the apex oxygen vibrates along its bond with the Hg or the Bi ion, respectively.
As far as the electronic degrees of freedom in the CuO plane are concerned we have pointed out that besides the localized Cu state and the O state also the more delocalized Cu state is needed in the charge response for an adequate representation of the large softening of the high-frequency oxygen bond-stretching modes and the strong coupling to the electrons. Such an effect also has been found in our previous calculations for La2CuO4 and Nd2CuO4. The strong nonlocal coupling and the related strong renormalization of these modes seems to be generic in the cuprates.
Altogether, our calculated results for model -3dim are partly in good agreement with the phonon dispersion measured so far in HgBa2CuO4 and Bi2Sr2CuO6 and also with the Raman active and infrared active modes.
However, we have pointed out that an interpretation of the IXS measurements of HgBa2CuO4 and Bi2Sr2CuO6 in the high-frequency part of the spectrum and the assignment of dips in the corresponding phonon dispersion curves cannot be supported by our calculations. This is, because our investigations exhibit that in the frequency range under study we have multiple interacting phonon modes of symmetry (four in HgBa2CuO4 and five in Bi2Sr2CuO6) which create a complex anticrossing scenario that possibly cannot be studied correctly within a fit using just one or two modes.
Finally, we have calculated the DOS of both compounds in satisfactory agreement with experiment. We found a significant redistribution of spectral weight due to the electronic polarization processes in particular in the high-frequency part of the spectrum. This energy range is dominated by the strongly coupling oxygen modes signaling a considerable amount of phase space for strong electron phonon coupling.
References
References
- [1] Lanzara A et al 2001 Nature 412 510
- [2] Cuk T et al 2005 Phys. Status Solidi b, 242 11
- [3] Pintschovius L 2005 Phys. Status Solidi b 242 30
- [4] Gweon GH et al 2004 Nature 430 187
- [5] Zhou XJ et al 2005 Phys. Rev. Lett. 95 117001
- [6] Reznik D et al 2006 Nature 440 1170
- [7] Lee J et al 2006 Nature 442 546
- [8] Guo-meng Zhao 2007 Phys. Rev. B 75 R140510; 75 214507
- [9] Pintschovius L and Reichardt W 1998 in Neutron Scattering in Layered Copper-Oxide Superconductors, edited by Furrer A, Physics and Chemistry of Materials with Low Dimensional Structures, Vol. 20, Kluwer Academic Dordrecht
- [10] Pintschovius L and Braden M 1999 Phys. Rev. B 60 R15039
- [11] Reichardt W 1996 J. Low. Temp. Phys. 105 807
- [12] Uchiyama H et al 2004 Phys. Rev. Lett. 92 197005
- [13] Fukuda T et al 2005 Phys. Rev. B 71 R060501
- [14] Pintschovius L et al 2006 Phys. Rev. B 74 174514
- [15] McQueeney RJ et al 2001 Phys. Rev. Lett. 87 077001
- [16] Graf J et al 2008 Phys. Rev. Lett. 100 227002
- [17] d’Astuto M et al 2002 Phys. Rev. Lett. 88 167002
- [18] d’Astuto M et al 2003 Int. J. Mod. Phys. B 17 484
- [19] Braden M et al 2005 Phys. Rev. B 72 184517
- [20] Bauer T and Falter C 2008 Phys. Rev. B 77 144503
- [21] d’Astuto M et al 2008 Phys. Rev. B 78 R140511
- [22] Falter C 2005 Phys. Status Solidi b 242 78
- [23] Falter C, Klenner M and Ludwig L 1993 Phys. Rev. B 47 5390
- [24] Falter C, Bauer T and Schnetgöke F 2006 Phys. Rev. B 73 224502
- [25] Falter C et al 1997 Phys. Rev. B 55 3308
- [26] Bauer T and Falter C 2009 Phys. Rev. B 80 094525
- [27] Alexandrov AS 1992 Phys. Rev. B 46 2838
- [28] Alexandrov AS 1996 Phys. Rev. B 53 2863
- [29] Hardy TM et al 2009 Phys. Rev. B 79 212501
- [30] Falter C et al 1999 Phys. Rev. B 60 12051
- [31] Falter C 1988 Phys. Rep. 164 1
- [32] Falter C, Klenner M and Hoffmann GA 1995 Phys. Rev. B 52 3702
- [33] Falter C and Schnetgöke F 2002 Phys. Rev. B 65 054510
- [34] Perdew JP and Zunger A 1981 Phys. Rev. B 23 5048
- [35] Krakauer H Pickett WE and Cohen RE 1998 J. Supercond. 1 11
- [36] Savrasov SY and Andersen OK 1996 Phys. Rev. Lett. 77 4430
- [37] Wang CZ, Yu R and Krakauer H 1999 Phys. Rev. B 59 9278
- [38] Bohnen KP, Heid R and Krauss M 2003 Europhys. Lett. 64 104
- [39] Giustino F, Cohen ML and Louie SG 2008 Nature 452 975
- [40] Catlow CRA, Islam MS and Zhang X, 1998 J.Phys.: Condes. Matter 10 L49
- [41] Islam MS et al, 1988 J. Phys. C: Solid State Phys. 21 L109
- [42] Zhang X and Catlow CRA, 1991 J.Mater.Chem. 1 233
- [43] Longo JM and Raccah PM 1973 J. Sol. St. Chem. 6 526
- [44] Müller Buschbaum H and Wollschläger W 1975 Z. anorg. allg. Chem. 414 76
- [45] Wagner JL et al 1993 Physica C 210 447
- [46] Torardi CC et al 1988 Phys. Rev. B 38 225
- [47] Falter C and Schnetgöke F 2003 J. Phys.: Condens. Matter 15 8495
- [48] Falter C and Hoffmann G 2000 Phys. Rev. B 61 14537
- [49] Andersen OK et al 1995 J. Phys. Chem. Solids 56 1573
- [50] Pavarini E et al 2001 Phys. Rev. Lett. 87 047003
- [51] Vielsack G et al 1990 Phys. Status Solidi b 158 249
- [52] De Weert MJ et al 1989 Phys. Rev. B 39 4235
- [53] Bauer T and Falter C 2009 J. Phys.: Condens. Matter 21 395701
- [54] d’Astuto M et al 2003 J. Phys.: Condens. Matter 15 8827
- [55] Falter C, Hoffman GA and Schnetgöke F, 2002 J. Phys.: Condes. Matter 14 3239
- [56] Krantz MC et al 1994 Phys. Rev. B 55 1165
- [57] Osada M et al 1997 Phys. Rev. B 56 2847
- [58] Liu R et al 1992 Phys. Rev. B 45 7392
- [59] Singley J 2009 private communication
- [60] Kovaleva NN et al 2004 Phys. Rev. B 69 54511
- [61] Renker B et al 1996 J. Low. Temp. Phys. 105 843
- [62] Parshin PP 1996 Phys. Solid State 38 919