Temperature dependence of the nitrogen-vacancy magnetic resonance in diamond
Abstract
The temperature dependence of the magnetic resonance spectra of nitrogen-vacancy (NV) ensembles in the range of was studied. Four samples prepared under different conditions were analyzed with NV concentrations ranging from to . For all samples, the axial zero-field splitting (ZFS) parameter, , was found to vary significantly with temperature, , as . The transverse ZFS parameter, , was non-zero (between 4 and ) in all samples, and exhibited a temperature dependence of . The results might be accounted for by considering local thermal expansion. The temperature dependence of the ZFS parameters presents a significant challenge for diamond magnetometers and may ultimately limit their bandwidth and sensitivity.
Magnetometers based on nitrogen-vacancy (NV) ensembles in diamond Taylor et al. (2008); Acosta et al. (2009); Bouchard et al. (2009) promise high-sensitivity, rivaling those of superconducting quantum interference devices (SQUIDs) Clarke and Braginski (2004) and alkali vapor magnetometers Budker and Romalis (2007), in a scaleable solid state system that can be operated over a wide range of temperatures. This remarkable combination of spatial resolution Balasubramanian et al. (2008); Han et al. (2009) and magnetic sensitivity Balasubramanian et al. (2009) make diamond magnetometers promising candidates for remote-detection and low-field nuclear magnetic resonance spectroscopy Lee et al. (2005); Xu et al. (2006); Savukov et al. (2007); Ledbetter et al. (2008), nano-scale biological imaging Maze et al. (2008); Balasubramanian et al. (2008); Rugar et al. (2004); Cleuziou et al. (2006), and studies of novel magnetic and superconducting materials Kirtley et al. (1998); Bouchard et al. (2009). Until now, the temperature dependence of the magnetic resonance spectra has not been systematically studied and has only briefly been mentioned in the literature Gruber et al. (1997); Bouchard et al. (2009). In this Letter, we report a striking temperature dependence of the magnetic-resonance spectra of NV ensembles in diamond over the temperature range of . These findings have important implications for the design of diamond magnetometers and may ultimately limit their sensitivity.
The resonance spectra were recorded using the continuous-wave Fluorescence Detected Magnetic Resonance (FDMR) method He et al. (1993); Gruber et al. (1997). Light from a Argon-ion laser was focused with a focal length lens onto the diamond samples, exciting the NV centers’ optical transition via a phonon sideband Manson et al. (2006). The same lens was used to collect fluorescence from the diamond which was then passed through a dichroic mirror and a bandpass filter and detected with a photodiode. Noise due to laser power fluctuations was reduced by normalizing the fluorescence signal to a reference photodiode which monitored the incident laser power. The output of a microwave signal generator was amplified, passed through a straight diameter copper wire of length placed within of the focused light beam, and terminated with impedance. For temperature control, the diamond was thermally connected to a copper heatsink and placed inside an insulated aluminum housing. The temperatures of the heat sink and housing were controlled with separate thermoelectric (TE) elements. Unless otherwise stated, the results reported in this Letter were obtained with a magnetic field of , laser-light power of , and microwave power (after the wire) of .
For temperature scans, the temperature of the copper plate in direct thermal contact with the diamond was monitored with an AD590 sensor. The FDMR spectra were recorded with the temperature stabilized so that temperature excursions were less than over 5 min. In order to avoid stray magnetic fields when recording the spectrum, the currents supplied to both TE elements were chopped at a frequency of using photoMOS circuits, and the spectra were recorded only when the TE currents were off. The process was repeated until the temperature had been scanned through the range several times in both directions.
The NV-ensemble magnetic-resonance spectroscopy has been described, for example, in Refs. Loubser and van Wyk (1978); He et al. (1993); Alegre et al. (2007); Lai et al. (2009); Acosta et al. (2009)) and is only briefly summarized here. Optical pumping via a spin-selective decay path collects NV centers (total spin ) in the ground-state magnetic sublevel Manson et al. (2006). In the absence of external fields, the and levels are split by an energy equal to the axial zero-field splitting (ZFS) parameter, . For perfect symmetry, the transverse ZFS parameter is and the levels remain degenerate. When the frequency of a microwave field that is transverse to the symmetry axis is tuned to the energy splitting between the and levels, NV centers are transferred to the sublevels, resulting in diminished fluorescence with a contrast as high as Balasubramanian et al. (2008). In the presence of an applied magnetic field, , the levels split, revealing resonances separated by , where is the NV Landé factor Loubser and van Wyk (1978); Felton et al. (2009) and is the Bohr magneton. For ensembles, there are four different NV orientations and, provided that , only the projection of the magnetic field on the N-V axis affects the transition frequencies Lai et al. (2009).
The zero-field Hamiltonian for the ground state, including hyperfine coupling to the 14N nucleus (spin ), can be written as:
| (1) |
where and are, respectively, the axial and transverse hyperfine constants Felton et al. (2009). Analysis of this Hamiltonian reveals six allowed microwave transitions for each N-V orientation. The relative intensities can be calculated by treating the interaction with the microwave field, as a perturbation, , with matrix elements that depend on the alignment of the microwave radiation with respect to the symmetry and strain axes of each N-V center. However, since the exact geometry and the number of NV centers of each orientation were not known a priori, Gaussian functions with variable amplitudes and equal widths, centered about these transition frequencies, were fit to the spectra. Including residual magnetic fields, measured by a commercial fluxgate magnetometer to be less than , into the model did not significantly influence the fits.
Four single-crystal samples of mm-scale dimensions were studied, which were labeled S2, S3, S5, and S8 and characterized in Ref. Acosta et al. (2009).
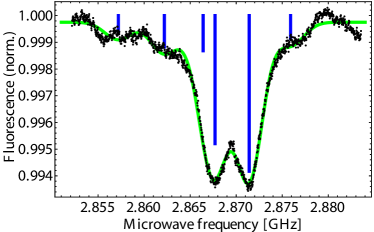
Figure 1 shows the FDMR spectrum at for S3, a sample synthesized by chemical vapor deposition (CVD) with Acosta et al. (2009). As there was no applied magnetic field, the splitting between resonance peaks is due to non-zero , induced by local strain Balasubramanian et al. (2008); Fuchs et al. (2008); Lai et al. (2009). This feature is present in varying magnitudes for all four samples. Even though all four NV orientations are present, the spectra are reasonably well-described by just six broad transitions, suggesting that the strain splittings are spatially inhomogenous Gruber et al. (1997); Nizovtsev et al. (2001). As no correlation with NV concentration was observed (see Tab. 1), further work is necessary to determine the exact strain mechanism.
During each temperature scan, the spectrum was fit to an empirical function similar to the one described above, and the ZFS parameters were extracted.
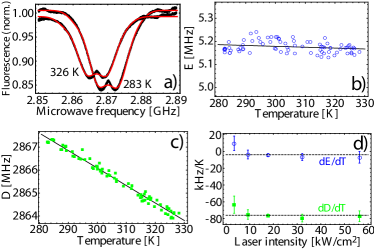
Figure 2(a) displays the spectra at two different temperatures for another sample, S8, a high-pressure, high-temperature (HPHT) synthesized diamond with , as well as the empirical fits based on Eq. 1. Figures 2(b) and (c) show the ZFS parameters as a function of temperature for this sample. Linear least-squares fits yield and . Figure 2(d) displays the laser-intensity dependence for S5, an HPHT diamond with . Linear fits (not shown) determined that any dependence of or on laser intensity is not statistically significant. Additional tests for dependence on microwave power, external magnetic field, and sample positioning also did not show statistically significant effects.
A similar procedure was performed for the three other samples: S2, an HPHT diamond with , as well as S3 and S5 (already mentioned).
| # | ||||
|---|---|---|---|---|
| S2 | ||||
| S3 | ||||
| S5 | ||||
| S8 |
Table 1 displays the temperature dependence of the ZFS parameters for each of these samples. The temperature dependence of is similar for each sample, indicating that the mechanism responsible for this temperature variation is intrinsic to the NV centers themselves. Taking a weighted average over all samples gives and, using the fitted room-temperature values for each sample (), this corresponds to a fractional temperature dependence of . The weighted average over samples of the fractional variation of with temperature (final column of Tab. 1) is also statistically significant, , but further work is necessary to understand the nature of .
The origin of is expected to be predominately due to dipolar spin-spin coupling between the two unpaired electrons forming the center Loubser and van Wyk (1978); Lenef and Rand (1996); He et al. (1993). This suggests a a likely mechanism for the temperature variation is local lattice expansion. Assuming that the angular electronic wavefunctions are temperature-independent and that is entirely due to dipolar coupling, the effect of lattice expansion on is:
| (2) |
where is the displacement between the two spins, is the component of along the N-V symmetry axis, and is the distance between two basal carbon nuclei. The effect of thermal expansion on can be estimated by treating spins, localized near the basal carbon atoms He et al. (1993); Gali et al. (2008), with -orbitals He et al. (1993); Felton et al. (2009) oriented along axes apart Goss et al. (1996), and calculating the integral for neighboring values of . Using the room-temperature values for bulk diamond of and Sato et al. (2002), we calculate , which is within of the experimental value, and , which is about a factor of smaller than the experimental value from this work. The latter discrepancy suggests that the macroscopic thermal expansion is not a good description of in the immediate vicinity of the defect. Ab initio calculations Lenef and Rand (1996); Goss et al. (1996); Luszczek et al. (2004); Gali et al. (2008, 2009) which include the determination of local thermal expansion effects would give a more accurate prediction of .
The sharp temperature dependence of presents a technical challenge for room-temperature diamond magnetometry. Even if the ambient temperature can be controlled at the level, this would lead to fluctuations in the resonance frequency of corresponding to a magnetic-field variation of . Monitoring both of the resonances could provide a feedback mechanism for controlling this effect for slow drifts, since the energy difference between these resonances does not depend on .
Higher-frequency temperature fluctuations due to, for example, laser-intensity noise, present an additional complication for magnetometry in the high-density limit. Consider the case of a Ramsey-type magnetometer making use of repeated light pulses Taylor et al. (2008); Maze et al. (2008); Balasubramanian et al. (2008, 2009) which transfer an energy to the diamond on the order of , where is the difference in energy between absorbed and radiated photons, is the effective volume being heated, and we have conservatively neglected non-radiative transfer from the NV singlet decay path Rogers et al. (2008) and other impurities Davies and Crossfield (1973). If the pulses are separated in time by a precession window, , then in steady state the diamond temperature is modulated at a rate , where is the volumetric specific heat of diamond Victor (1962). Integration over the precession window yields a magnetometer offset of at room temperature for . This offset makes the magnetometer sensitive to laser-pulse fluctuations. Uncorrelated, normally-distributed fluctuations in by a fraction produce magnetic field noise-per-unit-bandwidth at the level of , using and . We note that this magnetometer noise is directly correlated with laser-intensity noise and therefore monitoring the incident laser intensity could significantly reduce this effect.
In this work, we have measured the temperature dependence of the ZFS parameters of four diamond samples covering a wide range of NV concentrations. We have found a significant variation of the axial ZFS, , with temperature and surmise that it is due to local thermal expansion. We also present evidence of a non-zero transverse ZFS, , and measure a small fractional temperature dependence just above the experimental uncertainty. The results have a major impact on the performance of NV-ensemble magnetometers and may ultimately limit their sensitivity and bandwidth. We expect that proper feedback mechanisms, such as monitoring laser intensity fluctuations and observing both coherences simultaneously, will help to partially mitigate these effects.
The authors are grateful to A. Gali, C. Santori, P. Hemmer, F. Jelezko, E. Corsini, and O. Sushkov for valuable discussions and R. Folman for support. This work was supported by NSF grant PHY-0855552 and ONR-MURI.
References
- Taylor et al. (2008) J. M. Taylor, P. Cappellaro, L. Childress, L. Jiang, D. Budker, P. R. Hemmer, A. Yacoby, R. Walsworth, and M. D. Lukin, Nat Phys 4, 810 (2008).
- Acosta et al. (2009) V. M. Acosta, E. Bauch, M. P. Ledbetter, C. Santori, K. M. C. Fu, P. E. Barclay, R. G. Beausoleil, H. Linget, J. F. Roch, F. Treussart, et al., Physical Review B (Condensed Matter and Materials Physics) 80, 115202 (2009).
- Bouchard et al. (2009) L. S. Bouchard, E. Bauch, V. M. Acosta, and D. Budker, Detection of the meissner effect with a diamond magnetometer (2009), arXiv:0911.2533v1 [cond-mat.supr-con].
- Clarke and Braginski (2004) J. Clarke and A. I. Braginski, The SQUID Handbook, vol. 1 (Wiley-VCH, Weinham, 2004).
- Budker and Romalis (2007) D. Budker and M. Romalis, Nature Physics 3, 227 (2007).
- Balasubramanian et al. (2008) G. Balasubramanian, I. Y. Chan, R. Kolesov, M. Al-Hmoud, J. Tisler, C. Shin, C. Kim, A. Wojcik, P. R. Hemmer, A. Krueger, et al., Nature 455, 648 (2008).
- Han et al. (2009) K. Y. Han, K. I. Willig, E. Rittweger, F. Jelezko, C. Eggeling, and S. W. Hell, Nano Letters 9, 3323 (2009).
- Balasubramanian et al. (2009) G. Balasubramanian, P. Neumann, D. Twitchen, M. Markham, R. Kolesov, N. Mizuochi, J. Isoya, J. Achard, J. Beck, J. Tissler, et al., Nat Mater 8, 383 (2009).
- Lee et al. (2005) S. K. Lee, M. Mossle, W. Myers, N. Kelso, A. H. Trabesinger, A. Pines, and J. Clarke, Magnetic Resonance in Medicine 53, 9 (2005).
- Xu et al. (2006) S. J. Xu, V. V. Yashchuk, M. H. Donaldson, S. M. Rochester, D. Budker, and A. Pines, Proceedings of the National Academy of Sciences of the United States of America 103, 12668 (2006).
- Savukov et al. (2007) I. M. Savukov, S. J. Seltzer, and M. V. Romalis, Journal of Magnetic Resonance 185, 214 (2007).
- Ledbetter et al. (2008) M. P. Ledbetter, I. M. Savukov, D. Budker, V. Shah, S. Knappe, J. Kitching, D. J. Michalak, S. Xu, and A. Pines, Proceedings of the National Academy of Sciences of the United States of America 105, 2286 (2008).
- Rugar et al. (2004) D. Rugar, R. Budakian, H. J. Mamin, and B. W. Chui, Nature 430, 329 (2004).
- Cleuziou et al. (2006) J. P. Cleuziou, W. Wernsdorfer, V. Bouchiat, T. Ondarcuhu, and M. Monthioux, Nat Nano 1, 53 (2006).
- Maze et al. (2008) J. R. Maze, P. L. Stanwix, J. S. Hodges, S. Hong, J. M. Taylor, P. Cappellaro, L. Jiang, M. V. G. Dutt, E. Togan, A. S. Zibrov, et al., Nature 455, 644 (2008).
- Kirtley et al. (1998) J. R. Kirtley, A. C. Mota, M. Sigrist, and T. M. Rice, Journal of Physics-Condensed Matter 10, L97 (1998).
- Gruber et al. (1997) A. Gruber, A. Drabenstedt, C. Tietz, L. Fleury, J. Wrachtrup, and C. von Borczyskowski, Science 276, 2012 (1997).
- He et al. (1993) X. F. He, N. B. Manson, and P. T. H. Fisk, Physical Review B 47, 8816 (1993).
- Manson et al. (2006) N. B. Manson, J. P. Harrison, and M. J. Sellars, Physical Review B 74 (2006).
- Loubser and van Wyk (1978) J. Loubser and J. A. van Wyk, Reports on Progress in Physics 41, 1201 (1978).
- Alegre et al. (2007) T. P. M. Alegre, C. Santori, G. Medeiros-Ribeiro, and R. G. Beausoleil, Physical Review B (Condensed Matter and Materials Physics) 76, 165205 (2007).
- Lai et al. (2009) N. D. Lai, D. Zheng, F. Jelezko, F. Treussart, and J.-F. Roch, Applied Physics Letters 95, 133101 (2009).
- Felton et al. (2009) S. Felton, A. M. Edmonds, M. E. Newton, P. M. Martineau, D. Fisher, D. J. Twitchen, and J. M. Baker, Physical Review B (Condensed Matter and Materials Physics) 79, 075203 (2009).
- Fuchs et al. (2008) G. D. Fuchs, V. V. Dobrovitski, R. Hanson, A. Batra, C. D. Weis, T. Schenkel, and D. D. Awschalom, Physical Review Letters 101, 117601 (2008).
- Nizovtsev et al. (2001) A. P. Nizovtsev, S. Y. Kilin, C. Tietz, F. Jelezko, and J. Wrachtrup, Physica B: Condensed Matter 308-310, 608 (2001).
- Lenef and Rand (1996) A. Lenef and S. C. Rand, Physical Review B 53, 13441 (1996).
- Gali et al. (2008) A. Gali, M. Fyta, and E. Kaxiras, Physical Review B 77 (2008).
- Goss et al. (1996) J. P. Goss, R. Jones, S. J. Breuer, P. R. Briddon, and S. Oberg, Physical Review Letters 77, 3041 (1996).
- Sato et al. (2002) T. Sato, K. Ohashi, T. Sudoh, K. Haruna, and H. Maeta, Physical Review B 65, 092102 (2002).
- Luszczek et al. (2004) M. Luszczek, R. Laskowski, and P. Horodecki, Physica B-Condensed Matter 348, 292 (2004).
- Gali et al. (2009) A. Gali, E. Janzen, P. Deak, G. Kresse, and E. Kaxiras, Physical Review Letters 103, 186404 (2009).
- Rogers et al. (2008) L. G. Rogers, S. Armstrong, M. J. Sellars, and N. B. Manson, New Journal of Physics 10, 103024 (2008).
- Davies and Crossfield (1973) G. Davies and M. Crossfield, Journal of Physics C-Solid State Physics 6, L104 (1973).
- Victor (1962) A. C. Victor, The Journal of Chemical Physics 36, 1903 (1962).