Soft X-ray emission from the inner disk of M33
Abstract
We present a study, based on archival XMM-Newton observations, of the extended X-ray emission associated with the inner disk of M33. After the exclusion of point sources with LX (0.3-6 keV), we investigate both the morphology and spectrum of the residual X-ray emission, comprising the integrated signal from unresolved discrete sources and diffuse components. This residual emission has a soft X-ray spectrum which can be fitted with a two-temperature thermal model, with keV and keV, the cooler component accounting for the bulk of the luminosity. There is evidence that the X-ray emitting plasma has a subsolar metal abundance. The soft X-ray surface brightness distribution shows a strong correlation with FUV emission and since the latter serves as a tracer of the inner spiral arms of M33, this is indicative of a close connection between recent star-formation activity and the production of soft X-rays. Within 3.5 kpc of the nucleus of M33, the soft X-ray and FUV surface brightness distributions exhibit similar radial profiles. The implication is that the ratio of the soft X-ray luminosity (0.3-2.0 keV) per unit disk area to the star formation rate (SFR) per unit disk area remains fairly constant within this inner disk region. We derive a value for this ratio of , which is towards the top of the range of similar estimates for several other nearby face-on spiral galaxies (e.g. M51, M83). In the same region, the ratio of soft X-ray luminosity to stellar mass (the latter derived from K-band photometry) is , a factor of 5-10 higher than is typical of dwarf elliptical galaxies (e.g. M32, NGC3379), suggesting that 10-20% of the unresolved emission seen in M33 may originate in its old stellar population. The remainder of the soft X-ray emission is found to be equally split between two spatial components, one which closely traces the spiral arms of the galaxy and the other more smoothly distributed across the inner disk of M33. The former must represent a highly clumped low-filling factor component linked to sites of recent or ongoing star formation, encompassing HII regions, X-ray source complexes and X-ray superbubbles, whereas the distribution of the latter gives few clues as to its exact origin.
keywords:
Galaxies: ISM – galaxies: spiral – X-rays: galaxies1 Introduction
On the basis of current observations, the X-ray emission of spiral galaxies may be separated into several components. A very significant contribution generally arises from a set of resolved point sources which correspond to the most luminous examples of the galactic X-ray binary population, encompassing both high-mass (HMXB) and low-mass (LMXB) systems. To this must be added the integrated emission from large numbers of lower-luminosity sources, including supernova remnants (SNRs), more quiescent forms of X-ray binary, cataclysmic variables, and coronally active stars. Finally we need to include the thermal X-ray signal emanating from concentrations of truly diffuse million-K gas resident both in the galactic disk and potentially extending into the galactic halo. The extent to which these components can be distinguished from each other depends on the orientation and distance of the target galaxy and, of course, on the spatial resolution and threshold sensitivity afforded by the observation.
Early X-ray studies based on Einstein observations focussed on the brightest point sources seen in a number of nearby galaxies, whilst also finding underlying extended emission in complex structures (Fabbiano 1989). The superior spatial resolution and soft response of Rosat further progressed the field, for example allowing the extent of the apparently diffuse emission to be traced both in and out of the plane of the disk for face-on and edge-on systems respectively (e.g. Read et al. 1997; Dahlem et al 1998). More recent investigations, which exploit the enhanced collecting area, spatial resolution and spectral sensitivity of XMM-Newton and Chandra, have probed the point-source populations in galaxies to much fainter thresholds than previously attainable (e.g. Strickland et al. 2004a; Colbert et al. 2004). The X-ray luminosity functions (XLF) typical of the HMXB and LMXB populations seen in spiral galaxies have thereby been determined (Grimm et al. 2005; Kilgard et al. 2005; Fabbiano 2006). By extrapolation of the XLF to fluxes below the threshold at which individual sources can be resolved, the total aggregated luminosity of a particular class of source may also be inferred (Sazonov et al. 2006)
In two previous papers (Warwick et al. 2007, hereafter W07; Owen & Warwick 2009, hereafter OW09), we studied the morphology of the underlying unresolved soft X-ray emission in a sample of six nearby face-on spiral galaxies and made a comparison with other wavelength, particularly FUV, measurements. These studies confirmed the close connection between recent star-formation and the production of soft X-rays. We also investigated how the soft X-ray luminosity to star-formation rate (SFR) ratio varied radially within the individual galaxies as well as from galaxy to galaxy, and found some evidence for an enhanced efficiency in the production of soft X-rays in regions of high SFR density. The link between soft X-rays and star formation can be further explored by studying galaxies closer to us, in which the majority of HMXBs and LMXBs can be readily resolved, so as to provide a relatively clear perspective of the underlying soft X-ray emission. It is in this context that we focus in the present paper on M33.
M33 is an Sc spiral galaxy with an inclination of (Zaritsky, Elston & Hill 1989) at a distance of 795 kpc (van den Burgh 1991). As the the third largest galaxy in the Local Group, the relative proximity of M33 permits detailed study of its discrete X-ray source population and enables the separation of these sources from any residual emission in the disk to a relatively faint threshold. The relatively low Galactic foreground (; Kalberla et al. 2005) in the direction of M33, the low to moderate inclination of the galaxy, and its relatively high SFR in comparison to other nearby systems (0.3-0.7yr-1, Hippelein et al. 2003) make M33 an ideal candidate for the present study.
Early Einstein observations of M33 revealed a total of 17 point sources, including the bright ULX M33 X-8 (Long et al. 1981; Markert & Rallis 1983; Trinchieri, Fabbiano & Peres 1988). Trinchieri, Fabbiano & Peres (1988) also found evidence for the presence of a soft diffuse component in the plane of the galactic disk. ROSAT observations (Schulman & Bregman 1995; Long et al. 1996) expanded the known population of X-ray point sources in the direction of M33 to a total of 184 (Haberl & Pietsch 2001). More recently, using XMM-Newton data, a total of 350-400 X-ray point sources to a limiting X-ray luminosity of have been identified and categorized (Foschini et al. 2004; Pietsch et al. 2004; Grimm et al. 2005; Misanovic et al. 2006; Grimm et al. 2005). These results have been complemented by recent studies of M33 using Chandra (Plucinsky et al. 2008; Williams et al. 2008) which have increased the source statistics particularly in the confused inner regions of the galaxy. Most of the emphasis to date has been on the X-ray emission from point sources, but Haberl & Pietsch (2001), Pietsch et al. (2004) and Tüllman et al. (2008) have noted the presence of seemingly diffuse structures along the spiral arms. It is this latter component which we examine in this paper.
Here, we focus on the spectral and spatial properties of the unresolved X-ray emission from the inner disk of M33, deduced from archival XMM-Newton observations. In §2, we describe the set of observations used to construct soft-band X-ray images and outline the methods used in the subsequent data analysis. In §3, we briefly examine the properties of the resolved discrete point source population and the spatial distribution of the residual soft X-ray emission, which remains after the contribution of these sources is excluded. We go on to compare the soft X-ray morphology with GALEX FUV measurements and 2MASS K band data. We follow this with spectral analysis of the bright point source population and unresolved residual emission (§4). We examine the spatial extent of the X-ray emission in comparison with star formation data and the underlying mass distribution (§5) for M33, and compare these relationships to those found in other galaxies. Finally we discuss the implication of our results (§6) and summarize our conclusions (§7).
| Galaxy | Observation ID | Start Date | Filter a | Target co-ordinates | Useful exposure (ks) | ||||
|---|---|---|---|---|---|---|---|---|---|
| (yyyy-mm-dd) | pn/MOS1/MOS2 | RA (J2000) | Dec (J2000) | pn | MOS 1+2 | ||||
| M33 | 0102640101c | 2000-08-04 | M/-/- | b | 7.1 | - | |||
| 0102640201 | 2000-08-04 | M/M/M | 11.8 | 31.5 | |||||
| 0102640301 | 2000-08-07 | M/M/Tn | 3.6 | 9.5 | |||||
| 0102640401 | 2000-08-02 | Tk/Tk/Tk | 9.1 | 23.1 | |||||
| 0102640501 | 2001-07-05 | M/M/M | 9.2 | 23.1 | |||||
| 0102640601 | 2001-07-05 | M/M/M | 4.5 | 11.9 | |||||
| 0102640701 | 2001-07-05 | M/M/M | 6.9 | 21.9 | |||||
| 0102640801 | 2001-07-07 | -/M/M | - | 3.2 | |||||
| 0102640901 | 2001-07-08 | M/M/M | 3.9 | 11.2 | |||||
| 0102641001 | 2001-07-08 | M/M/M | 1.5 | 16.3 | |||||
| 0102641101 | 2001-07-08 | M/M/M | 8.0 | 21.0 | |||||
| 0102641201 | 2000-08-02 | Tk/Tk/Tk | 12.0 | 7.2 | |||||
| 0102642001 | 2001-08-15 | M/M/M | 8.8 | 22.3 | |||||
| 0102642101 | 2002-01-25 | M/M/M | 10.0 | 24.3 | |||||
| 0102642201 | 2002-01-25 | M/M/M | 11.5 | 27.3 | |||||
| 0102642301c | 2002-01-27 | M/M/M | 9.9 | 24.1 | |||||
| 0141980101 | 2003-07-11 | M/M/M | 6.2 | 13.2 | |||||
| 0141980301 | 2003-07-25 | -/M/M | - | 1.2 | |||||
| 0141980501 | 2003-01-22 | M/M/M | 1.9 | 17.0 | |||||
| 0141980601 | 2003-01-23 | M/M/M | 11.0 | 25.9 | |||||
| 0141980701 | 2003-01-24 | M/M/M | 4.4 | 11.4 | |||||
| 0141980801c | 2003-02-12 | M/M/M | 7.8 | 19.8 | |||||
a - Tn = thin filter, M = medium filter, Tk = thick filter
b - Assumed position of the galactic nucleus.
c - Observations used for spectral analysis.
2 Observations and Data Reduction
In two previous papers (W07, OW09) we reported the results of an XMM-Newton study of six nearby face-on galaxies, namely M101, M83, M51, M74, NGC300 and NGC3184. Here we use similar methods to incorporate M33 into our sample. Since the D25 diameter of M33 is 70′, which is more than a factor two larger than the 30′ field of view of the European Photon Imaging Camera (EPIC) instrument on XMM-Newton, multiple-pointings are needed to give good coverage of the inner disk of M33. The survey conducted by Pietsch et al. (2004) matches this requirement and in the present work we have accessed the revelant datasets via the XMM-Newton public archive. Details of the observations which comprise the M33 survey are summarised in Table 1.
Data reduction was based on SAS v8.0. The datasets were screened for periods of high background through the creation of full-field 10–15 keV lightcurves. MOS data were excluded when the 10–15 keV count-rate in a 100 s bin exceeded 0.2 , whereas pn data were excluded when the count rate in the same waveband exceeded 2 . The resulting exposure times after filtering the observations, as reported in Table 1, range from 1.5 to 13 ks in the pn camera, with typically somewhat greater exposure in the individual MOS cameras. Several of the pn datasets which include the bright ULX near the nucleus of M33 are affected by Out Of Time (OoT) events. The SAS task epchain was used to create “OoT event lists”, which simulate the spatial distribution of OoT events in the observations. From these event lists, images of the distribution of OoT events were produced. These images were subtracted from the raw images produced from the original event lists to produce images cleaned of OoT events, which could then be used for imaging analysis. Additionally, the target observations were examined to look for evidence of solar wind charge exchange (SWCX) emission, using the methods detailed in Carter & Sembay (2008). One observation was found to be highly contaminated (obsid:0141980201) and was thus excluded from the dataset.
In OW09 it was shown how an appropriate spatial mask could be used to excise the bright source population from the residual emission, thereby greatly reducing the “contamination” due to the former. Here we employ a slightly modified version of this image processing technique, necessitated by the need to mosaic the data sets from the M33 survey observations.
2.1 Image Construction
The methods we have employed to produce the X-ray images of M33 mirror the procedures described in OW09. For consistency, we use the same soft, medium and hard energy bands (0.3–1 keV, 1–2 keV and 2–6 keV respectively), although in the present paper emphasis is placed on the soft band, which contains the majority of the diffuse signal. Images and exposure maps were extracted for all three bands and cameras for each observation. A constant particle rate, estimated from the corners of the detector not exposed to the sky, was subtracted from each image and the set of images for a given bandpass were co-added using the method detailed in OW09, with a position offset dependent on the pointing direction of the observation. As the majority of observations were conducted using the medium filter, factors were derived to convert observations with the thin and thick filters to the same relative intensity scale. The exposure maps were likewise mosaiced to produce a single exposure map for the extended field. Finally, flat-fielding was achieved by dividing the mosaiced image for each band by the relevant exposure map.
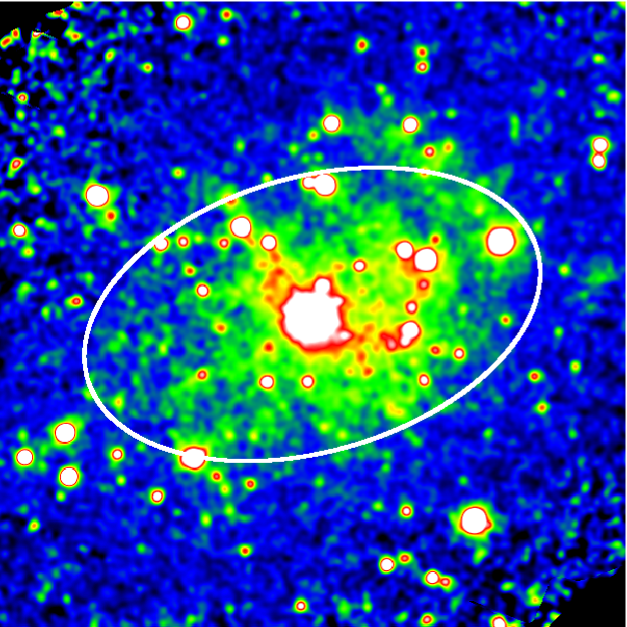
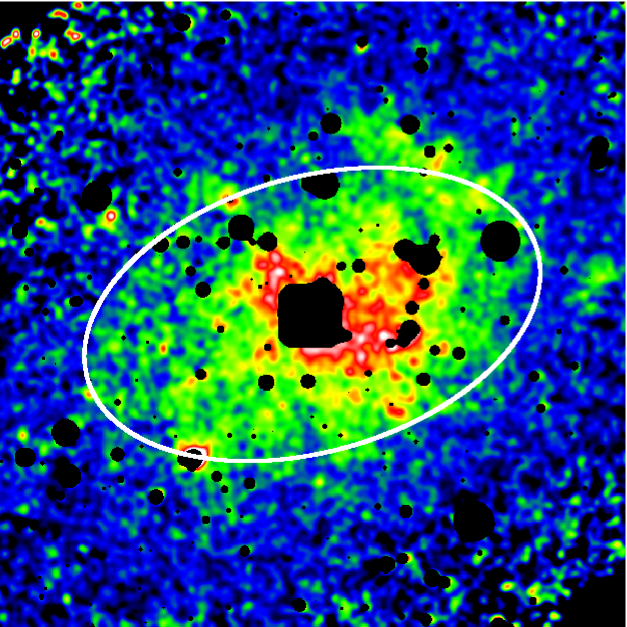
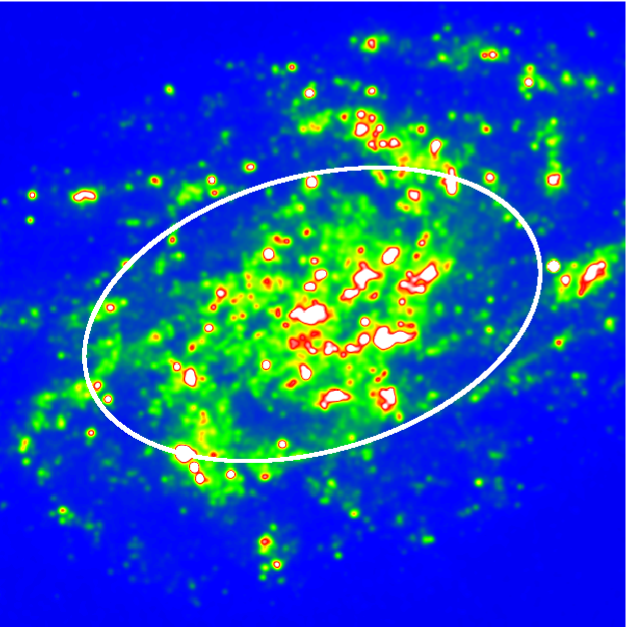
At this stage it proved necessary to apply an iterative adjustment to the particle background estimates, so as to create a visually flat image. This was achieved by imposing a mask on the flat-fielded images consisting of a point-source mask (see §2.2) coupled with an elliptical mask extending to a major axis radius of 15′ from the nucleus of the galaxy. The ellipticity of the latter was fixed at the major/minor axis ratio reported in the RC3 catalogue (de Vaucouleurs et al. 1991) for M33, that is 1.7:1, with the position angle of the major axis set to 22∘ (Corbelli & Walterbos 2007). We next imposed the requirement that the level of the X-ray sky background should be constant in the flat-fielded images outside of the masked region (i.e. we assume that there are no significant gradients in soft X-ray background across the full field of the survey and also that there is negligible contribution from M33 in this outer region). This did in fact appear to be justified based on visual inspection of the raw images. Next, the average level of the sky background in the un-masked region of the image was calculated. Using this average value, the particle background rates for each observation then were revised, so as to force the sky background outside of the masked region in each observation to this average. The resulting mosaiced and flat-fielded images of M33 in the soft and medium bands are shown in Fig. 1.
We note that given the above, radial analysis of the surface brightness distributions contained within the M33 images is only justified for the region extending from the nucleus to a major-axis radius of 15′. This equates to of the D25 region and to a radial linear extent of 3.5 kpc at the distance of M33. We describe this region hereafter as the inner disk of M33.
2.2 Spatial masking of bright sources
The catalogue of sources used to produce a bright-source spatial mask for M33 was taken from the work of Misanovic et al. (2006), who reported 350 X-ray sources across the D25 disk of M33 above a luminosity of . Ninety-two of these sources lie within the elliptical region defined in §2.1 (see Table 2 for summary details). Following the methods described in OW09, a model “bright-source image” was created for M33. A surface brightness cut was applied to this image at a level of 0.07 pn+MOS1+MOS2 to produce the source mask (see Fig.1). We estimate the “spillover” fraction of this mask, i.e. the fraction of the bright-source signal not contained within the masked region, to be . This mask was used to divide the inner disk region into two components, namely a “bright-source region” and a “residual-emission region” (using the terminology of OW09), which could then be subject to appropriate spatial and spectral analysis111The source mask is square in the region of the very bright central source due to clipping of the specified surface brightness contour at the edge of the sub-image used to represent the point spread function. The leakage of flux from the bright central source is calculated with respect to the mask actually employed.. In the image analysis, low-level contamination of the residual-emission signal by the spillover from the bright sources was further suppressed by subtracting the simulated image from the corresponding pn+MOS image and reimposing the source mask. In contrast, for spectral analysis, the spillover was accounted for by including a bright-source contribution in the spectral fit of the residual emission.
| Galaxy | X-ray extenta | Major-axis PA | Threshold LXb | Number in | Number of high LX sources |
| (′) | (∘ ) | () | Source List | (LX) | |
| M33 | 30.0/17.6 | 22 | 2.0 | 92 | 1 |
a - The major/minor axis diameters of the “X-ray extraction region”.
b - Nominal LX threshold applied in the 0.3–6 keV band
in defining the bright-source sample.
| Galaxy | Spillover/Area | Component | LX() | |||
|---|---|---|---|---|---|---|
| Factors (%) | (0.3-1 keV) | (1-2 keV) | (2-6 keV) | (0.3-6 keV) | ||
| M33 | 4/6 | Bright sourcesa | 5.6 | 4.0 | 6.2 | 15.8 |
| Unresolved sourcesb | [0.06] | [0.04] | [0.07] | |||
| Residual emission | 1.1 | 0.1 | - | 1.2 | ||
| Total measured | 6.7 | 4.1 | 6.2 | 17.0 | ||
a - Down to a threshold LX= .
b - Extrapolated to the lower limit LX=
2.3 Spectral Extraction
The soft-band image in Fig. 1 demonstrates the existence of an extended emission component in addition to the population of bright point sources. On the basis of the approach described earlier, we extracted the integrated pn spectrum of both the bright-source region (bounded by the spatial mask) and the residual-emission region (corresponding to the full X-ray extraction region less the source-masked area). This process was carried out for the three observations indicated in Table 1, which were chosen as they encompass the central region of the galaxy with reasonable observation times. A narrow strip of one CCD contaminated by Out of Time (OoT) events from the ULX was excised in each observation. The SAS tools arfgen and rmfgen were used to produce appropriate Auxiliary Response File (ARF) and Response Matrix File (RMF) files for the source and residual galaxy regions, and the counts recorded in adjacent (raw) spectral channels were summed to give a minimum of 20 counts per spectral bin in the final set of spectra.
The large extent of the bright-source and residual-emission regions makes the process of determining appropriate background spectra more complex than for most XMM-Newton applications. In OW09, we used appropriately scaled spectra from an annulus surrounding the defined galaxy region and the corner regions of the detector to approximate the background. This process is not viable for M33 as the central galaxy field covers too large a fraction of the EPIC pn field of view, thus making the extraction of an adequate background region impossible. We therefore used a combination of “blank-sky” fields extracted from a region of sky close to M33 (to minimize the difference in the sky X-ray background) and “filter-wheel closed” data to produce a background spectrum. Using the SAS tool skycast, a co-added blank-sky pn image was rotated to the same attitude as each observation, and the spatial mask imposed for the bright source and residual regions. Spectra were then extracted from these areas and scaled to the same exposure time as the actual observation. The same process was followed for filter-wheel closed data to produce a particle background spectrum. The source and blank-sky spectra were then compared in the 8–12 keV band, where the signal is dominated by the particle background. The difference in this signal was compensated for by addition of a relevant fraction of the filter-wheel closed spectrum, the effect of which was to ensure the particle background level for source and background spectra was the same.
3 Properties of the galactic X-ray emission
3.1 The contribution of luminous point sources
The relative proximity of M33 means that point sources in this galaxy can be resolved (and excluded) down to a luminosity threshold of (0.3–6 keV), which is times deeper than was the case for the majority galaxies in our earlier study (OW09). A significant fraction of X-ray luminosity deriving from HMXBs and LMXBs in M33 can thereby be excluded. Using a conversion from count-rate to luminosity derived from the spectral fit of the bright point source population in the galaxy, we measure the summed X-ray luminosity (0.3–6 keV) of the bright sources contained within the source mask to be , to which the bright ULX, M33 X-8 makes a dominant contribution. We determine the X-ray luminosity of this individual source (averaged across the set of M33 survey observations) to be (0.3–6 keV), broadly consistent with the measurements reported by Grimm et al. (2005) and Misanovic et al. (2006), who report a luminosity of (0.2–4.5 keV). This source is detected within of the optical nucleus of the galaxy (Dubus & Rutledge 2002), but short-term variability in its X-ray emission suggests that it is not the galactic nucleus itself. Analysis by Foschini et al. (2004) suggests that the object is a black hole of mass 10 accreting at a super-Eddington rate.
Table 3 summarizes the distribution across the soft, medium and hard energy bands of the integrated luminosity contained within the bright-source region (with the conversion from count rate to flux and hence luminosity estimated from the best-fitting spectral models reported in §4.2). The X-ray luminosity pertaining to the residual-emission component is similarly reported. The quoted LX figures are corrected for foreground galactic absorption. Correction factors were also applied for spillover of source counts into the residual-emission region and for the underlying extended-emission component contained within the source mask.
It is possible to estimate the integrated X-ray luminosity of point sources below our luminosity threshold, assuming such sources have similar characteristics to the resolved source population. For this, we use the Chandra M33 observations of Grimm et al. (2005), who study a similar area of the galaxy as considered here. Grimm et al. (2005) derive an XLF with a slope of -(0.74–0.78), which we use to estimate the total integrated LX for sources between and . The results are given in Table 3, and show that unresolved X-ray binaries do not contribute significantly to the residual X-ray emission observed in the soft band, but may form a significant contribution to the emission observed above 1 keV. This implies that the residual-emission component largely arises as the integrated emission of lower-luminosity source populations such as cataclysmic variables and active binaries plus truly diffuse emission associated with the inner disk of M33, presumably energized by the collective effect of supernovae explosions and stellar winds.
3.2 Morphology of the soft X-ray emission
M33 contains a two-armed grand-design spiral structure with spiral arms extending to a radius of 10′ as observed in the near infrared (Regan & Vogel 1994), along with a bar structure in the inner 1.5′. Far infrared and radio observations confirm this structure, with the southern spiral arm the most prominent emission region in the galaxy across all of these wavebands (Hippelein et al. 2003; Tabatabaei et al. 2007). The soft X-ray image of M33 (Fig. 1) clearly shows substantial, apparently diffuse emission distributed across the inner disk of the galaxy, with the overlaying pattern of the spiral structure particularly pronounced in the region of the southern arm. Narrow X-ray structures are similarly observed along the northern spiral arm, although they are noticeably less luminous. The soft X-ray emission can be traced out to a radius of 15′ beyond which the signal drops below the level of the X-ray background.
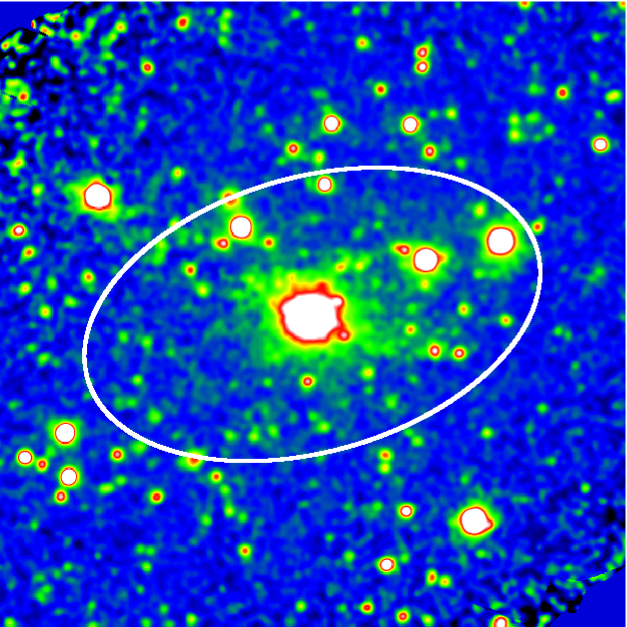
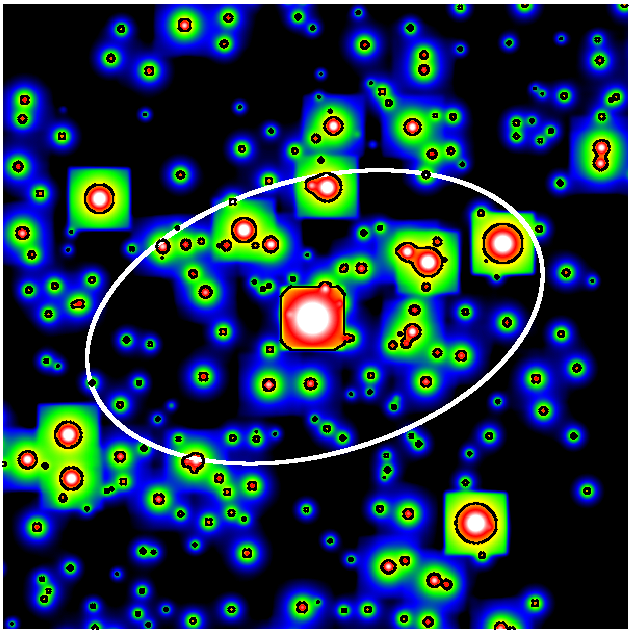
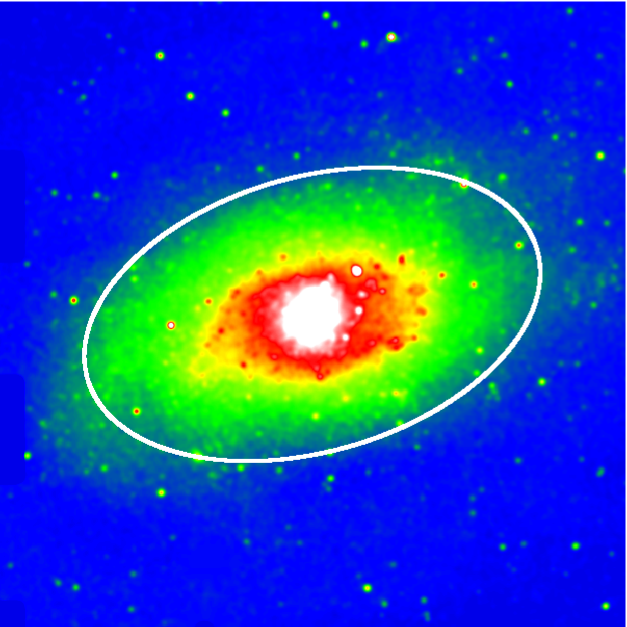
Fig. 1 shows a comparison of the soft (0.3–1 keV) X-ray morphology of M33 with corresponding FUV (Å) and near-infrared K-band measurements. The FUV data are from GALEX (Gil de Paz et al. 2007) and the K-band data from the 2MASS survey (Skrutskie et al. 2006; mosaic images provided by T. Jarrett (IPAC)). The GALEX and K-band images were resampled to the same spatial scale as the XMM-Newton images, and were then lightly smoothed with a gaussian mask with (roughly matching the XMM point-spread function). The FUV emission traces the locations of recent star formation, which in turn map out an underlying spiral structure. In contrast the K-band emission shows a relatively smooth azimuthal distribution coupled with a sharp decrease in the surface brightness with increasing galactocentric radius. The soft X-ray morphology appears to share some of the characteristics of both FUV and K-band images, and the association of the X-ray emission with each of these components is explored more quantitatively in Section 5.
4 Spectral Analysis
The methodology outlined in §2.3 was employed to extract bright-source and residual-emission spectra for the three observations identified in Table 1. Only EPIC pn data were used in the spectral fitting, since the pn camera has superior sensitivity to the MOS cameras in the soft band. The bright-source spectrum was fitted separately for each observation to allow for possible spectral variations between observations (and also to take account of the fact that some of the sources encompassed by one observation might fall outside the field of view in another), whereas the three residual-galaxy spectra were fitted simultaneously. The spectral fitting was carried out using the software package XSPEC version 12.5.
4.1 Spectra of the bright-source region
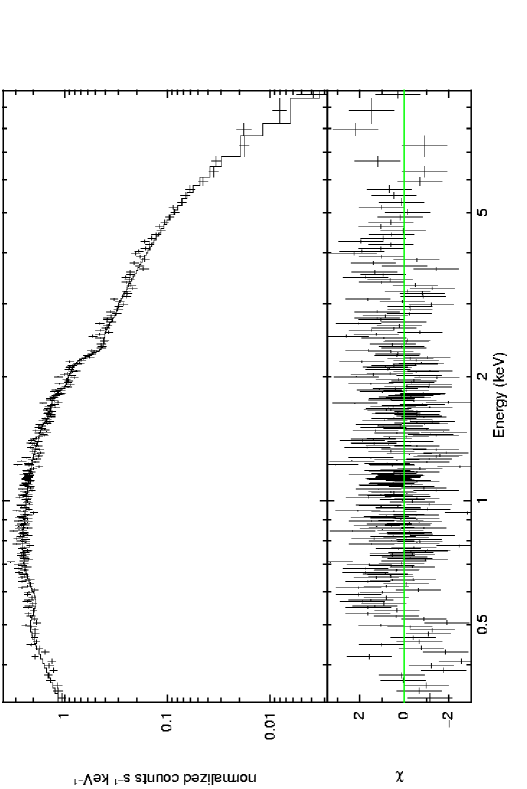
As noted earlier, the X-ray luminosity of the bright-source population of M33 is dominated by M33 X-8, the ULX close to the nucleus of the galaxy. It follows that our bright-source spectra will also be dominated by this source. We conducted the spectral fitting by first extracting and then modelling the spectrum of the ULX alone using the combination of a multicolour black-body disk component and a power-law continuum, both subject to some intrinsic absorption (see Foschini et al. 2004). The spectrum of the ULX appears to change marginally between observations, reflecting the long-term spectral variability of this source. Next we modelled the bright-source spectra extracted from the full masked region by combining an unabsorbed power-law component with the ULX contribution, the former representing the emission of the other bright sources (mainly LMXBs and HMXBs) in M33. Fig. 2 (top panel) illustrates the bright-source spectrum and derived composite best-fit spectral form for one of the observations. The separate contributions of M33 X-8 and the other bright sources to the composite bright-source spectrum are listed in Table 4 for each observation.
We estimate that of the flux from the ULX leaks beyond the source mask into the residual galaxy region, whereas the corresponding value for the other bright sources is (the difference reflecting the use of a fixed surface brightness cut to define the source mask). These percentages were used when modelling the bright-source spillover into the residual-emission region.

| Observation | Region | Intrinsic | Power-law | Disc BB | Cool MEKAL | Hot MEKAL | Goodness | Cool:Hot | |
|---|---|---|---|---|---|---|---|---|---|
| Index | keV | keV | keV | of Fit | Flux Ratio | ||||
| Normalization | Normalization | Normalization | Normalization | /dof | (0.3–2 keV) | ||||
| 0102640101 | Bright Source: | 2.610.04 | 1.160.01 | - | - | - | |||
| M33 X-8 | 0.318 | ||||||||
| Bright Source: | - | 1.700.06 | - | - | - | - | - | ||
| Other | |||||||||
| Composite Fit | - | - | - | - | - | 676/703 | - | ||
| 0102642301 | Bright Source: | 2.900.08 | 1.230.03 | - | - | - | - | ||
| M33 X-8 | 0.150 | ||||||||
| Bright Source: | - | 2.040.02 | - | - | - | - | - | ||
| Other | |||||||||
| Composite Fit | - | - | - | - | - | 720/723 | - | ||
| 0141980801 | Bright Source: | 2.300.03 | 1.160.02 | - | - | - | - | ||
| M33 X-8 | 0.143 | ||||||||
| Bright Source: | 1.860.07 | - | - | - | - | - | |||
| Other | |||||||||
| Composite Fit | - | - | - | - | - | 709/672 | - | ||
| Combined | Residual Galaxy | - | - | - | 0.170.01 | 0.590.03 | 1337/1266 | 4.5 | |
| Solar-abundance | |||||||||
| Combined | Residual Galaxy | - | - | - | 0.180.01 | 0.630.07 | 1254/1265 | 4.2 | |
| Free-abundancea |
a - Residual emission fit at 103% solar abundance.
| Galaxy | Radiusa | Component | Electron Density | Thermal Energy | Cooling Timescale |
| kpc | (keV) | yr | |||
| M33 | 3.5 | 0.2 | 4.1 | 4.4 | 17 |
| 0.6 | 1.4 | 4.8 | 61 |
a - Assumed radius of a putative shallow halo component (see text)
4.2 Spectra of the residual-emission region
The three spectral datasets which were selected as representative of the residual emission are shown in Fig. 2. As a preliminary step these datasets were checked for short-term variability at keV indicative of the presence of OVII geocoronal SWCX emission. No evidence for such contamination was found and in fact the three observations give a consistent measure of the strength of the OVII line when interpreted as thermal emission from M33 (see below). Nevertheless we cannot completely rule out the presence of some residual OVII emission associated with heliospheric SWCX, for which the variability timescale would be relatively long.
The residual-emission spectra were modelled with a combination of two thermal plasma (Mekal) components both subject to line-of-sight absorption in the Galactic foreground, (Kalberla et al. 2005). Initially the two thermal components were constrained to solar metal abundances. A “cool” thermal component at kT keV, together with a “hot” thermal component at kT keV provided a reasonable fit to the spectral data (=1.05 for the fit to all three spectra). Allowing the metallicity of the two thermal components to vary independently resulted in a constrained fit only for the cool component. With the abundances of the two components tied, the best fit was obtained for a metallicity relative to solar of 103%. The resulting improvement in the (=0.99 for the spectra set as a whole) was highly significant as measured by the F-test. Details of these spectral fitting results are summarised in Table 4 and the resulting best-fitting model spectrum (with subsolar abundances) is illustrated in Fig. 2.
Several authors (e.g. Strickland & Stevens 1998; W07) have noted that when attempting to fit low-resolution X-ray spectra pertaining to complex multi-temperature plasmas with over-simplified one- or two-temperature models, then a requirement for strongly sub-solar abundances is often the outcome, alas an erroneous one. Notwithstanding this cautionary note, in the present case, the introduction of a sub-solar abundance does improve the spectral fit and more specifically removes a soft excess otherwise apparent in the residual-galaxy spectrum below 0.5 keV. This is evidence, albeit tentative, that the low-metal abundance may not necessarily be a fitting artifact in this case. Interestingly the adoption of sub-solar abundances would also compensate for the apparent soft X-ray excesses found previously in M51 and M83 (OW09), although for these sources the signal to noise ratio was insufficient to give useful individual constraints. In the case of M33, the subsolar metallicity inferred from the soft X-ray spectroscopy is also in line with studies of its HII regions, for which O/H abundances a factor of 2-3 below solar have been reported (Crockett et al. 2006).
The X-ray luminosity of the residual-emission component in M33 is (0.3–2 keV). This is approximately 10 times lower than the value inferred for the majority of the galaxies studied by OW09 - consistent with M33 being a relatively low-mass system in a satellite orbit around M31. The measurement of a thermal spectrum which may be characterised by temperatures of and keV is consistent with many previous results for normal and starburst galaxies (e.g. Ehle et al. 1998; Fraternali et al. 2002; Soria & Wu 2003; Kuntz et al. 2003; OW09). In M33 the relative contribution of the two thermal components in the 0.3–2 keV band is 4.2:1, with the cool component dominant. M33 is therefore spectrally similar to M74, M101 and NGC3184, as opposed to M51 and M83, where there is a more equal weighting between the two thermal components.
We can derive the physical properties of the diffuse gas from the derived spectral parameters. If we assume that the majority of the residual emission we observe is truly diffuse and is contained within a cylindrical disk of major-axis radius 15′(i.e. a linear dimension of 3.5 kpc) and half-width 0.5 kpc, we can estimate the electron density, the thermal energy and cooling timescale for each thermal component. The results are summarised in Table 5. The thermal energy contained in the two components is comparable, implying that these components they may be in rough pressure balance.
5 Spatial Analysis
In an earlier study (W07), we found that when we compared the observed soft X-ray surface brightness distribution of M101 with corresponding datasets measured in several optical to ultraviolet wavebands, the best correlation was obtained with the U-band image. This was interpreted in terms of an X-ray signal comprised of two distinct spatial components, namely a clumpy thin-disk component which traces the spiral arms of the galaxy, and an underlying spatially-smooth component which contributes significantly to the central concentration of the soft X-ray emission. The soft X-ray morphology of M33 (see §3) appears to bear some similarity to that of M101 in that it is possible to discern both the spiral arm structure (which clearly dominates the corresponding FUV image) and a smoother underlying component (a template for which might be provided by the K-band image).
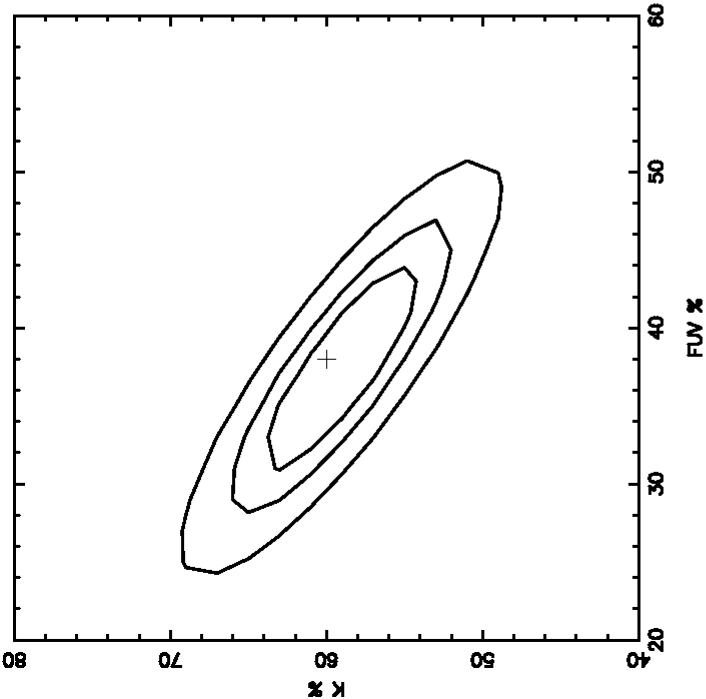
To explore the above idea further, we have investigated the degree to which a “synthetic X-ray image” produced as a linear combination of the FUV and K-band images can be made to mimic the observed soft X-ray emission. To this end, the soft X-ray, FUV and K-band images shown in Fig.1 were all spatially masked so as to simultaneously suppress the bright X-ray point sources, several FUV regions with very high surface brightness and some bright foreground stars visible in the K-band image. The three images were then compressed to a pixel scale. A synthetic image formed by summing scaled-versions of the FUV and K-band images was then compared to the corresponding soft X-ray image through the computation of a statistic (calculated on a pixel-by-pixel basis and summed over the set of pixels within the elliptical inner disk region defined earlier). By varying the relative contributions of the FUV and K-band images to the synthetic image we were thereby able to identify the best-fitting combination. The best fit was in fact obtained when the FUV template image contributed 40% of the total signal (in the synthetic image) and the K-band equivalently 60% (see Fig.3). This analysis confirms a direct association between recent star formation and soft X-ray emission in the inner galactic disk of M33. However, it also points to a substantial contribution from an underlying component correlated with the K-band light, which in turn traces the old stellar population of the galaxy and, to first order, the galactic stellar-mass distribution (see §6).
In OW09, we derived the azimuthally-averaged radial profiles of the soft X-ray emission observed in six late-type spiral galaxies and used these measurements, in conjunction with published SFR data, to derive quantitative estimates of the ratio of the soft X-ray emission per unit disk area to the local star formation rate (SFR) per unit disk area. Here we determine the same information for M33 using the same methodology as OW09, except that since M33 is of intermediate inclination, with a major/minor axis ratio of 1.7, in this case it is necessary to use elliptical annuli centred on the galactic nucleus in order to determine the radial profiles. Due to the presence of the ULX near the galactic nucleus of M33, we extracted data from the spatially-masked soft X-ray image between major-axis radii of and , beyond which the soft X-ray emission falls to near the background level. The corresponding range of linear extent at the distance of M33 is 0.46 to 3.2 kpc. In the analysis which follows, we use the FUV and K-band radial profiles tabulated in Munoz-Mateos et al. (2007).
The K-band and soft X-ray radial profiles (Fig.4, top panel) show very similar rates of fall-off between 0.5 and 3 kpc; Munoz-Mateos et al. (2007) quote a scale length of 1.48 kpc for the K-band photometry. In contrast, the FUV radial profile although of comparable slope to the X-ray and K-band curves outside of 2 kpc, appears to flatten at smaller radii. Although, given the background uncertainties, we are unable to place quantitative limits on the level of the soft X-ray emission much beyond 3 kpc, visual inspection of the X-ray images suggest that the soft X-ray signal declines very sharply outside of the inner-disk region. This rapid switch-off is reminiscent of a similar effect evident in NGC300, M74, M51 and M101 (OW09).
Fig. 4, (second panel) shows a comparison of the soft X-ray luminosity in the 0.3-1 keV band (per unit disk area) with the SFR (per unit disk area) (the latter as tabulated in Munoz-Mateos et al. 2007). More specifically the ratio of these two quantities has a value of ( yr-1)-1, at a radius 0.5 kpc, with evidence for a modest decline (by a factor dex0.2) across the sampled region. In order to make a direct comparison with the results for the galaxies studied in OW09, we need to apply two corrections as follows: (i) we convert the X-ray luminosities to a broader 0.3– 2 keV band using the spectral models discussed in (§4.2 - this results in an upward scaling of the X-ray/SFR ratio by 5%); (ii) we correct the X-ray luminosities to a common point source exclusion threshold of LX= (0.3-6 keV) (in the case of M33 this involves integrating the luminosity encompassed by its point-source XLF over the range LX= ) - this results in a further upward scaling of 50%. The resulting estimate of the X-ray/SFR ratio of ( yr-1)-1 lies towards the upper end of the range observed to date, at a very similar level to that pertaining to the inner disks of M51 and M83 (cf. Fig.5, OW09, where for M33 the parameter log(SFR density) ranges from -8 to -7.5)222In the discussion section of OW09, the upper bound of the X-ray to SFR ratio was quoted as ( yr-1)-1. This included an additional scaling factor of 3.4 arising from the conversion from the SFR mass range employed by Munoz-Mateos et al. (2007) (0.1–100 ) to that used in Mas-Hesse, Oti-Floranes & Cervino (2008) (2–120 )..
The soft X-ray radial profile and the stellar-mass radial profile estimated from the K-band photometry can similarly be compared. Munoz-Mateos et al. (2007) use K-band data to evaluate the stellar-mass radial profile of M33. We find that the soft X-ray/stellar-mass ratio remains relatively constant at , across the inner disk of M33 (Fig. 4, third panel). Recent studies conducted by Revnivtsev et al. (2007) and Revnivtsev, Vikhlinin & Sazonov (2007) have explored the relationship between unresolved X-ray emission and the stellar-mass distributions for the Galactic ridge and M32, in an attempt to derive the X-ray emissivity per unit stellar mass in systems with low SFR. Most likely this emissivity originates in point sources associated with (intermediate) disk population objects such as active binaries and cataclysmic variables with LX between and , together with a contribution from fainter sources, the bulk of which will be coronally active stars. From these and other studies (e.g. NGC3379 and M31 - Revnivtsev et al. (2008); Bogdan & Gilfanov (2008)), an X-ray to stellar mass ratio for quiescent systems (which do not contain substantial hot gas) can be estimated to be (0.5-2 keV). This is a factor of 5-10 lower than we derive above for M33, implying that of the observed unresolved X-ray luminosity in M33 may be associated with the old stellar population. This level is consistent with that predicted from the extended XLF derived for LMXB, relatively quiescent LMXB, cataclysmic variables and other source types associated with the old population.
As a final investigation we also considered the variation in X-ray spectral hardness as deduced from images produced in two sub-bands, namely the 0.3–0.8 keV and 0.8–1.2 keV bands. The plot of spectral hardness versus radius shown in (Fig. 4, bottom panel) in essence tracks the relative contribution of the two thermal spectral components identified earlier in the spectral fitting (§4.2). There is a hint of spectral softening with increasing galactocentric radius, suggesting that the hotter thermal component makes a greater contribution to the total luminosity towards the centre of the galaxy.
6 Discussion
The strong correlation observed between soft X-ray and FUV emission in M33 confirms a direct linkage between star formation and the production of soft X-rays in this galaxy. According to current models (e.g. Cervino, Mas-Hesse & Kunth 2002: Mas-Hesse, Oti-Floranes & Cervino 2008), following a burst of star formation which gives rise to a massive star cluster, the FUV emission may be expected to peak on a timescale matching the lifetime of the most massive stars ( years), whereas the X-ray signal reaches a maximum sometime later. In this scenario, diffuse soft X-rays are produced through the heating of bubbles within the interstellar medium to temperatures of K as a result of the mechanical energy input from the winds of massive stars created in the starburst and the eventual destruction of such stars in supernovae. Individual SNR also contribute, primarily during the free-expansion and adiabatic phases of their evolution. Occasionally luminous high-mass X-ray binaries might be formed in such a cluster, although here we assume that such sources would be bright enough to be excluded as resolved point-sources. Mas-Hesse, Oti-Floranes & Cervino 2008 find that following the onset of the starburst the diffuse soft X-ray luminosity increases rapidly over the first few Myr. For an instanteous burst, the X-ray luminosity may then plateau and eventually decline whereas, if the starburst activity is ongoing then the X-ray luminosity may gradually rise for up to Myr until the stellar formation and destruction process reach an equilibrium. Using the models of Mas-Hesse, Oti-Floranes & Cervino (2008), we find that the X-ray/SFR ratio measured for the inner disk of M33 matches the predictions at Myr (after the onset of an extended burst of star formation activity), assuming the efficiency of conversion of mechanical energy from supernovae into X-rays is 1% (cf. OW09). Studies of the star formation history of M33 (Wilson et al. 1988; Wilson & Matthews 1995) have shown that several strongly emitting HII regions have undergone bursts of star formation on the timescale of 10 Myr, which indicates that this model is realistic.
Through a quantitative comparison of the observed soft X-ray surface brightness distribution with a synthetic image, we found that roughly of the X-ray signal had a spatial distribution similar to that seen in the FUV with the remaining better matching the K-band distribution. In effect this represents a 40:60 split between a clumpy spiral-arm distribution and a smooth disk distribution. However, in §6 we also discussed the fact that perhaps of the total observed soft X-ray emission might be directly associated with the old stellar population of the galaxy (for which the K-band light again serves as a tracer). If we subtract this fraction we are left with a roughly equal split between the two inferred spatial components of the soft X-ray emission.
We are now in a position to add some refinements to our earlier analysis in which we modelled the X-ray emitting gas as filling a cylindrical disk of half-thickness 0.5 pc, extending to a galactocentric radius of 3.5 kpc. As the spiral arm regions occupy at most of the inner galactic disk by area, we may model 40% of the emission (directly connected to the spiral arm regions) as filling 20% of the disk with a thickness of, say, 200 pc. With this adjustment, the cooling timescale of the gas is yr, where is the filling factor of the gas. On the basis of the dynamical analysis of M33 performed by Puerari (1993), narrow features initially distributed in a spiral arm pattern would be completely smeared out by differential galactic rotation on timescales of yr. For such narrow features to survive we need a much shorter cooling timescale (assuming radiative cooling is the dominant process) implying a filling factor much less than unity. Setting gives a cooling timescale of years, comparable to the inferred lifetime of hot bubbles observed in our own Galaxy (Egger & Aschenbach 1995; Breitschwerdt, de Avillez & Baumgartner 2009). As noted earlier, this is also roughly the timescale on which the soft X-ray production maximises following the onset of a starformation episode. Given the rotational period and pattern speed of the galaxy (Puerari 1993), this corresponds to a azimuthal offset at a galactocentric radius of 2 kpc, between the X-ray emission and the FUV emission (with the former leading the latter since at 2 kpc we are within the corotational radius). Such an offset would not be observable in M33 in XMM-Newton data and, in fact, such effects have yet to be identified even in the higher spatial resolution Chandra observations of other spiral galaxies (Tyler et al. 2004).
Even after allowing for the contribution of the old stellar population, we are left with a substantial fraction of the soft X-ray emission originating in a smoothly distributed component. Since M33 has an intermediate inclination, it is not possible to disentangle disk emission from a lower-halo component. However, Strickland et al. (2000), in a study of 9 nearby edge-on spiral starburst and normal galaxies, have managed to distinguish between unresolved disk and lower-halo components and find that the former dominates across their sample. In all but the systems with highest SFR, the luminosity of the halo emission is at least a factor of 3-4 lower than that observed in the disk. In the case of M33 it therefore seems reasonable to assume that the bulk of the smoothly-varying component is confined to the disk but located both in the spiral arms and inter-arm regions. A cooling timescale of yr for this component is consistent with its smooth distribution across the inner disk of M33.
7 Conclusions
We have used archival XMM-Newton observations to examine the residual X-ray emission observed from M33 after the exclusion of the bright point source population to a limit of LX. Using the same methodology as in OW09, we have investigated the spectral and spatial properties of the X-ray emission within an inner disk region extending up to 3.5 kpc from the nucleus of the galaxy.
The observed X-ray spectrum can be modelled as thermal emission with cool and hot components of keV and keV respectively, with the cooler emission providing the dominant contribution to the luminosity. There is some evidence for a subsolar metallicity consistent with other indicators of low-metallicity in M33.
The strong correlation established between X-ray and FUV morphologies confirms the close linkage between X-ray emission and recent star formation. Detailed comparison of soft X-ray and FUV radial profiles in the inner disk of M33 reveals the ratio of X-ray emission to SFR to be ( yr-1)-1 (in the 0.3-2 keV band). This matches the predictions of Mas-Hesse, Oti-Floranes & Cervino (2008) for an extended burst of star formation occurring 10 Myr ago, with an efficiency of mechanical energy conversion to X-rays of . The soft X-ray emission to mass ratio found for M33 is , a factor of 5 higher than the corresponding value for dwarf elliptical galaxies and spirals with low SFR. This implies that up to of the observed soft X-ray emission originates in the old stellar source population, in source types such as cataclysmic variables and active binaries.
With the contribution of the old stellar population subtracted, the soft X-ray emission is found to be equally split between two spatial components, one which closely traces the spiral arms of the galaxy and the other more smoothly distributed across the inner disk region. The constraints on the cooling timescale implied by the presence of spiral features in the soft X-ray images suggest the presence of a highly clumped component, encompassing sites of on-going starformation, HII regions and hot gas bubbles. The nature of the smoothly distributed component is much less certain. Plausibly it may represent the integrated emission from a whole range of processes and source types including supernovae occurring in the interarm regions, individual sources and source complexes with luminosity not far below the applied luminosity threshold and an accumulated distribution of hot gas which has managed to leak away from the site of its original production.
Acknowledgments
RAO acknowledges the receipt of a PPARC/STFC research studentship. We thank Tom Jarrett (IPAC) for providing us with 2MASS mosaic images and advice, and Jenny Carter for assisting us with detection of SWCX in our observations. We thank the referee, Steve Snowden, for comments and suggestions which have helped us to improve this paper.
References
- Breitschwerdt, de Avillez & Baumgartner (2009) Breitschwerdt D., de Avillez M. A., Baumgartner V., 2009, AIPC , 1156, 271
- Bogdan & Gilfanov (2008) Bogdan A., Gilfanov M., 2008, MNRAS , 388, 56
- Carter & Sembay (2008) Carter J. A., Sembay S., 2008, A&A , 489, 837
- Cervino, Mas-Hesse & Kunth (2002) Cervino M., Mas-Hesse J.M., Kunth, D., 2002, A&A , 392, 19
- Chevalier & Clegg (1985) Chevalier R. A., Clegg A. W., 1985, Nature, 317, 44
- Colbert et al. (2004) Colbert E. J. M., Heckman T. M., Ptak A. F., Strickland D. K., Weaver K. A., 2004, ApJ , 602, 231
- Corbelli & Salucci (2000) Corbelli E., Salucci P., 2000, MNRAS , 311, 441
- Corbelli & Walterbos (2007) Corbelli E., Walterbos R., 2007, ApJ , 669, 315
- Crockett et al. (2006) Crockett N. R., Garnett D. R., Massey P., Jacoby G., 2006, ApJ , 637, 741
- de Vaucouleurs et al. (1991) de Vaucouleurs G., de Vaucouleurs A., Corwin H. G., Buta R. J., Paturel G., Fouque P., 1991, Third Reference Catalogue of Bright Galaxies. Springer-Verlag, Berlin
- Dahlem et al (1998) Dahlem M., Weaver K.A., Heckman, T.M., 1998, ApJS , 118, 401
- Dubus & Rutledge (2002) Dubus G., Rutledge R. E., 2002, MNRAS , 336, 901
- Egger & Aschenbach (1995) Egger R. J., Aschenbach B., 1995, A&A , 294, L25
- Ehle et al. (1998) Ehle M., Pietsch W., Beck R., Klein U., 1998, A&A , 329, 39
- Fabbiano (1989) Fabbiano G., 1989, ARA&A , 27, 87
- Fabbiano (2006) Fabbiano G., 2006, ARA&A , 44, 323
- Foschini et al. (2004) Foschini L., Rodriguez J., Fuchs Y., Ho L. C., Dadina M., Di Cocco G., Courvoisier T. J.-L., Malaguti G., 2004, A&A , 416, 529
- Fraternali et al. (2002) Fraternali, F., Cappi M., Sancisi R., Osterloo T., 2002, ApJ , 578, 109
- Gil de Paz et al. (2007) Gil de Paz A., Boissier S., Madore B. F., Seibert M., Joe Y. H., Boselli A., Wyder T. K., Thilker D. et al., 2007, ApJS , 173, 185
- Grimm et al. (2005) Grimm H.-J., McDowell J., Zezas A., Kim D.-W., Fabbiano G., 2005, ApJS , 161, 271
- Grimm et al. (2005) Grimm H.-J., McDowell J., Zezas A., Kim D.-W., Fabbiano G., 2007, ApJS , 173, 70
- Haberl & Pietsch (2001) Haberl F., Pietsch W., 2001, A&A , 373, 438
- Hippelein et al. (2003) Hippelein H., Haas M., Tuffs R. J., Lemke D., Stickel M., Klaas U., Völk H. J., 2003, A&A , 407, 137
- Kalberla et al. (2005) Kalberla P. M. W., Burton W. B., Hartmann, D., Arnal E. M., Bajaja E., Morras R., Pöppel W. G. L., 2005, A&A , 440, 775
- Kilgard et al. (2005) Kilgard R. E., Cowan J. J., Garcia M. R., Kaaret P., Krauss M. I., McDowell J. C., Prestwich A. H., Primini F. A., et al., 2005, ApJS , 159, 214
- Kuntz et al. (2003) Kuntz K.D., Snowden S.L., Pence W.D., Mukai K., 2003, ApJ , 588, 264
- Kennicutt (1989) Kennicutt Jr. R. C., 1989, ApJ , 344, 685
- Long et al. (1981) Long K. S., Dodorico S., Charles P. A., Dopita M. A., 1981, ApJ , 246, L61
- Long et al. (1996) Long K. S., Charles P. A., Blair W. P., Gordon S. M., 1996, ApJ , 466, 750
- Markert & Rallis (1983) Markert T. H., Rallis A. D., 1983, ApJ , 275, 571
- Mas-Hesse, Oti-Floranes & Cervino (2008) Mas-Hesse J. M., Oti-Floranes H., Cervino M., 2008, A&A , 483, 71
- Misanovic et al. (2006) Misanovic Z., Pietsch W., Haberl F., Ehle M., Hatzidimitriou D., Trinchieri G., 2006, A&A , 448, 1247
- Munoz-Mateos et al. (2007) Munoz-Mateos J.C., Gil de Paz A., Boissier, S., Zamorano, J. Jarrett T., Gallego J., Madore B.F., 2007, ApJ , 658, 1006
- Owen & Warwick (2009) Owen R. A., Warwick R. S., 2009, MNRAS , 394, 1741
- Pietsch et al. (2004) Pietsch W., Misanovic Z., Haberl F., Hatzidimitriou D., Ehle M., Trinchieri G., 2004, A&A , 426, 11
- Plucinsky et al. (2008) Plucinsky P. P., Williams B., Long K. S., Gaetz T. J., Sasaki M., Pietsch W., Tüllman R., Smith R. K. et al., 2008, ApJS , 174, 366
- Puerari (1993) Puerari I., 1993, PASP , 105, 693
- Revnivtsev, Vikhlinin & Sazonov (2007) Revnivtsev M., Vikhlinin A., Sazonov S., 2007, A&A , 473, 857
- Ranalli, Comastri & Setti (2003) Ranalli P., Comastri A., Setti G., 2003, A&A , 419, 849
- Read et al. (1997) Read A. M., Ponman T. J., Strickland D. K., 1997, MNRAS , 286, 626
- Regan & Vogel (1994) Regan M. W., Vogel S. N., 1994, ApJ , 434, 536
- Revnivtsev et al. (2007) Revnivtsev M., Churazov E., Sazonov S., Forman W., Jones C., 2007, A&A , 473, 783
- Revnivtsev et al. (2008) Revnivtsev M., Churazov E., Sazonov S., Forman W., Jones C., 2008, A&A , 490, 37
- Sazonov et al. (2006) Sazonov S., Revnivtsev M., Gilfanov M., Churazov E., Sunyaev R., 2006, A&A , 450, 117
- Schulman & Bregman (1995) Schulman E., Bregman J. N., 1995, ApJ , 441, 568
- Skrutskie et al. (2006) Skrutskie M. F., Cutri R. M., Stiening R., Weinberg M. D., Schneider S., Carpenter J. M., Beichman C., Capps R., 2006, AJ , 131, 1163
- Soria & Wu (2003) Soria R., Wu K., 2003, A&A , 410, 53
- Strickland & Stevens (1998) Strickland D. K., Stevens I. R., 1998, MNRAS , 297, 747
- Strickland et al. (2000) Strickland D. K., Heckman T. M., Weaver K. A., Dahlem M., 2000, ApJ , 120, 2965
- Strickland et al. (2004a) Strickland D. K., Heckman T. M., Colbert E. J. M., Hoopes C. G., Weaver K. A., 2004a, ApJS , 151, 193
- Tabatabaei et al. (2007) Tabatabaei F. S., Beck R., Krause M., Berkhuijsen E. M., Gehrz R., Gordon K. D., Hinz J. L., Hunphreys R. et al., 2007, A&A , 466, 509
- Trinchieri, Fabbiano & Peres (1988) Trinchieri G., Fabbiano G., Peres G., 1988, ApJ , 325, 531
- Tüllman et al. (2008) Tüllman R., Gaetz T. J., Plucinsky P. P., Long K. S., Hughes J. P., Blair W. P., Winkler P. F., Pannuti T. G. et al., 2008, ApJ , 685, 919
- Tyler et al. (2004) Tyler K., Quillen A. C., LaPage A., Rieke G. H., 2004, ApJ , 610, 213
- van den Burgh (1991) van den Burgh S., 1991, PASP, 103, 609
- Warwick et al. (2007) Warwick R. S., Jenkins L. P., Read A. M., Roberts T. P., Owen R. A., 2007, MNRAS , 376, 1611
- Williams et al. (2008) Williams B. F., Gaetz T. J., Haberl F., Pietsch W., Shporer A., Ghavamian P., Plucinsky P. P., Mazeh T. et al., 2008, ApJ , 680, 1120
- Wilson et al. (1988) Wilson C. D., Scoville N., Freedman W. L., Madore B. F., Sanders D. B., 1988, ApJ , 333, 611
- Wilson & Matthews (1995) Wilson C. D., Matthews B. C., 1995, ApJ , 455, 125
- Zaritsky, Elston & Hill (1989) Zaritsky D., Elston R., Hill J. M., 1989, AJ , 97, 97