Measurement of Cosmic Ray elemental composition from the CAKE balloon experiment
Abstract
CAKE (Cosmic Abundances below Knee Energies) was a prototype balloon experiment for the determination of the charge spectra and of abundances of the primary cosmic rays with nuclear charge Z10. It was a passive instrument made of layers of CR39® and Lexan®/Makrofol® nuclear track detectors; it had a geometric acceptance of 0.7 m2sr for Fe nuclei. Here, the scanning and analysis strategies, the algorithms used for the off-line filtering and for the tracking in automated mode of the primary cosmic rays are presented, together with the resulting CR charge distribution and their abundances.
keywords:
Cosmic rays abundances, nuclear track detectors, automatic scanning and tracking.1 Introduction
The determination of the elemental abundances of cosmic rays (CRs) observed in the solar system provides valuable information on the nature of their sources, acceleration mechanisms and propagation in the Interstellar Medium (ISM). While there is a general consensus for supernova shocks being the main acceleration sites of CR particles with energy per nucleon up to eV, still unresolved is the question of which are their sources.
From measurements of the abundances made near the Earth it is possible, by modelling the propagation processes in the ISM, to infer the elemental abundances at CR sources as well as to place constraints on the nature of their original environments. The present data cannot select one model between coronal material of later-type stars (which are rich of ions in a gas-phase) and Interstellar Medium in the proximity of Supernovae Remnants. Two proposed CR selection mechanisms based on the elemental First Ionization Potential (FIP) and on the volatility/refractory state, i.e. on the condensation temperature , could justify the first scenario with respect to the second. The measured CR abundances show a strong prevalence of the refractory elements (which are generally characterized by low FIP and large , e.g. Mg (), Ca (), Fe () [1]) with respect to the volatile ones (characterized by high FIP and small , e.g. H (), He (), O ()). The apparent anti-correlation between FIP and prevents to choose between the two mechanisms. Such degeneracy could be solved by measuring the abundances of the few volatile low-FIP elements and the rare refractory with high-FIP ones [2]; e.g. Ga (), Ge (), Rb (), Pb (), Bi () [1].
A number of signatures exists in the abundance spectrum of heavy nuclei () [1]; in order to reach confident conclusions it is necessary to achieve high-resolution charge measurements and high statistics. Elements with are rare and large exposure factors (collecting area exposure time angular acceptance) are required. For example the abundances of nuclei is 100010000 times smaller than Fe nuclei, whose flux is 1 cm-2sr-1day-1.
Since many years high altitude balloon flights provided an alternative to more expensive (even in terms of realization time) satellite based experiments. Flight durations have been growing from few days to several weeks on recent Long Duration Balloons (LDB) flown from Antartic regions e.g. [3], and plans are underway to provide missions up to months (Ultra LDB).
Plastic passive detectors are promising since they can provide good charge resolution, and are certainly suitable for balloon flights, as they can be used in large collecting areas and limited weight. The main limitation is that the detector has to be recovered after the flight for the analysis with microscopes. Such type of technique was already used succesfully in several experiments on balloons [4-6] and in space [7-10]
Nuclear Track Detectors (NTDs) like CR39® can detect charged particles with with very good charge resolution [11], whereas Lexan®/Makrofol® polycarbonates have higher thresholds, [12]. Due to the large flux of low charged particles the analysis of CR39® detectors and the determination of the relative abundances can be time consuming. Thus the necessity to develop an automatic system for reading and measuring the track characteristics.
The purpose of the CAKE balloon experiment from the ASI (Agenzia Spaziale Italiana) was to test the implementation of new scanning and analysis techniques for future LDB flights of large area detectors (tens of m2sr) [13]. We report here about the scanning procedures and algorithms developed to analyse the CR39® sheets exposed during a trans-mediterranean flight. The obtained primary charge spectrum at the top of the atmosphere is presented.
2 The detector
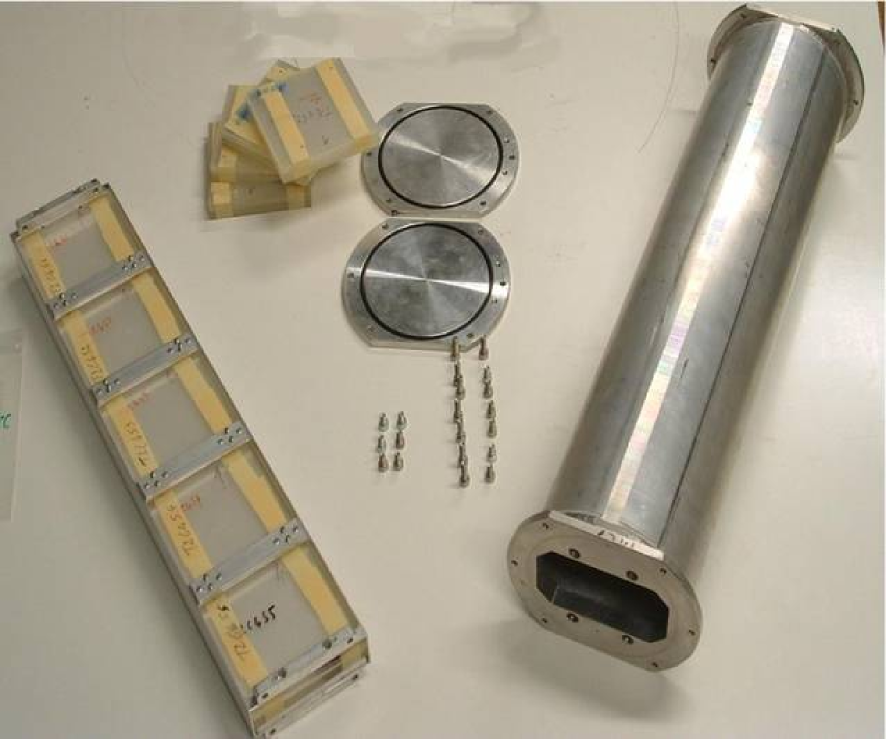
CAKE was composed of 80 multilayer stacks of CR39® and Lexan® sheets. Each ”standard” stack was of dimension 11.511.5 cm2, with 10 sheets of Lexan®, 0.25 mm thick, sandwiched between 20 layers of CR39®, 0.7 or 1.4 mm thick. Ten stacks were also assembled with Al or Pb foils to study the fragmentation of the impinging particles. Each Al or Pb foil was 0.5 mm thick. The thickness of a standard stack was 2.3 g/cm2 while it was 3.0 and 4.8 g/cm2 for a stack with Al and Pb targets, respectively. Five stacks were inserted into an aluminium cylinder, as shown in Fig. 1, and four cylinders were loadged into aluminium “boxes” with an internal insulation foam coverage. The entire experimental set-up composed of four “boxes” was lodged on the payload of a stratospheric balloon. The cylinders and the boxes were designed to preserve the sheets in an air environment at normal preassure during the flight. The full exposed area was 1 m2.
3 The test flight
The balloon was launched from the Trapani-Milo base (12.5∘E 32.92∘N) of ASI and landed in central Spain after 22 hours of flight. The plafond altitude was 3740 km (33.5 g cm-2) and was kept for about 17.8 hours. Along the balloon trajectory the mean vertical rigidity cut-off was 7 GV (limiting the minimum energy of the impinging CRs to E2.6 GeV/nucleon) [14]. The gondola was not azimuthally controlled and thus no East-West effect could be searched for.
During the balloon flight the cylinders had an internal preassure of 1 Atm, and the inside temperature never exceeded . Studies performed in a controlled heating room, determined that CR39® keeps its sensitivity unchanged from up to [15].
4 Data Analysis
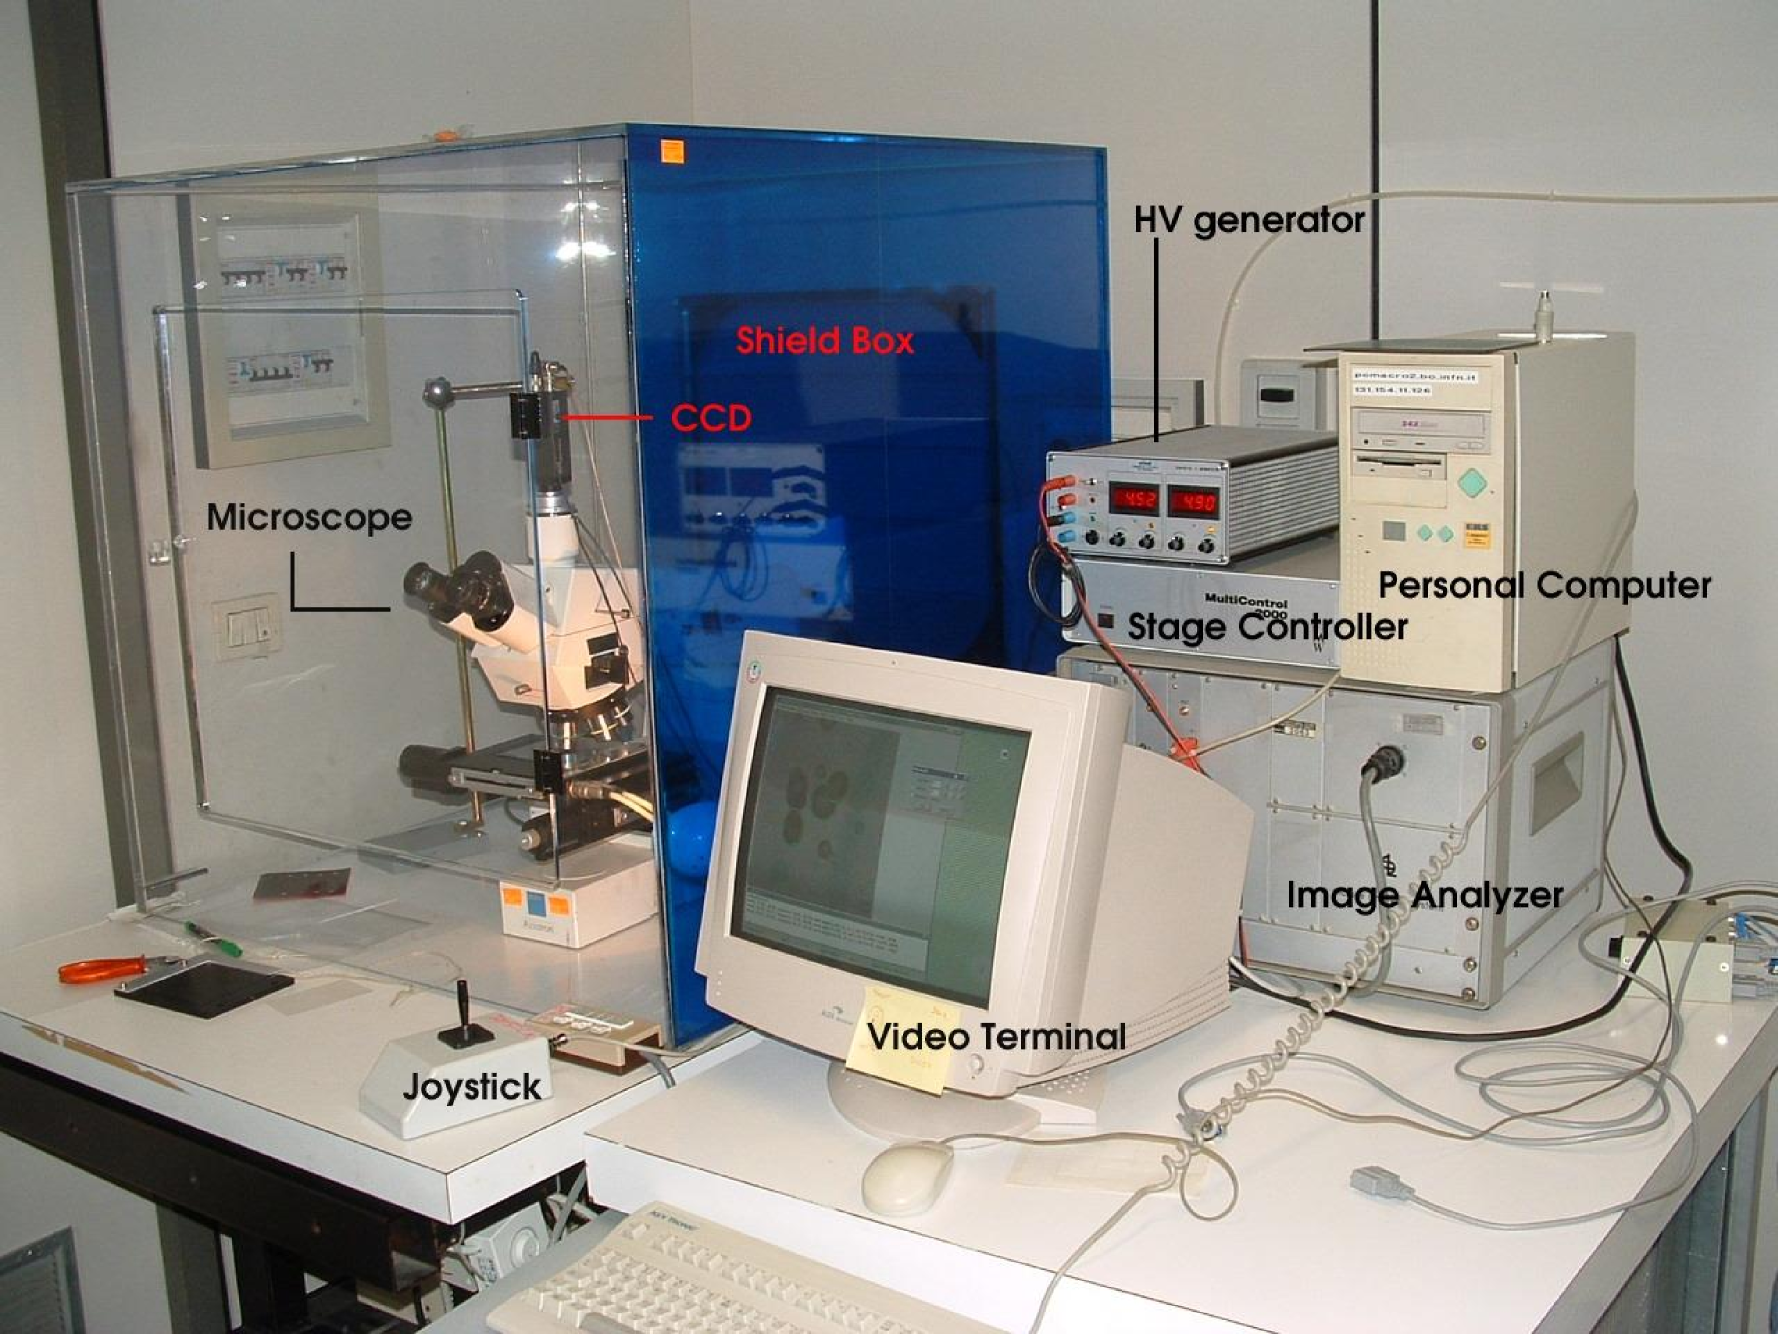
After the flight CR39® sheets of standard stacks were etched in a 6N NaOH solution at (700.1)∘C for 30 hours; the total number of detector foils that were chemically etched was 280. The detectors were measured by an automated SAMAICA (Scanning and Measuring with Automatic Image Contour Analysis) image analyzer, i.e. an integrated DAQ system composed of an optical microscope controlled by a personal computer, a built in frame grabber, and a positioning stage [16]; the image analyzer was a product of ELBEK-Bildanalyse GmbH; see Fig. 2.
Chemical etching of NTDs results in the formation of conical pits (etch-pits) on both sides of a detector foil. The surface base of the etch-pits has an elliptical shape.
For each exposed stack four CR39® detector plates were measured in automatic mode. For each etch-pit (“track”) on the upper surface of a CR39® plate the system provides the measurement of the major and minor axis, polar angle, area of the base of each cone, plus its position on the foil. The scanned area of each foil was reduced to 88 cm2 to avoid edge effects; a single detector sheet was measured in 12 hours.
By determining the CR39® bulk etching rate [17] it was possible to compute the reduced etching rate , where is the etching velocity along the particle trajectory. Exposures of CR39® stacks to relativistic heavy ion beams at accelerators [18] allowed a correlation of the measured with the charge number of the impinging ions [19]. We had at our disposal three CR39® calibrations for three different values, namely 1.1, 1.15, and 1.21 [20]. The interval was used for accepting the bulk velocity of the etched foils. 236 out of 280 detectors were selected and analyzed. The parameters for the automatic measurement of the detectors were set to obtain a minimum bias in the track measurement; the residual noise was treated off line with the implementation of an appropiated filter. The scan efficiency was 90% for the detection of tracks from nuclei with charges 9 [15]. A filter was implemented in order to classify the measured tracks using a multilayer perceptron neural network [21] trained on a data sample of 3000 cosmic ray tracks measured manually. The filter selection is based on two features of the measured tracks: the track ellipticity (defined as the ratio of the minor to major semi axes of the base etch-pit) and its central brightness (a quantity measured in arbitrary units by the optical system). The filtered data set are 60% of the raw data set [22].
Semi-automatic scans were made by operators to check the goodness of the automatic measurements and the filter; for each track it was verified if it was passing through both sides of the detector foil. The automatic scan is 10 times faster than the semi-automatic scan.
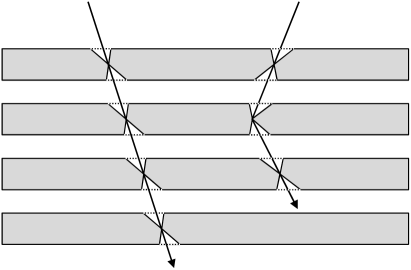
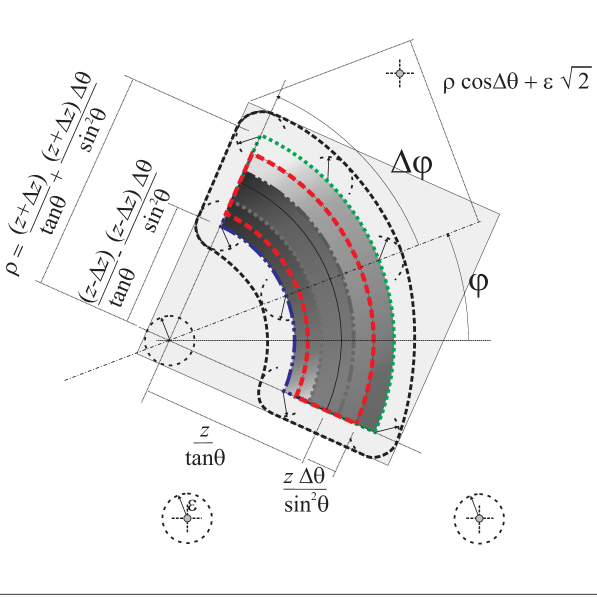
The trajectory of each candidate ion was followed through 3 CR39® sheets; Fig. 3 shows different tracks crossing several foils of the same stack. Using tracking algorithms only tracks crossing the plates in linear trajectory were selected (cosmic ray particles with energies GeV/nucleon are highly penetrating and scattering is negligible). A cosmic ray “event” was defined as a track passing through at least three consecutive detector plates as shown by the trajectory on the left in Fig. 3. Each candidate event was tracked individually by means of the fiducial area recursive method [23]. Starting with a “track” on the uppermost foil of the stack the method defines a limited area on the following foils where corresponding tracks are searched for. This procedure is applied recursively up to 3 etched foils on the stack. The fiducial area sketched in Fig. 4 was determined considering the experimental uncertainties of the track inclination (in Fig. 4 is the complementary of the zenith angle) and its orientation ( is the azimuth angle) with respect to the foil uppermost surface. All the uncertainties of the measured variables are considered. i.e. the etch-pit base area (10 m2), the foil thickness (at most 50 m) and the mis-alignment among the foils in the stack. The size of the fiducial area was 1 . Details about the tracking and selection procedures are given in ref. [15, 22].
5 Results
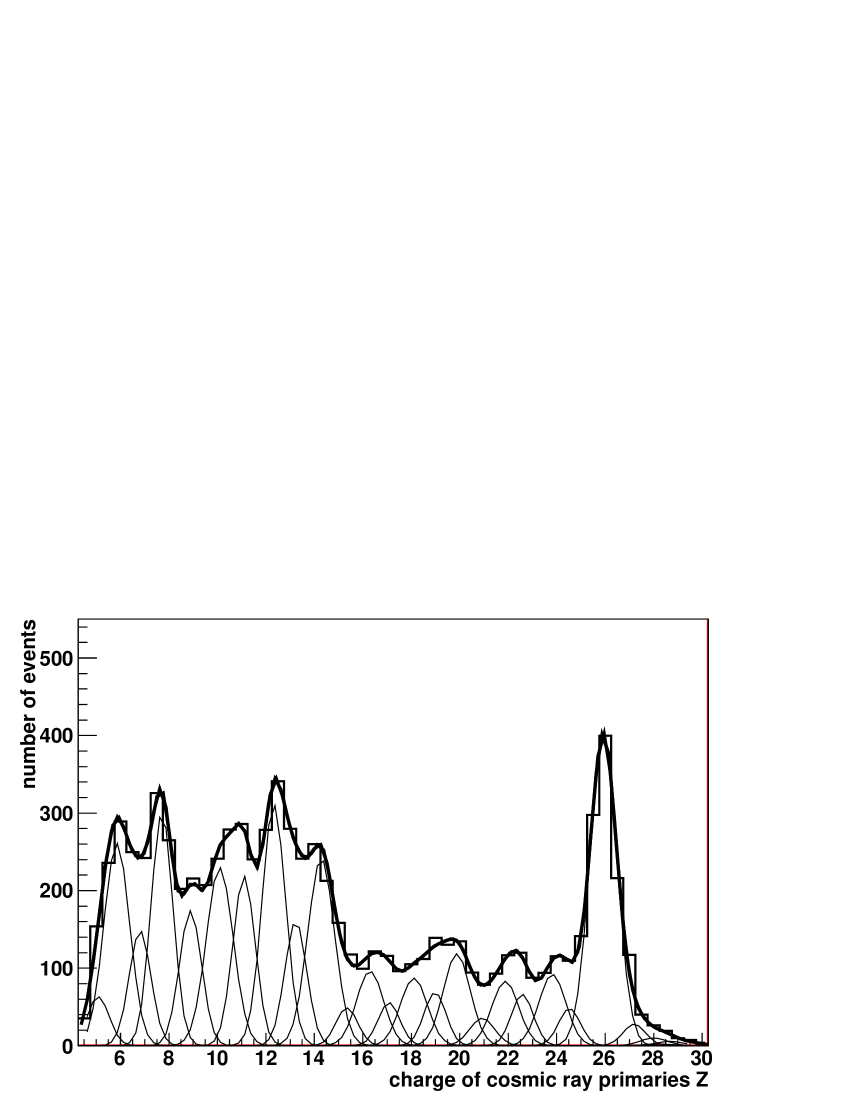
In Fig. 5 is shown the unfolded charge distribution of the CR events detected in CR39®. The range of the reconstructed charge number Z is . In the same figure are shown the Gaussian distributions of each element (represented with thin black curves) which all added together fits the experimental histogram (represented with the thick black curve). The Gaussian parameters (height and width) were computed by means of a global fit of the sum of 25 Gaussians to the experimental distribution. The fit was computed using the least squares minimization package [24]. The standard deviations of the fitted curves were in the range 0.4 0.6 Z. By integrating over each individual Gaussian distribution we obtained the distribution of observed events at the detector level shown in Fig. 6.
5.1 Fragmentation processes
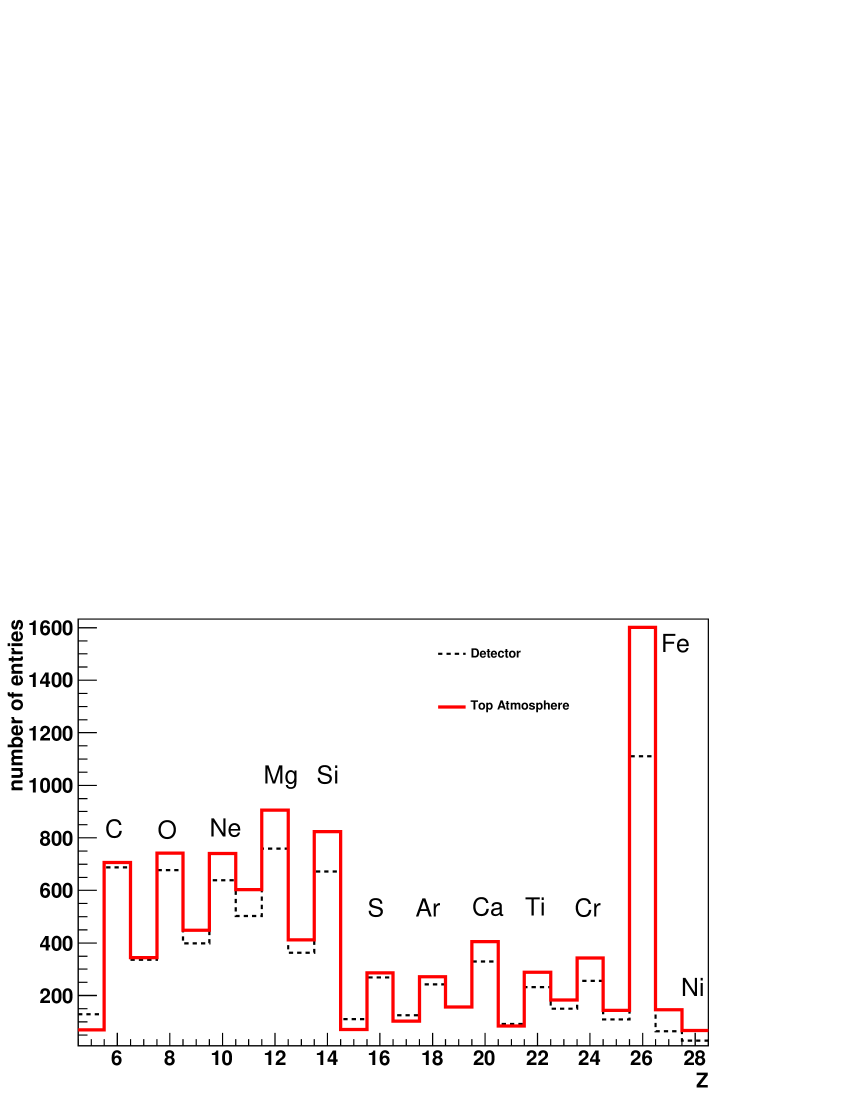
In order to compute the CR charge distribution at the top of the atmosphere, fragmentation processes have to be considered [25]. Fragmentation of cosmic ray nuclei may occur in the interactions with the residual atmosphere; the mean atmospheric thickness at the CAKE trajectory was 3.25 . Fragmentation also occurs in the interaction with the aluminium containers housing the detector stacks, shown in Fig. 1; the mean Al thickness was 2.7 . Fragmentation on air and on Al were modelled with Monte Carlo simulations using Geant4 [26]. The model takes into account the interactions of CR nuclei with the residual atmosphere and the detector shields. Primary CR energies were sampled assuming the energy dependence of the flux [27] in the range . With the simulations the fragmentation coefficients of heavy elements into lighter species were obtained, calculated as in ref. [28] and [29]; then with the fragmentation matrix the charge distribution at the top of the atmosphere was obtained. In Fig. 6 the black histogram shows the charge distribution at the detector level; the solid red histogram is the charge distribution at the top of the atmosphere.
5.2 Angular Acceptance
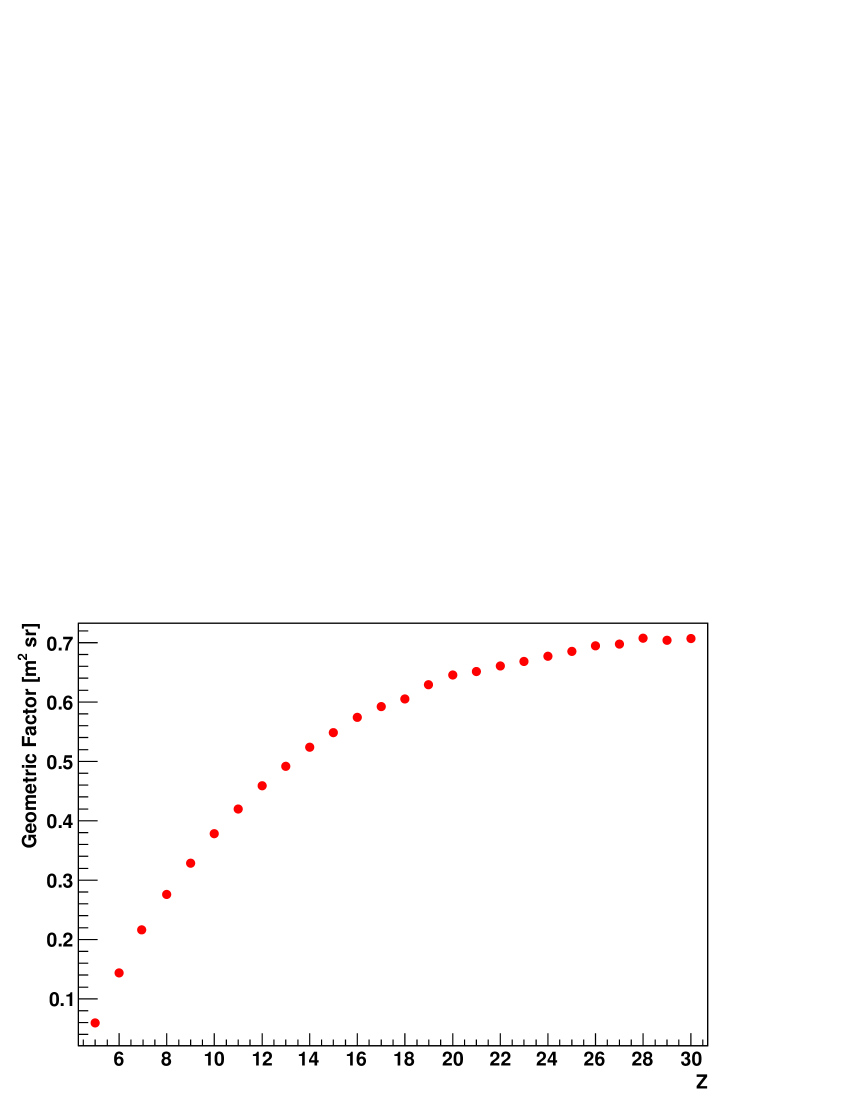
The geometrical acceptance of the C39 detectors varies with the charge Z [19] as there is a limiting angle for the formation and observation of a track in the detectors
| (1) |
By including the exponential attenuation of CRs (i.e. by considering the residual atmosphere, the Al containers of the detectors and the insulating foam which filled the vessels) the geometrical factor of the detector varies as shown in Fig. 7.
5.3 Relative Abundances at the top of the Atmosphere
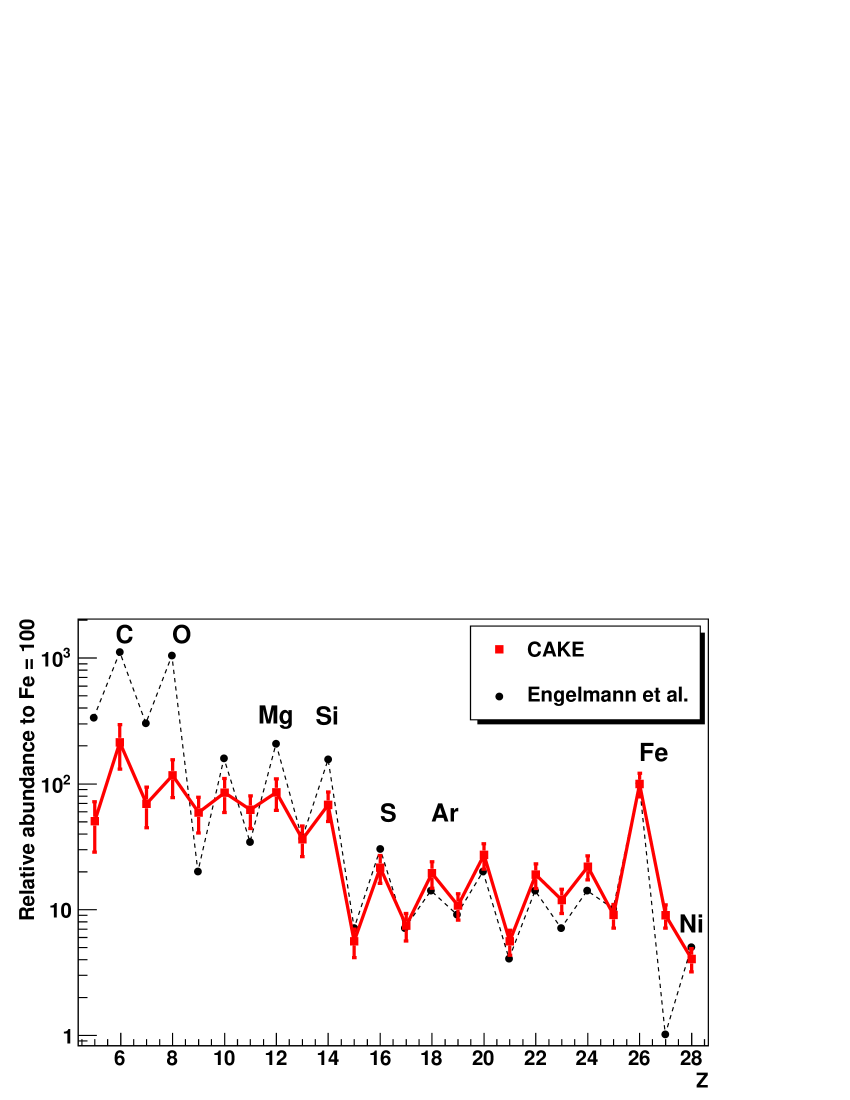
The abundances of nuclei at the top of the atmosphere, were evaluated considering the angular acceptance and correcting for the flux attenuation in air and in the detector boxes. The resulting values are shown in Fig. 8 together with the measurement reported in ref. [30] at a similar energy threshold (2.6 GeV/nucleon). The agreement is satisfactory for . For there is a disagreement due to the filter and algorithm rejecting small tracks affecting mainly low charged particles. The differences at the left of the Fe peak are probably due to a partially unsatisfactory correction for fragmentation. At the right of the Fe peak the number of events is too small to even consider a significant result.
In Fig. 8 error bars in CAKE’s data represent systematic plus statistical standard deviations added in quadrature; the error around the Iron relative abundance is 20%.
6 Conclusions
This paper was focused on the development of automatic analysis procedures for determining the chemical composition of cosmic ray nuclei using nuclear track detectors. The NTD technique offers good charge resolution and is attractive for the exploration/determination of the charge spectrum of cosmic particles at reasonable cost. The explotation of this technique in large area experiments relies on automatic image analyzers for scanning and measuring the detector foils as well as on the availability of LDB and ULDB flights.
By making use of a short stratospheric balloon flight we had the opportunity to study and develop several tools to obtain a charge spectrum of cosmic ray particles with at the top of the atmosphere. Our measurement is in fair agreement with other observations.
Acknowledgements
We acknowledge the support of the Trapani-Milo Stratospheric Balloon Launch Base of ASI, and the cooperation of the technical staff at the INFN Section of Bologna. The experiment was funded by ASI. One of the authors thanks INFN for a post-doc fellowship for foreigners.
References
- [1] Waddington C.J., Proc. 27th ICRC (Hamburg, 2001) Vol. 5, 1784.
- [2] Meyer et al., Astrophys. J. 487, 182 (1997).
- [3] B. F. Rauch et al., Proc. 30th ICRC (Merida, 2007), Vol. 2, 7.
- [4] Bhattacharyya D.P. et al., Il Nuovo Cim. 18C 161 (1995).
- [5] Saito T. et al., Phys. Rev. Lett., 65, 2094 (1990).
- [6] Price P.B. et al., Phys. Rev. D18 1382 (1978).
- [7] O’Sullivan D. et al., Radiat. Meas. 34, 273 (2001).
- [8] Gunther W. et al., Radiat. Meas. 35, 515 (2002).
- [9] Adams J.H. et al., Adv. Space Res. 15, 57 (1995).
- [10] Baravok D.G. et al., Radiat. Meas. 35, 423 (2002).
- [11] S. Cecchini et al., Nucl. Tracks Radiat. Meas. 22, 555 (1993); S. Cecchini et al., Proc. 29th ICRC (Pune, 2005) Vol. 3, 5; astro-ph/0510717 (2005).
- [12] S. Manzoor et al., Radiat. Meas. 40, 433 (2005).
- [13] Cecchini S. et al., Proc. of the 16th PAC-European Rocket & Balloon Programmes & Related Reasearch, ESA SP-454, 529 (2003).
- [14] D.F. Smart and M.A. Shea, Proc. 27th ICRC (Hamburg, 2001) Vol. 10, 4063 ©Copernicus Gesellchaft (2001).
-
[15]
T. Chiarusi, Measurement of the primary cosmic ray
composition with the CAKE experiment, Ph.D thesis, University of
Bologna (2003)
http://www.bo.infn.it/slim/thesis/PhDChiarusi.ps.gz - [16] SAMAICA V2.2X, Elbek-Bildanalyse GmbH, Siegen, Germany.
-
[17]
S. Balestra et al., Nucl. Instrum. Meth. B254, 254 (2007).
S. Cecchini et al., Radiat. Meas. 40, 433 (2005); S. Cecchini et al., Radiat. Meas. 34, 55 (2001). -
[18]
G. Giacomelli et al., Radiat. Meas. 28, 217 (1997).
G. Giacomelli et al., Nucl. Instrum. Meth. A 411, 41 (1998).
G. Giacomelli, Nucl. Phys. A662, 207 (2000). - [19] S. A. Durrani, R.K. Bull, Solid State Nuclear Track Detection. Principles, Methods and Applications, Pergamon Press (1987).
- [20] T. Chiarusi et al., Radiat. Meas. 36, 335 (2003).
- [21] J.P. Aubin, Neural Networks and Qualitative Physics, Cambridge Univ. Press. (1996).
-
[22]
E. Medinaceli, Astroparticle Physics with Nuclear Track
Detectors, Ph.D. Thesis, University of Bologna
(2008)
www.bo.infn.it/slim/thesis/EMedinaceliPhDThesis.eps - [23] T. Chiarusi et al., Radiat. Meas. 40, 424 (2005).
- [24] http://wwwasdoc.web.cern.ch/wwwasdoc/minuit/minmain.html
-
[25]
S. Cecchini et al., Astropart. Phys. 1, 369 (1993).
S. Cecchini et al., Nucl. Phys. A707, 513 (2002). -
[26]
S. Agostinelli et al., Nucl. Instr. and Meth.
A 506, 250 (2003).
J. Allison et al., IEEE Trans. on Nucl. Sci. 53, 270 (2006). - [27] B. Wiebel-Sooth, Astron. Astrophys. 330, 389 (1998).
- [28] C. Orth et al., Astrophys. Journal, 226, 1147 (1978).
- [29] M. Ichimura et al., Phys. Rev. D48, 1949 (1993).
- [30] J.J. Engelmann et al., Astron. Astrophys. 233, 96 (1990).