A multi-purpose modular system for high-resolution microscopy at high hydrostatic pressure
Abstract
We have developed a modular system for high-resolution microscopy at high hydrostatic pressure. The system consists of a pressurised cell of volume 100 l, a temperature controlled holder, a ram and a piston. We have made each of these components in several versions which can be interchanged to allow a wide range of applications. Here, we report two pressure cells with pressure ranges 0.1-700MPa and 0.1-100MPa, which can be combined with hollow or solid rams and pistons. Our system is designed to work with fluorescent samples (using a confocal or epifluorescence microscope), but also allows for transmitted light microscopy via the hollow ram and piston. The system allows precise control of pressure and temperature [-20-70∘C], as well as rapid pressure quenching. We demonstrate its performance and versatility with two applications: time-resolved imaging of colloidal phase transitions caused by pressure changes between 0.1MPa and 101MPa, and imaging the growth of Escherichia coli bacteria at 50MPa. We also show that the isotropic-nematic phase transition of pentyl-cyanobiphenyl (5CB) liquid crystal provides a simple, convenient and accurate method for calibrating pressure in the range 0.1-200MPa.
I Introduction
Hydrostatic pressure is important in many research fields. The structural, physical and chemical properties of matter under pressure are of interest to physicists, chemists and materials scientists McMahon and Nelmes (2006); Pae and Bhateja (1975); Deguchi and Tsujii (2007). Hydrostatic pressure is also an important tool in elucidating the mechanisms underlying the assembly of protein and other macromolecular structures Smeller (2002); Macgregor (2002); Winter (2001); Heremans (1982), while pressure effects on cartilage and bone cells are physiologically and medically important Urban (1994). From a technological point of view, moderate hydrostatic pressures ( 200MPa) have potential applications in protein manufacturing Seefeldt et al. (2009), while treatment with higher hydrostatic pressures ( 600MPa) can be used to kill microorganisms in food sterilization San Martin et al. (2002) or surgical applications Diehl et al. (2008). Finally, deep sea environments, which constitute a large part of the global biosphere, are exposed to hydrostatic pressures up to 101MPa. Understanding how biological organisms adapt to such pressures is of both fundamental scientific and biotechnological interest Bartlett (2008); Gross and Jaenicker (2006); Abe (2007); Abe et al. (1999).
In all of these contexts, optical microscopy is a powerful tool. Since depressurization before imaging constitutes a large and uncontrolled perturbation, it is a great advantage to be able to image a pressurized sample in situ at elevated pressure. However, microscope pressure cells are expensive and time-consuming to construct, and are often designed for a single application, making it difficult to use a particular system for multiple applications. In this paper, we report the development of a multipurpose microscope pressure-cell system, in which different modules can be interchanged to allow for different requirements in terms of microscopy technique, solvent tolerance, optical resolution and pressure range. The system can be used with a conventional epifluorescence, transmission or confocal microscope, has a large sample volume of 100l, is temperature controlled and is capable of rapid and well-controlled pressure ramping or quenching. Our focus is on biological and soft-matter physics applications in the pressure range MPa.
A microscope pressure cell suitable for biological and soft-matter applications must have a large sample volume ( 100l), in order to be able to observe “bulk-like” material or cellular behaviour. The pressure cell must also be compact and light enough to fit on a standard microscope stage. The cell must have optical windows which can sustain pressure. However, good optical resolution requires the working distance between the objective lens and the sample to be as small as possible. The window should therefore be as thin as possible and the window aperture as wide as possible to allow close approach of the objective to the window. One would also like to achieve well-controlled and rapid pressure quenching and temperature control. A number of pressure cells have been reported for imaging at moderate hydrostatic pressure; the properties of a representative sample of these are summarized in Table 1. At higher pressures (several GPa), diamond anvil cells Jayamaran (1983) are widely used; their small sample volume and thick diamond windows make them generally unsuitable for high resolution imaging of biological and soft matter samples under moderate pressures, although modified diamond anvil cells for imaging biological samples of small volume have been developed Oger et al. (2006).
| Ref. | Application | Sample | Max | Optical properties | Pressurization | Special features |
|---|---|---|---|---|---|---|
| volume | Pressure | |||||
| Oger et al. (2006) | Microbiology | 0.1l | 1.4GPa | Diamond window | Gas-filled ram | Diamond anvil cell |
| 250-600m thick, 4mm diam. | Temp range to 300∘C | |||||
| 20 objective | ||||||
| Perrier-Cornet et al. (1995) | Microbiology | 25l | 700MPa | Sapphire window | Hand pump | |
| 5mm thick, 10mm diam. | ||||||
| 20 objective | ||||||
| Reck et al. (1998) | Polymer physics | 300l | 300MPa | sapphire or diamond window | Hand pump | Polarization microscopy |
| 2mm thick, 5mm diam, WD 12mm | Temp range -40-270∘C | |||||
| 10 objective | ||||||
| Maeda and Koizumi (1996) | Liquid crystals | 300MPa | Sapphire window | Hand pump | Temp range 20-250∘C | |
| Polymer physics | 5mm diam., WD 3.5mm | |||||
| 20 objective | ||||||
| Hartmann et al. (2004, 2003); Frey et al. (2006) | Cell Biology | 3.5l | 300MPa | Sapphire window | Gasket | Fluorescence and transmitted |
| 2.3mm thick, WD 1.5mm. | ||||||
| 20 or 40 objective | ||||||
| Nishiyama et al. (2009) | Biophysics | 200 l | 200MPa | Optical glass window | Hand pump | |
| 1.5mm diam., WD 6mm | ||||||
| 40 objective | ||||||
| Koyama et al. (2001) | Cell biology | 100l | 100MPa | Pyrex glass window, | HPLC pump | Continuous flow |
| 2mm thick, 2mm diam., WD 3.8mm | Temp range 2-80∘C | |||||
| 20 or 40 objective | ||||||
| Salmon and Ellis (1975) | Cell Biology | 75l | 80MPa | Strain-free glass | Hand pump | Polarization microscopy |
| 1.75mm thick, 3mm diam., WD 2.3mm | ||||||
| 40X objective | ||||||
| Raber et al. (2006) | Biological cells | 1l | 100MPa | Image through wall of glass capillary | Hand pump | Fluorescence microscopy |
| 0.34 or 0.5mm thickness | Glass capillary tube | |||||
| 10X objective | ||||||
| Deguchi and Tsujii (2002); Mukai et al. (2006) | Colloid physics | 190l | 40MPa | Diamond window | HPLC pump | Continuous flow |
| 1mm thick, 2.8mm diam, NA 0.25 | Temp range 20-450∘C | |||||
| 10 objective | ||||||
| Besch and Hogan (1996) | Cell Biology | 100l | 15MPa | Glass coverslip | HPLC | Continuous flow |
| 0.15mm thick, 1mm diam. | Fluorescence and transmitted | |||||
| 40 objective | Electrical stimulation of cells | |||||
| Mizuno (2005) | Cell Biology | 9ml | 10MPa | Sapphire window | HPLC flow cell | |
| 2mm thick, 30mm diam. | ||||||
| 40 objective | ||||||
| Pagliaro et al. (1995) | Cell Biology | 1ml | 7MPa | Glass coverslip | HPLC pump | Fluorescence and transmitted |
| 0.2mm thick, 1mm diam. | ||||||
| 40, 1.3NA objective (fluorescence) |
Although the cells listed in Table 1 represent a wide range of capabilities, each is designed for a specific application. Our aim was to develop a modular and multipurpose system, allowing for high-resolution high-pressure microscopy over a range of pressures up to 700MPa, suitable for users in a variety of research fields. Given the expense and technical difficulty associated with the construction of a pressure cell, such a multi-purpose system should significantly facilitate high-pressure research. In Section II of this paper, we describe our system in detail. In Section III we discuss calibration and optical testing. In Sections IV and V, we demonstrate the system by presenting data on the kinetics of a pressure quench-induced colloidal phase transition and high-resolution imaging of bacteria growing under pressure. Finally, we present our conclusions in Section VI.
II Pressure cell design
(a)
(b)
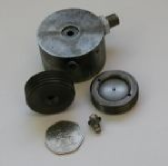
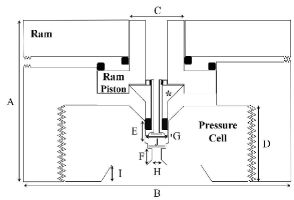
Figures 1(a) illustrates the design of our pressure cell system, a photograph of which is shown in Figure 1(b). Dimensions are given in Table 2. The system consists of two basic parts: the pressure cell and the pressurizing ram. Each of these parts has an associated piston. The pressure cell, of diameter 35mm, contains the sample chamber [diameter 4.5mm], which has a window aperture of diameter 1.5mm. A piston of diameter 4.5mm fits into the cell. The pressure cell is screwed into the ram, in such a way that the ram piston exerts pressure on the pressure-cell piston when hydraulic fluid is pumped into the ram. Brake fluid is used as the hydraulic fluid of choice, particularly for rapid quenching, due to its low compressibility and temperature-independent properties.
| Rams | |||
|---|---|---|---|
| A | B | C | |
| Solid ram | 29.5 | 50.0 | 0.0 |
| Hollow ram | 29.5 | 50.0 | 10.0 |
| Pressure cells | ||||||
|---|---|---|---|---|---|---|
| D | E | F | G | H | I | |
| Cell 1 | 13.5 | 3.0 | 4.0 | 0.5 | 1.5 | 3.0 |
| Cell 2 | 10.5 | 3.5 | 1.5 | 0.5 | 1.5 | 2.5 |
| Pressure cell pistons | |
|---|---|
| J | |
| Solid piston | 4.5 |
| Hollow piston | 4.5 |
The pressure cell is made of TiMetal 550 titanium alloy, which is machined to shape and heat treated for maximum tensile strength. This heat treatment also causes the metal surface to darken, reducing the reflection of light inside the cell. The pressure cell window is made of either 0.5mm thick type 2A gem quality diamond (Element 6, Cuijk, The Netherlands) or 0.45mm optical quality quartz (UQG Optics). The window is attached to the optically flat surface by a Poulter-type seal and fixed at 180∘C with chemically resistant adhesive (MBond). The pressure cell piston is made of TiMetal 550, machined and heat treated as described above. Sealing rings are made of polytetrafluoroethylene (PTFE) for low pressure sealing (up to 200MPa) and phosphorbronze plus PTFE for high pressure sealing (up to 700MPa). For transmitted light microscopy, we have made a version of the pressure cell piston which is hollow and contains a 0.5mm thick diamond window, fixed using a Poulter-type seal as described above. Light can pass into the cell through this window, when used in conjunction with a hollow version of the ram piston. The ram is made of w-720 tool steel (Böhler UK), fitted to standard hydraulic connectors, and the ram piston uses single or dual O-ring seals (solid and hollow versions respectively).
We have constructed multiple versions of both the ram and the pressure cell. These have different functionalities and can be combined in a modular fashion. The hollow version of the ram contains a hollow piston, and is suitable for transmitted light microscopy. An alternative, solid, ram contains instead a solid piston. The solid ram has a simpler and more rugged design, making it more suited to higher pressures. Pressure cell 1 is designed for pressures up to 700MPa and has a diamond window of thickness 0.5mm. This cell allows for a working distance of 4mm and is compatible with a commercial 20 Extra Long Working Distance (ELWD) objective (Nikon; working distance: 8.1-7.0mm, NA: 0.45). Pressure cell 2 is designed for higher resolution at pressures up to 100MPa. This cell has a quartz window of thickness 0.45mm, with a more open window surround, and can achieve a working distance of 1.4mm, making it compatible with a 60 ELWD objective (Nikon; working distance: 1.5-2.1mm, NA: 0.70). The pressure cells can be used in combination with either of two pressure cell pistons: a hollow piston containing a diamond window, which is suitable for transmitted light imaging, and a more rugged solid piston.
III Calibration and testing
III.1 Pressure calibration
III.1.1 Higher pressure (200-700MPa)
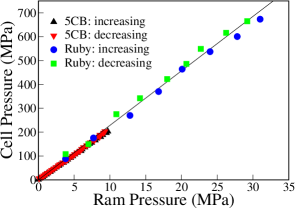
In the higher pressure range (200-700MPa), the ruby fluorescence technique (R1 line) was used for calibration Grasset (2001). A tiny crystal of natural ruby was attached to the inside of the diamond window with transparent araldite and the cell was filled with water. Temperature was controlled at 26.00.1∘C. A neon bulb was used to provide a calibration reference line, in near coincidence with the R2 ruby line. A Coderg triple 800 spectrometer set for high resolution (0.33cm-1), with steps of 0.125cm-1, was used to obtain ruby spectra at different pressures, and the best fit to a Lorentzian lineshape was used to obtain the position of the R1 ruby line, relative to the neon reference, allowing the pressure inside the cell to be determined. A high resolution spectrometer is required because the magnitude of the R1 shift is very small. Results for pressure cell 1 are shown in Figure 2(a). The calibration was done with an Enarpac Bourdon gauge with a scale reading to 40 MPa, with the fluorescence wavelength shift taken as 7.68 cm-1 / GPa.
(a)
(b)
III.1.2 Lower pressure (200MPa)
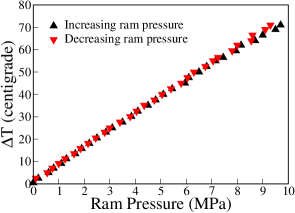
In the lower pressure range (below 200MPa), a liquid crystal calibration method was used. This provides a remarkably simple yet accurate method of calibration which requires only accurate temperature control. The method involves observing the nematic to isotropic phase transition of pentyl-cyanobiphenyl (5CB) as the cell is heated in stages through the transition into the isotropic phase. The transition pressure in the cell can then be calculated from the formula derived by Shashidhar and Ventkatesh Shashidar and Venkatesh (1979) for 5CB:
| (1) |
where is the temperature above the ambient pressure transition temperature (in centigrade) and P is in kbar (1kbar101MPa). Ram pressure is then gradually applied until the nematic phase is restored. By slowly reducing the ram pressure until the transition reverses, a measurement of the hysteresis of the cell at that pressure is obtained.
To observe the transition, about 2 to 3 mm depth of neat 5CB was placed in the cell and sealed with the light transmitting (hollow) pressure cell piston. A small amount of laser light passed through the cell and was observed on a screen. As pressure was applied, the laser spot shimmered just before the transition before being abruptly extinguished at the transition. After about 30 seconds a much weaker spot appeared on the screen with a polarisation generally different to the laser polarisation. On slowly releasing the ram pressure, the spot shimmered and then became much brighter as the transition reversed.
Although a laser was used in this calibration, it is not essential: the transition can be observed quite easily with ordinary light. As the cell pressure is derived directly from the temperature, a cheap low accuracy Bourdon gauge is sufficient for the ram pressure measurement, as long as the calibration curve is re-measured for each gauge.
Figure 2(b) shows a 5CB calibration of pressure cell 1. The ram pressure was measured with a small 10MPa R.S. Bourdon gauge. Figure 2(a) (triangles) shows the same data, with the vertical axis translated into the cell pressure using Eq.(1). The solid line shows the expected pressure in the cell if the seals were 100% efficient and had zero friction. Both the 5CB and ruby calibrations in Figure 2(a) show straight lines with very little hysteresis. The gradient of the line for the 5CB calibration is slightly lower than that for the ruby calibration, suggesting that the 10MPa gauge was slightly overestimating the ram pressure with respect to the 40MPa gauge. This was later confirmed in a separate measurement. We note that the 5CB calibration method could be extended to higher pressures for pressure cells which can withstand very high temperatures.
III.2 Optical resolution
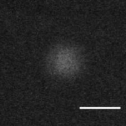
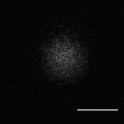
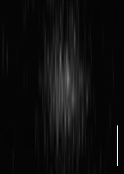
To evaluate the optical resolution of our two pressure cells, we imaged 3m fluorescent beads (Sigma-Aldrich) in a Nikon/Bio-Rad confocal microscope with a 488nm laser. Figure 3 shows horizontal (a and b) and vertical (c and d) section images of a single bead, averaged over 8 frames and corrected for the sample medium White et al. (1996). While we are able to resolve single beads in both pressure cells, significantly better resolution is achieved with cell 2.
(a)
 (b)
(b)
(c)
 (d)
(d)
IV Application 1: Colloidal phase transition kinetics
Hydrostatic pressure can be used in colloid science to modify interactions, change the relative composition of multi-component samples (if the components have different compressibilities) and to reach new nonequilibrium states by rapid quenching. For example, the effect of pressure on hydrophobic interactions has been explored experimentally for proteins Meersman et al. (2006) and polymers Meersman et al. (2005) and via simulations for proteins and hydrophobic solutes Hummer et al. (1998); Hillson et al. (1999); Ghosh et al. (2003, 2002). Other researchers have used hydrostatic pressure to investigate the phase diagram of a system of adhesive colloids Vavrin et al. (2009) and to adjust the volume fraction of a sample of colloidal rods, leading to a transition from the isotropic phase into the nematic phase Lettinga . These studies involved slow changes of pressure, but it is possible to achieve pressure changes at the speed of sound, significantly faster than changes of temperature. Pressure therefore presents promising possibilities for experiments requiring fast quench rates. For example, the kinetics of relaxation to equilibrium in binary fluids have been investigated using rapid pressure quenches combined with light scattering Wong and Knobler (1979). Our interest is in the spatial structure of binary fluids undergoing a phase separation which is arrested by the jamming of colloidal particles at the fluid interfaces Herzig et al. (2007). These systems are highly heterogeneous, making fluorescence confocal microscopy the technique of choice. Here, we present data obtained using pressure cell 1 (which has a 0.5mm thick diamond window), in combination with fluorescence confocal microscopy with a 20 ELWD objective, for both slow and rapid pressure quenches.
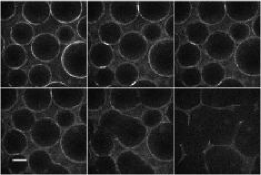
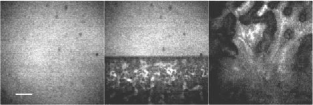
Figure 4 shows a series of images of a binary fluid of water and 2,6-lutidine containing colloidal silica particles, as it undergoes a slow change in pressure from 0.1MPa to 101MPa. The interfaces between the liquid phases are stabilized by the colloidal silica (this is a particle-stabilized emulsion Herzig et al. (2007)). The silica is dyed using the fluorescent dye FITC and a small fraction of the silica particles are dispersed in the continuous phase of the emulsion. The use of fluorescence facilitates imaging deeper into the sample. At the start of the experiment the binary fluid sample is under conditions (37∘C, atmospheric pressure) where the two liquids are demixed. On increasing the pressure the liquids begin to remix – reducing the interfacial tension and hence releasing some of the particles trapped at the interface. The particles are pushed into close contact as the emulsion is destroyed, resulting in some residual clustering in the final frame, even though by this frame the liquids are completely demixed.
We next demonstrate the use of pressure cell 1 for a rapid pressure quench experiment on the water, 2,6-lutidine, colloidal silica system. Here, we start the experiment in the single-fluid region of the phase diagram where the two liquids are mixed (101 MPa and 35∘C, achieved by first pressurising then warming the sample). At this temperature and at atmospheric pressure the liquids would be in the demixed, two-fluid phase. We can therefore observe the demixing transition by rapidly releasing the pressure; this is achieved by dumping the pressurising brake fluid out of the ram through a solenoid valve.
The confocal microscopy images captured during the pressure quench experiment are shown as a time sequence in Figure 5. Since the images are formed by scanning a laser, time progresses both between frames (left to right) and from the top to the bottom of a frame. The first frame in Figure 5 shows a dispersion of particles in the single-fluid phase. The brake fluid is released while the laser is scanning the second frame and this induces a rapid phase separation: a dramatic change in the sample properties occurs over the scanning of five horizontal lines. By the third frame, the phase separation is well developed; the colloidal particles partition into one of the phases which appears brighter than the other. This series of images can be used to estimate the speed of the pressure quench: since the phase transition occurs within the scanning of five lines (at 500 lines per second), we estimate that the quench occurs in 10 ms. We note that the sudden change in pressure under adiabatic conditions results in a concomitant change in the temperature Wong and Knobler (1979) – we verified that this change in temperature did not itself cause a phase transition.
V Application 2: Bacterial growth under pressure
(a)
 (b)
(b)
(c)
Hydrostatic pressure is of interest in microbiology in several contexts. Understanding how deep sea microorganisms have evolved to tolerate and even require pressure Bartlett (2008); Kato et al. (2008) has potential applications in biotechnology as well as marine ecology. Applying pressure to non-pressure-adapted microorganisms is also of interest, both as a means of food sterilisation San Martin et al. (2002); Mañas and Mackey (2004); Moussa et al. (2007) and in the general context of microbial stress response Welch et al. (1993); Aertsen et al. (2004a, b); Aertsen et al. (2005); Abe (2007). In all these areas, the ability to image microorganisms in a pressurised microscope cell can provide powerful insights. For example, microscopy can reveal pressure effects on DNA configuration Mañas and Mackey (2004); Moussa et al. (2007) or protein localisation Ishii et al. (2004) within the cell. A microscopic approach also allows one to detect heterogeneity among the cellular population (which is believed to be an important factor in survival of environmental stresses Aertsen and Michiels (2005a); Booth (2002)), and to measure single-cell properties such as swimming speeds Eloe et al. (2008).
(a)
 (b)
(b)
(c)
 (d)
(d)
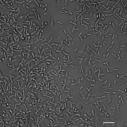
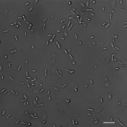
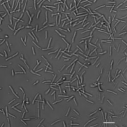
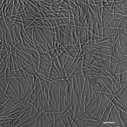
Here, we demonstrate that our system can be used to monitor pressure-associated morphological changes in the bacterium Escherichia coli. E. coli is a non-pressure-adapted organism whose cells are rod-shaped and of typical size 12m when growing exponentially at atmospheric pressure. The morphological response of E. coli to pressure is well documented. The details are strain-dependent, but a general picture is that when exposed to pressures up to 25MPa, E. coli cells continue to grow and divide, but become somewhat elongated compared to those grown at atmospheric pressure Zobell and Cobet (1962, 1964); Aertsen and Michiels (2008). At higher pressures, in the range 30-50MPa, cell division is inhibited, leading to filamentous growth Ishii et al. (2004); Sato et al. (2002); Welch et al. (1993); Zobell and Cobet (1962, 1964), while growth is abolished altogether above 60MPa Zobell and Cobet (1962); Ishii et al. (2004); Welch et al. (1993). Exposure to pressures above 150MPa leads to cell death: microscopic studies of E. coli after short-term exposure to such pressures have reported filamentation Kawarai et al. (2004), aggregation of cytoplasmic proteins Mañas and Mackey (2004); Moussa et al. (2007) and nucleoid condensation Mañas and Mackey (2004); Moussa et al. (2007).
Here, we present transmitted light images of E. coli cells growing at 50MPa, obtained using pressure cell 2 on an inverted Nikon Ti-U microscope with a 60 ELWD objective. We compare the behaviour of two E. coli strains: the wild-type strain MG1655 and strain BW25113lon Baba et al. (2006) which is unable to produce the Lon protease enzyme.
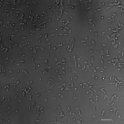
Figure 6 shows E. coli MG1655 cells growing at 50MPa, 120 minutes (a), 620 minutes (b) and 20 hours (c) after pressurisation. The experimental protocol is given in the caption. Filamentation is clearly apparent (whereas the same strain grown in the pressure cell at 0.1MPa shows no filamentation; data not shown). Interestingly, the population is heterogeneous: there is variability in length among those cells that do filament and some cells apparently do not filament at all. We have observed motility of some of these non-filamented cells even after 20 hours growth at 50MPa. A distribution in lengths among filamentous cells grown under pressure has been noted before Zobell and Cobet (1964), but to our knowledge this variability has not been studied in detail.
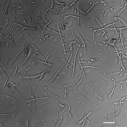
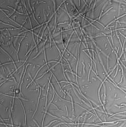
Figure 7 shows equivalent images for the mutant BW25113lon Baba et al. (2006), which is unable to produce the Lon protease. This strain, like MG1655, is able to divide normally when grown at 0.1MPa, but produces filaments when grown at 50MPa. However, in contrast to MG1655, the lon mutant population appears to filament homogeneously, with fewer unfilamented cells being visible. Previous work by Aertsen and Michiels has shown that lon mutants display hyperfilamentation after brief periods of pressurisation at 100MPa, and that this is due to activation of the SOS response pathway Aertsen et al. (2004b); Aertsen and Michiels (2005b, 2008). Interestingly, however, previous work characterising changes in the E. coli protein Welch et al. (1993) and mRNA Ishii et al. (2005) composition during growth at 50MPa has not shown activation of the SOS pathway. We plan to carry out a more detailed study of the factors governing filamentation at 50MPa in BW25113lon versus MG1655 in future work.
VI Conclusions
In this paper, we have described a microscope pressure cell system with a modular design, in which parts can be interchanged to allow for a wide range of applications. Our system consists of a pressurized cell and piston, a ram with associated piston, and a temperature-controlled holder. We have designed two versions of the pressurized cell, suitable for pressures in the ranges 0.1-700MPa (cell 1) and 0.1-200MPa (cell 2). We have also developed two versions of the pressure cell piston, one hollow, to allow for transmitted light imaging, and the other solid and more rugged in design, and the ram has been constructed in both hollow and solid versions. The system was calibrated using the ruby fluorescence technique for pressures in the range 200-700MPa, and using a method based on the isotropic-nematic transition of the liquid crystal 5CB in the pressure range 0.1-200MPa. The latter proved a very simple and convenient calibration method.
We have demonstrated our pressure cell system for two different applications. Our first application was in colloid science. Here, we used pressure cell 1 to image phase separation in a binary fluid in which the fluid-fluid interfaces are coated with fluorescent colloidal particles. We observed remixing of a phase separated binary fluid as pressure was slowly increased, as well as sudden demixing of a mixed sample on rapid pressure quenching from 101MPa to 0.1MPa. Our second application was in microbiology. Here, we used pressure cell 2 to obtain high resolution images of the growth of Escherichia coli bacteria at 50MPa. We compared the behaviour of two E. coli strains: the wild-type strain MG1655 and strain BW25113lon, which is unable to produce the Lon protease enzyme. We observed heterogeneous filamentation of E. coli MG1655 at 50MPa, with marked variability among individual cells in the population. In contrast, the lon mutant BW25113lon, which is hypersensitive to pressure Aertsen and Michiels (2005b, 2008), showed more uniform filamentation across the population.
We plan to use this pressure cell system for further studies in both colloid science and microbiology. In particular, we are interested in the effects of pressure on the interactions between hydrophobic colloids, as models for protein complexation and aggregation, in further characterising the factors governing E. coli filamentation in response to pressure at the single cell level, and in visualising bacterial gene regulatory responses to pressure, using fluorescent reporter proteins. Other applications for this system could include using pressure to trigger phase transitions in complex fluids (as illustrated here for a binary fluid), single cell imaging of microbial killing using short bursts of high pressure and imaging of calcium signalling in mammalian cartilage cells in response to pressure stimuli. Because our system is designed in a modular way, it can easily be augmented with new components as they become necessary for new applications. Components currently under development for use with this system include an additional pressure cell capable of achieving even higher pressures, a very high resolution cell for use at lower pressures, a module to allow for injection of liquids into the cell under pressure and a “flow through” module which would allow continuous perfusion of liquid through the pressurised cell.
Acknowledgements.
The authors acknowledge valuable discussions with Doug Bartlett, Gail Ferguson, Andrew Hall and Chiaki Kato. This work was supported by EPSRC under grant EP/E030173 and by the SoftComp EU Network of Excellence. SLB and EMH were funded by EPSRC studentships. RJA was funded by the Royal Society and by the Royal Society of Edinburgh. We thank NIG Japan for providing the Keio collection and the Collaborative Optical Spectroscopy, Micromanipulation and Imaging Centre (COSMIC) for use of the confocal microscope.References
- McMahon and Nelmes (2006) M. I. McMahon and R. J. Nelmes, Chem. Soc. Rev. 35, 943 (2006).
- Pae and Bhateja (1975) K. D. Pae and S. K. Bhateja, J. Macromolecul. Sci. R. M. C 13, 1 (1975).
- Deguchi and Tsujii (2007) S. Deguchi and K. Tsujii, Soft Matter 3, 797 (2007).
- Smeller (2002) L. Smeller, BBA – Protein Struct. M. 1595, 11 (2002).
- Macgregor (2002) R. B. Macgregor, BBA – Protein Struct. M. 1595, 266 (2002).
- Winter (2001) R. Winter, Curr. Opin. Colloid In. 6, 303 (2001).
- Heremans (1982) K. Heremans, Ann. Rev. Biophys. Bioeng. 11, 1 (1982).
- Urban (1994) J. P. G. Urban, Brit. J. Rheumatol. 33, 901 (1994).
- Seefeldt et al. (2009) M. B. Seefeldt, M. S. Rosendahl, J. L. Cleland, and L. K. Hesterberg, Curr. Pharm. Biotechnol. 10, 447 (2009).
- San Martin et al. (2002) M. F. San Martin, G. V. Barbosa-Canovas, and B. G. Swanson, Crit. Rev. Food Sci. 42, 627 (2002).
- Diehl et al. (2008) P. Diehl, J. Schauwecker, W. Mittelmeier, and M. Schmitt, Anticancer Res. 28, 3877 (2008).
- Bartlett (2008) D. H. Bartlett, in High Pressure Microbiology, edited by C. Michiels, D. H. Bartlett, and A. Aertsen (American Society for Microbiology Press, Washington, D. C., 2008), pp. 195–201.
- Gross and Jaenicker (2006) M. Gross and R. Jaenicker, J. Biotechnol. 126, 11 (2006).
- Abe (2007) F. Abe, Biosci. Biotech. Bioch. 71, 2347 (2007).
- Abe et al. (1999) F. Abe, C. Kato, and K. Horikoshi, Trends Microbiol. 7, 447 (1999).
- Jayamaran (1983) A. Jayamaran, Rev. Mod. Phys. 55, 65 (1983).
- Oger et al. (2006) P. M. Oger, I. Daniel, and A. Picard, BBA – Prot. Proteom. 1764, 434 (2006).
- Perrier-Cornet et al. (1995) J.-M. Perrier-Cornet, P.-A. Maréchal, and P. Gervais, J. Biotechnol. 41, 49 (1995).
- Reck et al. (1998) T. Reck, E. Sautter, W. Dollhopf, and W. Pechhold, Rev. Sci. Instrum. 69, 1823 (1998).
- Maeda and Koizumi (1996) Y. Maeda and M. Koizumi, Rev. Sci. Instrum. 67, 2030 (1996).
- Hartmann et al. (2004) M. Hartmann, M. Kreuss, and K. Sommer, Cell. Mol. Biol. 50, 479 (2004).
- Hartmann et al. (2003) M. Hartmann, F. Pfeiffer, G. Dornheim, and K. Sommer, Chem-Ing-Tech 75, 1763 (2003).
- Frey et al. (2006) B. Frey, M. Hartmann, M. Merrmann, R. Meyer-Pittroff, K. Sommer, and G. Bluemelhuber, Microsc. Res. Tech.. 69, 65 (2006).
- Nishiyama et al. (2009) M. Nishiyama, Y. Kimura, Y. Nishiyama, and M. Terazima, Biophys. J. 96, 1142 (2009).
- Koyama et al. (2001) S. Koyama, T. Miwa, T. Sato, and M. Aizawa, Extremophiles 5, 409 (2001).
- Salmon and Ellis (1975) E. D. Salmon and G. W. Ellis, J. Cell Biol. 65, 587 (1975).
- Raber et al. (2006) E. C. Raber, J. A. Dudley, M. Salerno, and P. Urayama, Rev. Sci. Instrum. 77, 096106 (2006).
- Deguchi and Tsujii (2002) S. Deguchi and K. Tsujii, Rev. Sci. Instrum. 73, 3938 (2002).
- Mukai et al. (2006) S. Mukai, S. Deguchi, and K. Tsujii, Colloid Surface A 282–283, 483 (2006).
- Besch and Hogan (1996) S. R. Besch and P. M. Hogan, Undersea Hyperbar. M. 23, 175 (1996).
- Mizuno (2005) S. Mizuno, Am. J. Cell Physiol. 288, C329 (2005).
- Pagliaro et al. (1995) L. Pagliaro, F. Reitz, and J. Wang, Undersea Hyperbar. M. 22, 171 (1995).
- Grasset (2001) O. Grasset, High Pressure Res. 21, 139 (2001).
- Shashidar and Venkatesh (1979) R. Shashidar and G. Venkatesh, J. Phys–Paris 40, C3 (1979).
- White et al. (1996) N. S. White, R. J. Errington, M. D. Fricker, and J. L. Wood, J. Microsc. 181, 99 (1996).
- Meersman et al. (2006) F. Meersman, C. M. Dobson, and K. Heremans, Chem. Soc. Rev. 35, 908 (2006).
- Meersman et al. (2005) F. Meersman, J. Wang, Y. Wu, and K. Heremans, Macromolecules 38, 8923 (2005).
- Hummer et al. (1998) G. Hummer, S. Garde, A. E. Garcia, M. E. Paulaitis, and L. R. Pratt, Proc. Natl. Acad. Sci. USA 95, 1552 (1998).
- Hillson et al. (1999) N. Hillson, J. N. Onuchic, and A. E. Garcia, Proc. Natl. Acad. Sci. USA 96, 14848 (1999).
- Ghosh et al. (2003) T. Ghosh, A. E. Garcia, and S. Garde, J. Phys. Chem. B 107, 612 (2003).
- Ghosh et al. (2002) T. Ghosh, A. E. Garcia, and S. Garde, J. Chem. Phys. 116, 2480 (2002).
- Vavrin et al. (2009) R. Vavrin, J. Kohlbrecher, A. Wilk, M. Ratajczyk, M. P. Lettinga, J. Buitenhuis, and G. Meier, J. Chem. Phys. 130, 154903 (2009).
- (43) M. P. Lettinga, personal communication.
- Wong and Knobler (1979) N. C. Wong and C. M. Knobler, Phys. Rev. Lett. 43, 1733 (1979).
- Herzig et al. (2007) E. M. Herzig, K. A. White, A. B. Schofield, W. C. K. Poon, and P. S. Clegg, Nat. Mater. 6, 966 (2007).
- Kato et al. (2008) C. Kato, Y. Nogi, and S. Arakawa, in High Pressure Microbiology, edited by C. Michiels, D. H. Bartlett, and A. Aertsen (American Society for Microbiology Press, Washington, D. C., 2008), pp. 203–217.
- Mañas and Mackey (2004) P. Mañas and B. M. Mackey, Appl. Env. Microbiol. 70, 1545 (2004).
- Moussa et al. (2007) M. Moussa, J.-M. Perrrier-Cornet, and P. Gervais, Appl. Env. Microbiol. 73, 6508 (2007).
- Welch et al. (1993) T. J. Welch, A. Farewell, F. C. Neidhardt, and D. H. Bartlett, J. Bacteriol. 175, 7170 (1993).
- Aertsen et al. (2004a) A. Aertsen, K. Vanoirbeek, P. de Spiegeleer, J. Sermon, K. Hauben, A. Farewell, T. Nyström, and C. W. Michiels, Appl. Env. Microbiol. 70, 2660 (2004a).
- Aertsen et al. (2004b) A. Aertsen, R. van Houdt, K. Vanoirbeek, and C. W. Michiels, J. Bacteriol. 186, 6133 (2004b).
- Aertsen et al. (2005) A. Aertsen, P. de Spiegeleer, K. Vanoirbeek, M. Lavilla, and C. W. Michiels, Appl. Env. Microbiol. 71, 2226 (2005).
- Ishii et al. (2004) A. Ishii, T. Sato, M. Wachi, K. Nagai, and C. Kato, Microbiology + 150, 1965 (2004).
- Aertsen and Michiels (2005a) A. Aertsen and C. W. Michiels, Crit. Rev. Microbiol. 31, 69 (2005a).
- Booth (2002) I. R. Booth, Int. J. Food Microbiol. 78, 19 (2002).
- Eloe et al. (2008) E. A. Eloe, F. M. Lauro, R. F. Vogel, and D. H. Bartlett, Appl. Env. Microbiol. 74, 6298 (2008).
- Baba et al. (2006) T. Baba, T. Ara, M. Hasegawa, Y. Takai, Y. Okumura, M. Baba, K. A. Datsenko, M. Tomita, B. L. Wanner, and H. Mori, Mol. Systems Biol. 2, 2006.0008 (2006).
- Zobell and Cobet (1962) C. E. Zobell and A. B. Cobet, J. Bacteriol. 84, 1228 (1962).
- Zobell and Cobet (1964) C. E. Zobell and A. B. Cobet, J. Bacteriol. 87, 710 (1964).
- Aertsen and Michiels (2008) A. Aertsen and C. W. Michiels, in High Pressure Microbiology, edited by C. Michiels, D. H. Bartlett, and A. Aertsen (American Society for Microbiology Press, Washington, D. C., 2008), pp. 87–100.
- Sato et al. (2002) T. Sato, T. Miwa, A. Ishii, C. Kato, M. Wachi, K. Nagai, M. Aizawa, and K. Horikoshi, in Trends in high pressure bioscience and biotechnology, edited by R. Hayashi (Elsevier, Tokyo, 2002), pp. 233–238.
- Kawarai et al. (2004) T. Kawarai, M. Wachi, H. Ogino, S. Furukawa, K. Suzuki, H. Ogihara, and M. Yamasaki, Appl. Microbiol. Biotechnol. 64, 255 (2004).
- Aertsen and Michiels (2005b) A. Aertsen and C. W. Michiels, Res. Microbiol. 156, 233 (2005b).
- Ishii et al. (2005) A. Ishii, T. Oshima, T. Sato, K. Nakasone, H. Mori, and C. Kato, Extremophiles 9, 65 (2005).