Phase diagram of Janus Particles
Abstract
We deeply investigate a simple model representative of the recently synthesized Janus particles, i.e. colloidal spherical particles whose surface is divided into two areas of different chemical composition. When the two surfaces are solvophilic and solvophobic, these particles constitute the simplest example of surfactants. The phase diagram includes a colloidal-poor (gas) colloidal-rich (liquid) de-mixing region, which is progressively suppressed by the insurgence of micelles, providing the first model where micellization and phase-separation are simultaneously observed. The coexistence curve is found to be negatively sloped in the temperature-pressure plane, suggesting that Janus particles can provide a colloidal system with anomalous thermodynamic behavior.
An unprecedented development in particle synthesis is generating a whole new set of colloidal particles, characterized by different patterns, particle patchiness and functionalitiesGlotzer and Solomon (2007). This extensive effort is driven by the attempt to gain control over the three-dimensional organization of self-assembled materials, characterized by crystalline, or even disordered, colloidal structures with desired properties. The recently synthesized Janus colloidsRoh et al. (2005); Wang et al. (2008); Chen et al. (2009); Jackson et al. (2004); Hong et al. (2008); Walther and Müller (2008) — characterized by a surface divided into two areas of different chemical composition — offer a fine example of such versatility and can be reckoned as the paradigm of a system formed by incompatible elements within the same unit structure which spontaneously drive a self-assembly aggregation process into complex superstructures. Not only this is ubiquitous in biological and chemical systems, but, when carried out into a controlled manner, it constitutes one of the most promising bottom-up process for the design of future materials. Indeed the assembly behavior of Janus particles is receiving a considerable attentionHong et al. (2006); Erdmann et al. (2003); Miller and Cacciuto (2009).
With a proper choice of the chemico-physical surface properties, Janus particles can provide the most elementary and geometrically simple example of surfactant particlesErhardt et al. (2001), in which solvophilic and solvophobic areas reside on different parts of the surface of the same particle, in a controlled analogy to what is often found in the protein realm, e.g. hydrophobinM. Torkkeli et al. (2002) and caseinHorne (2002).
The phase behavior of typical surfactant molecules (as opposed to colloids) has been studied in details in the past, due to their role in industrial processes and productsD. Fennell Evans and H. Wennerström (1999). It is well appreciated that, with the right balance of solvophilic and solvophobic moieties, surfactants can spontaneously self assembly into a large variety of structures, including micelles, vesicles, lamellae. Often, an attractive interaction between the aggregates originates a macroscopic phase separation into a dense and a dilute micellar phaseCorti et al. (1984). In rare cases, the surfactant rich phase is characterized by micelles and the surfactant poor phase by unimers. One interesting question concerns the relation (or competition) between the gas-liquid phase separation and the process of micelles formation. While it is recognized that micelles formation can be seen as a sort of phase separation (in such a case the liquid is interpreted as an infinite size aggregate) it is rather unclear how the two phenomena really interrelate and if the same system can show a clear self assembly process in a certain region of temperatures and densities and a clear gas-liquid phase separation somewhere else. Previous extensive search for models able to display this mixed behavior— carried out by Panagiotopoulos and coworkersPanagiotopoulos et al. (2002); Salaniwal et al. (2003); Cheong and Panagiotopoulos (2006) — has been unsuccessful, thus hampering a deep understanding of the interplay between aggregation and phase separation. In all studied cases, on tuning some model parameters, macrophase separation becomes replaced by self-organization into isolated or interconnected micellesLo Verso et al. (2009).
In this Letter, we show that simply but realistically modeled Janus particles are ideal candidates for studying, within the same system, the interplay between aggregation and phase separation. Indeed, the system shows a clear phase-separation, characterized by the presence of a gas-liquid critical point and a micellar phase at lower temperatures. Micelles develop in the gas colloidal phase progressively acquiring stability, suppressing more and more the two-phase coexistence. Differently from all previously studied models, this micelles rich gas phase coexists with a dense fully connected liquid phase.
The Janus particles are described via the one-patch model introduced by Kern and Frenkel Kern and Frenkel (2003) with coverage . In this effective model the two hemispheres of a hard-core particle of diameter are considered respectively repulsive and attractive. When the segment connecting the centers of two particles crosses the attractive hemisphere of both particles, the two particles then interact via a square-well potential with range and depth . In all other orientations the interaction is hard-core. This model is inspired by the experimental system investigated in Ref. Hong et al. (2008), where the repulsive interaction has an electrostatic origin and the attractive part is hydrophobic. In the following, provides the unit of length and the unit of energy. is also expressed in unit of (i.e. Boltzman constant ).
Results reported in this Letter are based on an extensive numerical study of the model in a wide range of and . We employ the most accurate numerical methodologies to provide a detailed quantification of the phase behavior, including size-effect studies. Grand-canonical Monte Carlo (GCMC) simulations (for box size ) have been implemented to locate the critical point and the relation between density and activity, Gibbs ensemble simulationsPanagiotopoulos (1987) to evaluate the coexisting phases and standard Monte Carlo (MC) simulations in the NVT and NPT ensembles for large system sizes (number of particle ) to elucidate the structure of the phases and the equation of state. Since self-assembly requires large attraction strengths (compared to ) and large systems (indeed aggregates can grow to very large sizes) accurate numerical studies are rather difficult. We have explicitly checked that the studied system sizes are sufficiently large to avoid size effects. Large system sizes () have been studied also in GCMC and GEMC, especially at small densities to make sure that the simulation box contains several aggregates simultaneously. In all cases, translational and rotational moves consisting of a maximum random translation of and a maximum random rotation of rad of a randomly selected particle, have been implemented. Depending on the MC method, insertion and deletion moves (or swap moves) have been attempted, on average, every 500 displacement moves while volume change moves (with maximum volume changes of the order of ) every 100 translational moves. Extremely long simulation runs (of the order of 108 MC steps) have been performed to reach equilibrium. GEMC and GCMC simulations have been particularly painstaking, due to the difficulty of inserting/deleting, by a sequence of individual moves, large aggregates, requiring — for each studied low state point — several months of computer time.
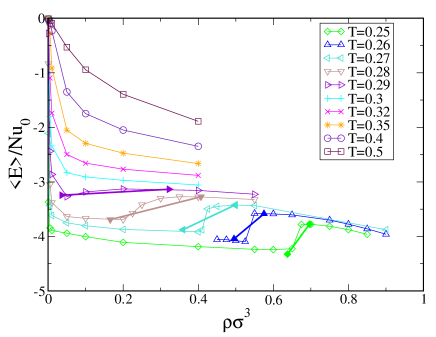
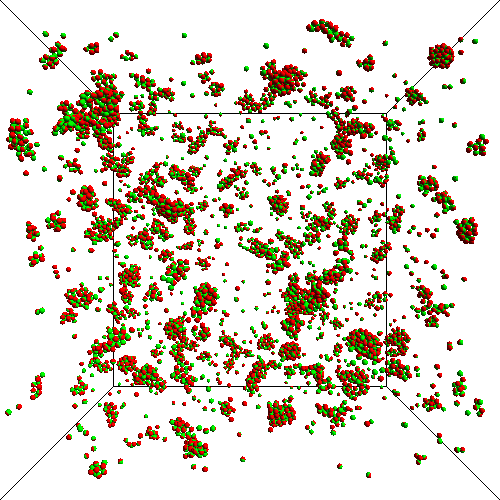
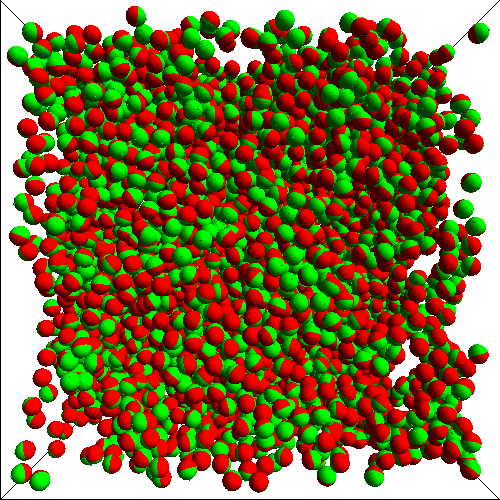
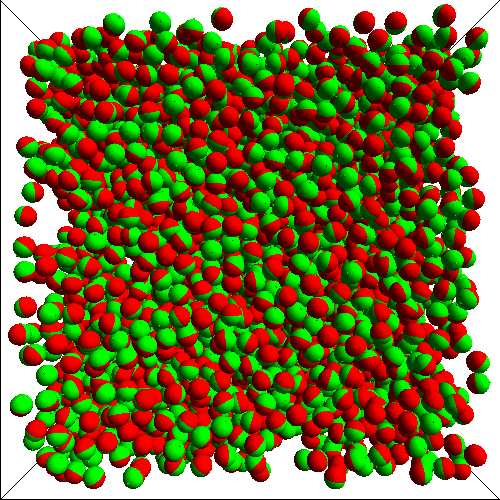
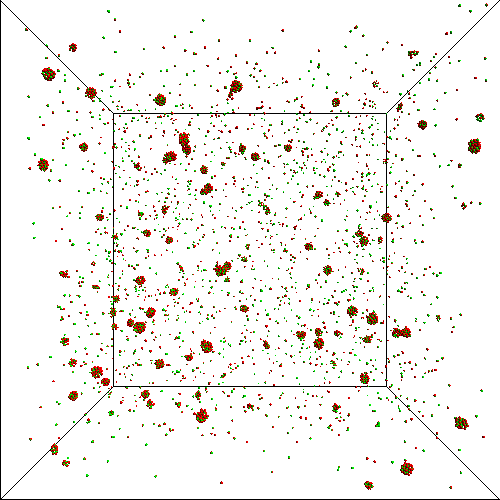
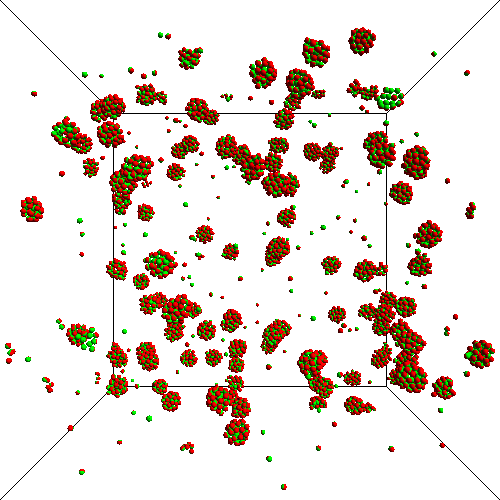
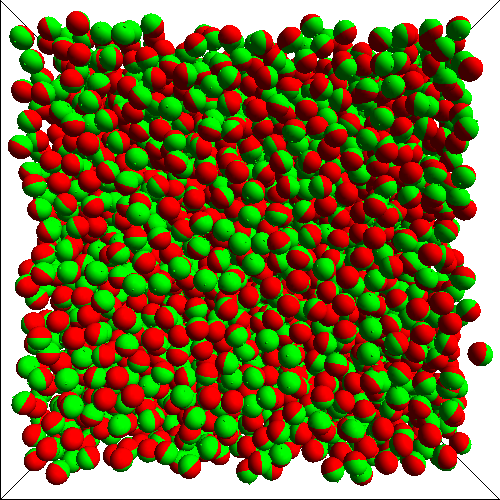
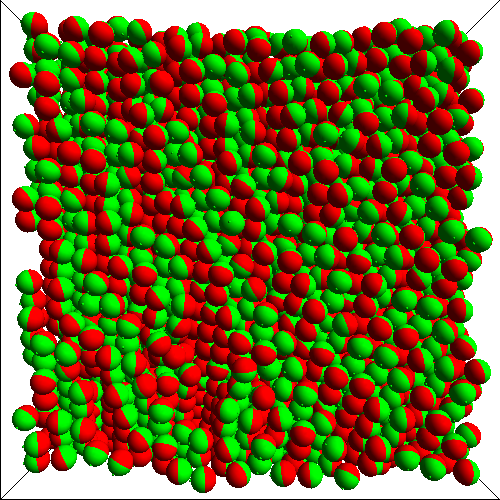
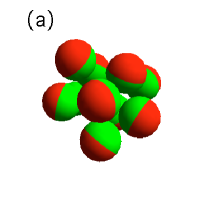
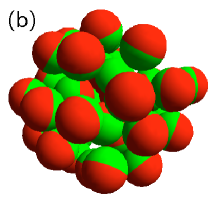
Fig. 1 shows the average potential energy per particle along several isotherms. Below , the density dependence of becomes non monotonic (reminiscent of the shape of a van der Waals loop), already suggesting the possibility of a phase separation. Several features significantly differ from the standard gas-liquid behavior: the most striking difference is the fact that, close to the loop, particles in the low density states are characterized by values significantly smaller than the one in the dense phase. At odd with the usual gas-liquid behavior, the position of the loop shifts to larger and its width appears to shrink on cooling. A glance to the structure of the system across density ( Fig. 2) along different isotherms immediately clarifies the reasons for such behavior. While at higher one observes the behavior typical of a fluid close to the gas-liquid critical point, i.e. a spatially inhomogeneous density (or equivalently particles associated in highly poly-disperse clusters), at lower the system self-assembles into well-defined, essentially spherical, clusters which appear to maintain their character in a wide region of . The most frequent clusters are composed by single-layer micelles (in which about ten particles orient their attractive part inside the aggregate, Fig. 3-(a) ) and double-layer micelles (or vesicles, in which about 40 particles organize into an inner and an outer shell forming a bilayer which exposes to the outside only the hard-core part, preventing any attraction between distinct aggregates, Fig. 3-(b)). The double-layer structure becomes the dominant one on cooling and/or on increasing . The organization of the system into these structures has the net effect of breaking the thermal correlations which propagate via inter-particle attraction, effectively preventing the development of long range critical fluctuation. This effect is evident at (Fig. 2(c),(h),(m)), where a percolating network of bonded particles is found only at . The insurgence of an energy driven formation of micelles effectively destabilizes the demixing of the system into a colloidal-poor (gas) phase coexisting with a colloidal-rich (liquid) phase.
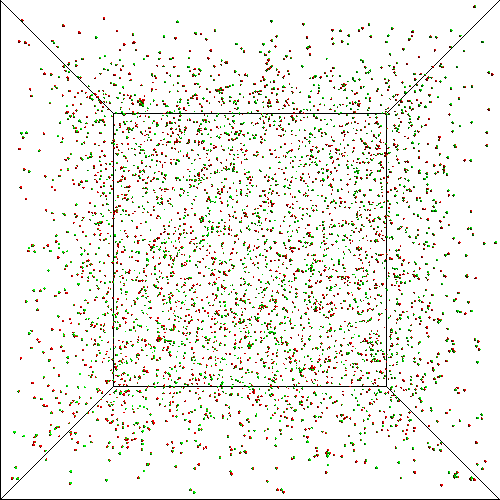
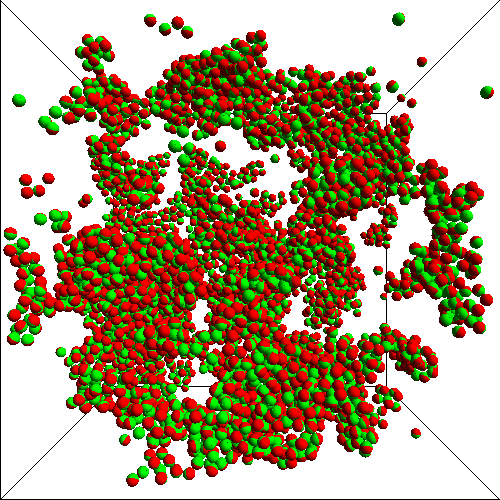
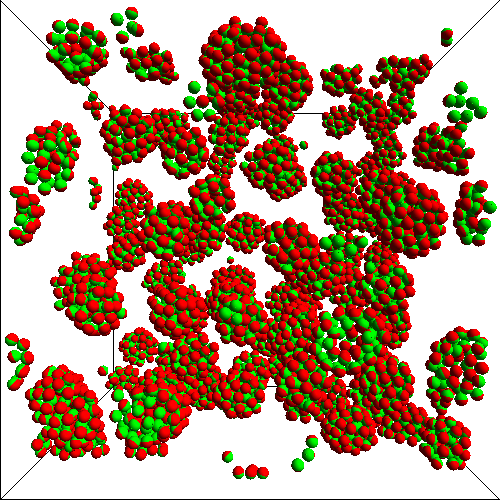
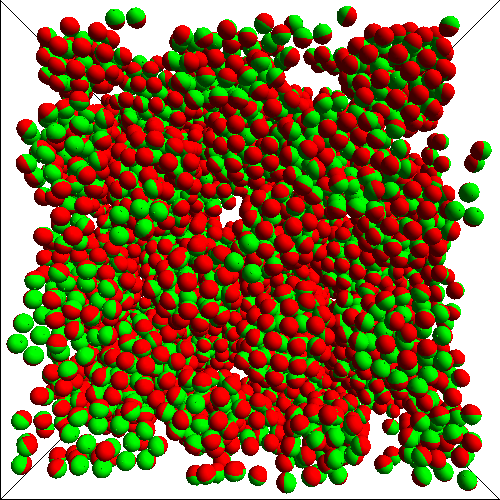
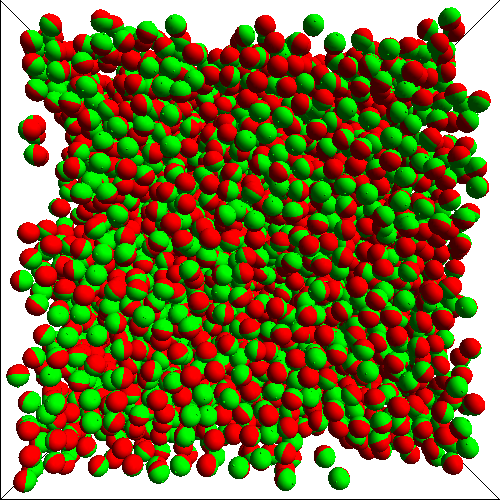
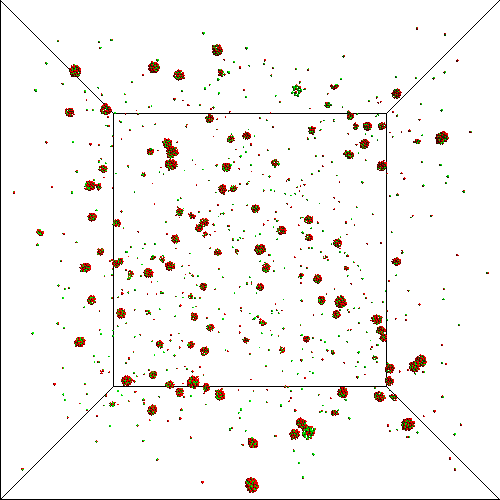
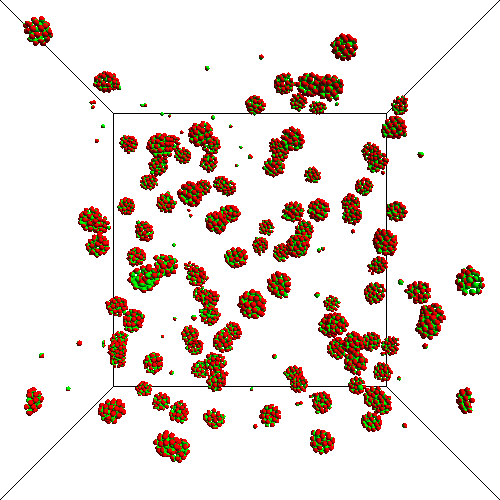
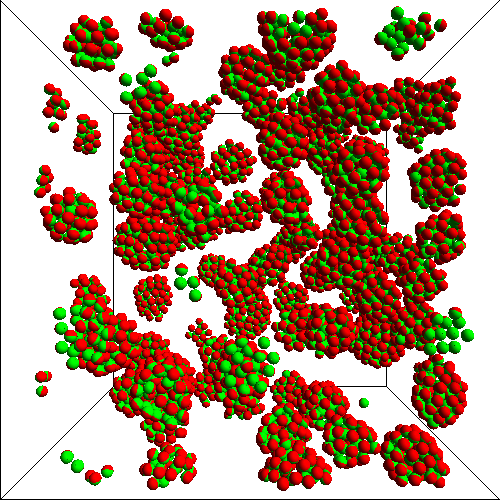
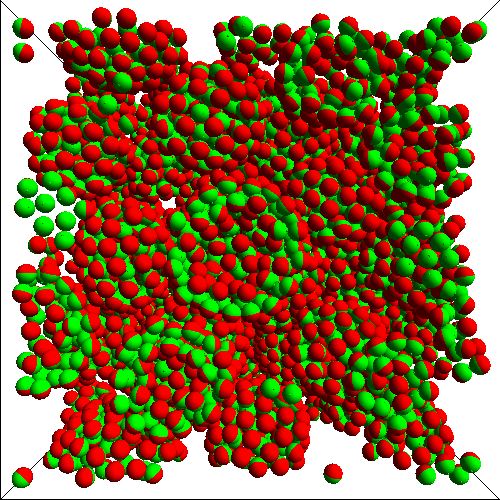
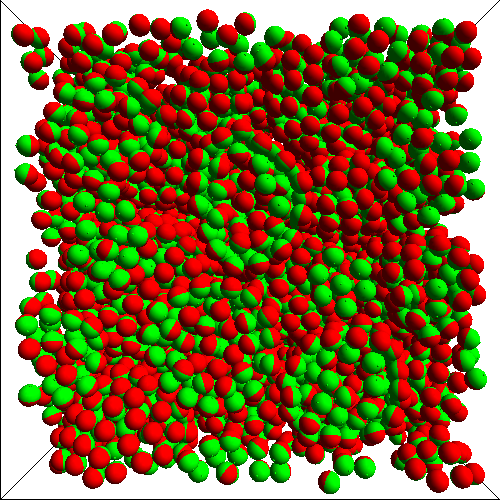
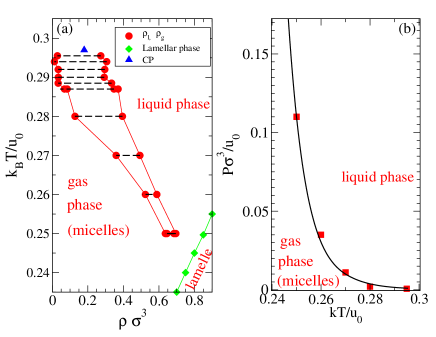
To provide evidence of the existence of a critical point, of a truly phase-coexistence and to evaluate the appropriate phase boundaries , we have performed GCMC simulations to locate the and chemical potential values for which the density fluctuations behave as the magnetization in the Ising modelWilding (1996) (providing the location of the critical point) and GEMC simulations, to calculate the densities of the coexisting phases. Results are reported in Fig. 4. Differently from the standard behavior, the region of phase coexistence which usually widens on cooling, here shrinks and shifts to the right, leaving a wide window where a homogeneous gas-like phase composed by large aggregates [Fig. 2 (g)-(h); (m)-(o)] is thermodynamically stable. Micelles coexist with a liquid-like non-micellar phase [Fig. 2 (j) and (p)], supporting the evidence that the phase-separation is not related to a critical phenomenon associated with inter-micelles interactions. The densities of both coexisting phases increase on cooling, progressively approaching each other, suggesting the possibility of a lower consolute point. Unfortunately, both the gas of micelles and the liquid phase become metastable in respect to the formation of a ordered (crystalline, lamellar) phase; the onset of crystallization, on the time scale probed by the numerical calculations, pre-empts the possibility of exploring such possibility. A snapshot of the system ordered in the lamellar phase is reported in Fig. 2(q).
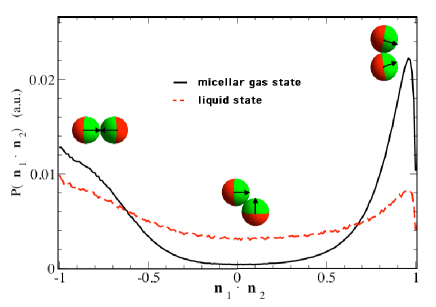
The energetic and entropic balance associated with the transition from the micelles gas to the liquid phase reveals some important information. As previously alluded while discussing Fig. 1, differently from the usual gas-liquid behavior, is higher in the liquid phase than in the micellar gas phase. Hence, despite the fact that the gas phase is stabilized by the translational entropy of the micelles, at coexistence the liquid phase is probably more (orientational) disordered than the gas one. Insights on the larger orientational order in the gas phase as compared to the liquid one, can be obtained by computing the distribution of relative orientations between all pairs of bonded particles. More precisely, for all bonded pairs, we have evaluated the distribution of the scalar product where and are the two unit vectors indicating the location of the patch center in each particle frame (see arrows in Fig. 5). The distribution is expected to show well defined peaks for an ordered state and to be flat in a completely disordered state. As shown in Fig. 5, is indeed significantly more structured in the micelles-rich gas phase with respect to the liquid phase.
To provide a definitive confirmation of the lower entropy of the gas phase () as compared to the liquid one (), we evaluated the equation of state at several by mean of MC simulations in the PNT ensemble. These results, coupled with the coexisting densities evaluated via GEMC, provide a method to calculate the slope () of the coexistence curve in the plane. By virtue of the Clapeyron equation, is a measure of , where and are the differences in entropy and volume of the two coexisting phases. Since a positive (negative) slope implies that . Fig. 4-(b) shows that the coexistence curve in the plane has an anomalous behavior. Differently from the usual gas-liquid coexistence, here the curve is negatively sloped, confirming that , despite the significantly larger translational contribution. The explanation for this odd behavior can be traced back to the orientational ordering of the particles in the gas micellar phase and to the disordered orientations which characterize the liquid phase (Fig. 5). As a result, the orientational disorder gain in the fluid phase compensates the energetic penalty. The negatively sloped gas-liquid coexistence curve indicates also that, on cooling along a constant (osmotic) pressure path, the density of the system decreases at the transition.
The results presented here have far-reaching consequences in many respects. From the theoretical side, our work constitutes the first study displaying a clear gas-liquid critical point which evolves into phase coexistence between a cluster and a liquid phase through a competition between phase-separation and micelles formation. In addition, the system studied here behaves as anomalous substance in which the dense phase is more disordered than the low-density phase and which, in analogy with the negatively sloped liquid water-hexagonal ice coexistence curve, expands on cooling along isobars. The simplicity of the model and its rich and unconventional phase diagram begs for experimental verifications. Despite the investigated model has a range () larger than the interaction ranges typical of m-sized colloids (usually of the order of 0.05-0.2 ), ranges comparable to can be realized with nanoparticles or building on the recently explored Casimir critical forces Gambassi et al (2009); Soyka et al (2008).
We acknowledge support from NoE SoftComp NMP3-CT-2004-502235, ERC-226207-PATCHYCOLLOIDS and PRIN-COFIN 2007. We thank C. De Michele for providing us with the code for generating Fig. 2 and J. Horbach, J. Largo and M. Noro for discussions.
References
- Glotzer and Solomon (2007) S. C. Glotzer and M. J. Solomon, Nat. Mat. 6, 557 (2007).
- Roh et al. (2005) K.-H. Roh, D. C. Martin, and J. Lahann, Nat. Mat. 4, 759 (2005).
- Wang et al. (2008) B. Wang, B. Li, B. Zhao, and C. Y. Li, J. Am. Chem. Soc. 130, 11594 (2008).
- Chen et al. (2009) C.-H. Chen, R. K. Shah, A. R. Abate, and D. A. Weitz, Langmuir 25, 4320 (2009).
- Jackson et al. (2004) A. M. Jackson, J. W. Myerson, and F. Stellacci, Nat. Mat. 3, 330 (2004).
- Hong et al. (2008) L. Hong, A. Cacciuto, E. Luijten, and S. Granick, Langmuir 24, 621 (2008).
- Walther and Müller (2008) A. Walther and H. Müller, Soft Matter 4, 663 (2008).
- Hong et al. (2006) L. Hong, A. Cacciuto, E. Luijten, and S. Granick, Nano Letters 6, 2510 (2006).
- Erdmann et al. (2003) T. Erdmann, M. Kröger, and S. Hess, Phys. Rev. E 67, 041209 (2003).
- Miller and Cacciuto (2009) W. L. Miller and A. Cacciuto, Phys. Rev. E 80, 021404 (2009).
- Erhardt et al. (2001) R. Erhardt et al., Macromolecules 34, 1069 (2001).
- M. Torkkeli et al. (2002) M. Torkkeli, R. Serimaa, O. Ikkala, and M. Linder, Biophys. J. 83, 2240 (2002).
- Horne (2002) D. S. Horne, Curr. Opin. Coll. & Interface Science 7, 456 (2002).
- D. Fennell Evans and H. Wennerström (1999) D. Fennell Evans and H. Wennerström, The colloidal domain (Wiley-Vch, 1999).
- Corti et al. (1984) M. Corti, C. Minero, and V. Degiorgio, J. Phys. Chem. 88, 309 (1984).
- Panagiotopoulos et al. (2002) A. Z. Panagiotopoulos, M. A. Floriano, and S. K. Kumar, Langmuir 18, 2940 (2002).
- Salaniwal et al. (2003) S. Salaniwal, S. K. Kumar, and A. Z. Panagiotopoulos, Langmuir 19, 5164 (2003).
- Cheong and Panagiotopoulos (2006) D. W. Cheong and A. Z. Panagiotopoulos, Langmuir 22, 4076 (2006).
- Lo Verso et al. (2009) F. Lo Verso, A. Z. Panagiotopoulos, and C. N. Likos, Phys. Rev. E 79, 010401 (2009).
- Kern and Frenkel (2003) N. Kern and D. Frenkel, J. Chem. Phys. 118, 9882 (2003).
- Panagiotopoulos (1987) A. Z. Panagiotopoulos, Mol. Phys. 61, 813 (1987).
- Wilding (1996) N. B. Wilding, J. Phys.: Condens. Matter 9, 585 (1996).
- Gambassi et al (2009) A. Gambassi et al, Europhysics News 40, 18 (2009).
- Soyka et al (2008) F. Soyka et al, Phys. Rev. Lett. 101, 208301 (2008).