Newly identified properties of surface acoustic power
Abstract
The cause of enhanced acoustic power surrounding active regions, the acoustic halo, is not as yet understood. We explore the properties of the enhanced acoustic power observed near disk center from 21 to 27 January 2002, including AR 9787. We find that (i) there exists a strong correlation of the enhanced high frequency power with magnetic-field inclination, with greater power in more horizontal fields, (ii) the frequency of the maximum enhancement increases along with magnetic field strength, and (iii) the oscillations contributing to the halos show modal ridges which are shifted to higher wavenumber at constant frequency in comparison to the ridges of modes in the quiet-Sun.
keywords:
Helioseismology, Observations; Active Regions, Magnetic Fields; Velocity Fields, Photosphere1 Introduction
introduction
The application of local helioseimology to probe the nature of solar active regions is critically important in understanding their origin and evolution. The influence of magnetic fields on incident acoustic waves is complex, but is coming under increased scrutiny due to advances in numerical simulations of wave propagation in magnetised plasmas (e.g. \openciteKC06; \openciteSET06; \opencitePK07; \openciteCGD08; \openciteRSK09). A successful model should reproduce all of the observed features, including changes in the surface amplitudes of waves in the vicinity of active regions.
The acoustic halo is an observed enhancement of high frequency acoustic power surrounding regions of strong magnetic field. This enhancement was discovered independently by \inlineciteBLFJ92, \inlineciteBBLT92 and \inlineciteTL93. Observations made using Ca II K-line images showed these enhancements extending tens of Mm beyond active regions [Braun et al. (1992a), Toner and Labonte (1993)]. \inlineciteBBLT92 showed patchier and more confined halos using Doppler velocity measurements taken in the Fe I 5576 line, and with higher spatial resolution. They also showed a peak in the power at 5.5 mHz. \inlineciteHindman:1998p398 and later \inlineciteJH02 demonstrated that halos seen in SOHO/MDI [Scherrer et al. (1995)] Dopplergrams tend to be prominent in intermediate magnetic field strengths of 50-250 G and are absent in continuum intensity observations. Acoustic halos have been shown to be more prominent in Ca II K-line power maps and less visible in the Doppler Ni I line shifts [Ladenkov et al. (2002)]. \inlineciteFinsterle2004 found that the acoustic halo increases in size with increasing height into the canopy over active regions. On the other hand, \inlineciteM05 found that high-frequency oscillations in TRACE UV filtergrams show deficits in magnetic fields, rather than enchancements. There is no established explanation for the enhanced power, although several ideas have been suggested (see Section \irefdiscussion).
In this paper we present an analysis revealing several new properties of acoustic halos and of surface acoustic power in general. We use data obtained by SOHO/MDI over 7 days containing several large active regions. In Section \irefone we demonstrate (i) a strong association of the enhanced high frequency power with nearly horizontal field, and (ii) an increase in the temporal frequency of the maximum enhancement with field strength. In Section \ireftwo we show that (iii) the oscillations contributing to the halos show modal ridges which are shifted to higher wavenumber at constant frequency than the ridges due to waves in the quiet-Sun. In the Discussion we list possible theories put forward, to date, that attempt to explain the existence of the acoustic halos, noting that none of them have been shown to explain all of the observed properties successfully.
2 Correlations between the acoustic power enhancement and the magnetic field
one
We use 7 days of observations from 21 - 27 January 2002 covering a significant number of active regions including AR 9787 which has already been subjected to a comprehensive helioseismic analysis [Gizon et al. (2009)]. We track the magnetograms and Dopplergrams, remapped into Postel’s projections, in 24 hour blocks centered at the disk center for the middle of that day. The scale of the map is Mm per pixel over 700 pixels, so the extent of the maps are about 975 Mm in each direction. The acoustic power maps are normalised to the quiet-Sun power by removing a spatial 2D 4th degree polynomial fit to the quiet-Sun power for each day and frequency band. This fit removes several effects including center-to-limb variations in the observed mode amplitudes and spatial fluctuations in the instrumental MTF. The latter includes variations of focus across the CCD.
The quiet-Sun is defined to be those pixels where the total magnetic field strength, , is less than 30 G. Standard (potential field) methods were applied to reconstruct the vector magnetic field, , at the Sun’s surface from the line-of-sight components given by the SOHO/MDI observations (see \inlineciteS82 for the more general problem of extrapolating the field into the overlying corona). The -direction is defined as positive in the direction of solar East perpendicular to the meridian, the -direction is defined as positive towards solar South perpendicular to the equator and the radial magnetic field is represented by . Keeping in mind that potential field extrapolations are not the best representation of the actual magnetic field [Wiegelmann et al. (2005)], we avoid using the strong fields (for example, in sunspots) where such extrapolations are known to be particularly unreliable.
The first four panels of Figure \irefacpow9787 show acoustic power in 1 mHz bands centered on (a) 3 mHz, (b) 4 mHz, (c) 5 mHz and (d) 6 mHz for the 24 January 2002. The sunspot in AR 9787 is seen close to the center. The bottom two panels show intensity continuum (e) and the line-of-sight magnetic field (f). In the lower frequency bands, (a) and (b), we see suppression of acoustic power coincident with the location of magnetic field. In (c) we begin to see an enhancement of power surrounding the suppression in plage regions, and in (d) we see predominantly enhanced power except in the very strongest of magnetic fields, within the sunspot itself. It is clear that both the suppression (at lower frequencies) and enhancement (at higher frequencies) are spatially correlated with the magnetic field, even in the smallest plage regions. It is also interesting to note from panels (d) and (f) that the strongest 6 mHz enhancements are located between regions of opposite polarity (indicated by the arrows), leading us to explore the dependence upon magnetic field inclination.
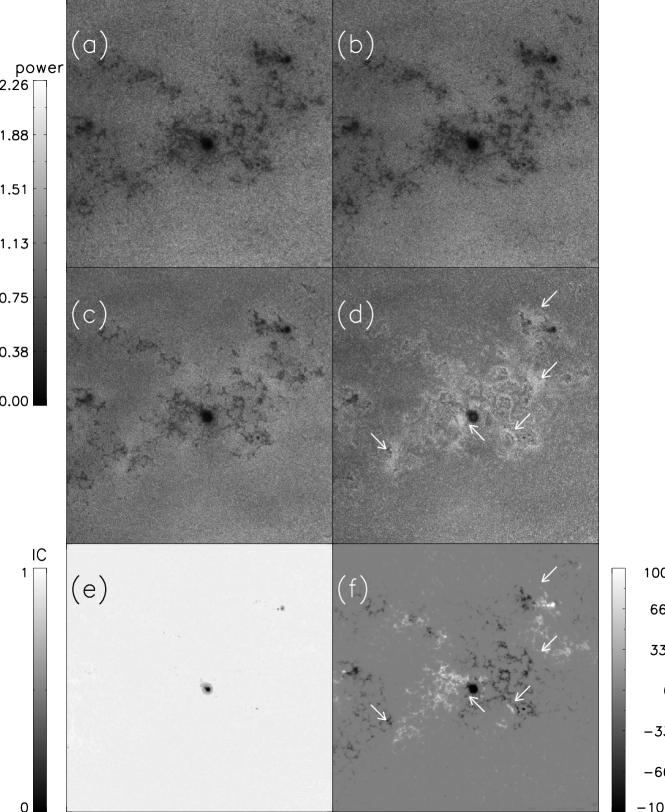

Figure \irefvecmag shows the vector magnetic field, (a) , (b) and (c) derived from the line-of-sight observations in Figure \irefacpow9787 (f). From these maps we made scatter plots of the acoustic power against the field inclination for each of the frequency bands shown in Figure \irefacpow9787. The field inclination, , is defined as where is the horizontal field strength and is the field parallel to the radial vector. Thus, purely horizontal field is defined when , when and when . Figure \irefscatp shows the results for (intermediate) magnetic field strength, G, over each of the four frequency bands centered at 3, 4, 5, and 6 mHz. For all frequency bands, there is a pronounced peak in power at . This is true for the lower frequencies, at which the power in the magnetic regions shows suppressed levels compared to the quiet-Sun, but is more pronounced at 5 mHz and 6 mHz. Acoustic power in these intermediate-strength magnetic pixels at 5 mHz can be either suppressed (in more vertical fields) or enhanced (in more horizontal fields), compared to the quiet-Sun. At 6 mHz all of these pixels show enhanced power.

Figure \irefBband shows the variation of acoustic power in the 6 mHz bandpass with inclination over a wider range of total magnetic field strength. For clarity, only the acoustic power, averaged over bins in comprising 1% of the total number of points, is shown for each magnetic field strength range. It is clear that the trend of increased power in horizontal fields is present for all ranges of field-strength shown, although the results become noisier at higher strengths due to poorer statistics. The greatest enhancement (50% above the quiet-Sun power) occurs for field strength between 300 and 400 G, and falls off with either greater or lesser strengths. There is a power suppression at the highest field strengths, occurring mostly in the sunspots.

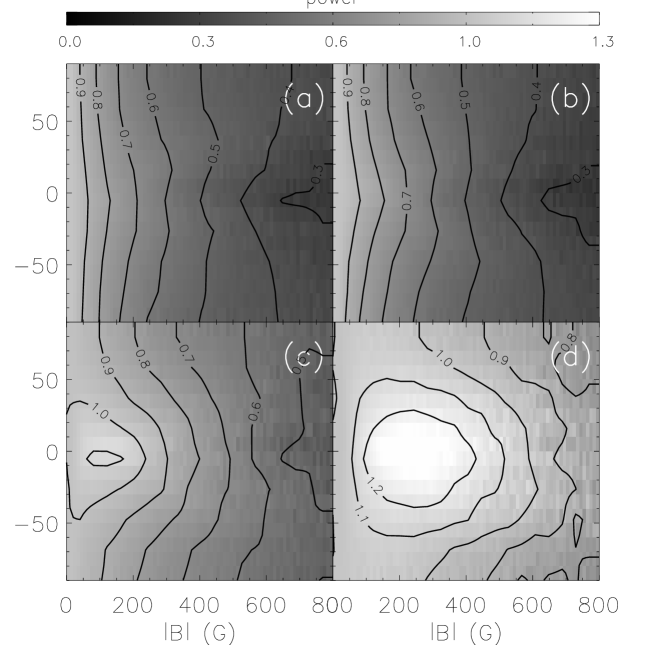
To visualise the dependence of the normalised power on both the field strength and inclination, we compute the average power in 10 G bins of field strength and bins of inclination. Figure \irefsquares1 shows the 2D distribution of the mean normalised power for 1 mHz bands centered on (a) 3 mHz, (b) 4 mHz, (c) 5 mHz and (d) 6 mHz. The distribution of enhanced power is symmetric about the horizontal field at 5 and 6 mHz, with most of the enhanced power occurring within a narrow range of inclination and field strength.
We explore the possibility that the functional dependence shown in Figure \irefsquares1 is sufficient to predict the appearance of the acoustic halo using only the extrapolated magnetic field components. Figure \irefcpm (left column) shows the reconstructed acoustic power maps using the magnetic field for 24 January 2002 (as shown in Figure \irefvecmag), and the 2D distributions illustrated in Figure \irefsquares1. The right column of Figure \irefcpm shows the actual normalised acoustic power map for 24 January 2002. Each row of Figure \irefcpm represents a different frequency band. The reconstruction is qualitatively successful with the correlation coefficient, , between the maps given on the right-hand-side. The correlation is best for low frequencies. Recall that these maps are created only for the magnetic field map of one day (24 January 2002) but using Figure \irefsquares1 which is an average of power over all seven of the observed days. Even so, the correlation coefficient for using power from the same day is very similar ( is 0.74, 0.73, 0.55, 0.53 for 3, 4, 5 and 6 mHz bands respectively). It therefore appears that the acoustic halo is largely a property of the local surface magnetic field.

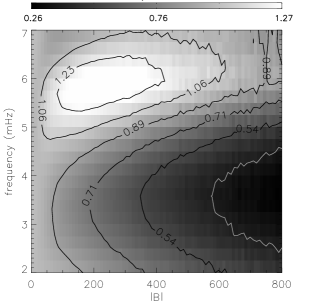
There is some indication from Figure \irefsquares1 that the peak in the mean normalised power at 6 mHz occurs at a higher field strength than the peak in the distribution at 5 mHz. To explore this variation further, we construct a new set of normalised acoustic power maps with narrower frequency bandpasses. From the symmetric properties of the acoustic power around we can comfortably work with . Figure \irefsquares_freq shows the mean acoustic power in 10 G bins of magnetic field and 0.1 mHz bins of frequency for (left) and (right). A clear trend of increasing peak frequency with is evident in both ranges of inclination. The well known suppression of power at 3–4 mHz, which is stronger at greater field strength, also shows up prominently in Figure \irefsquares_freq.

3 Wavenumber dependence
two
We now turn to examining the nature of the enhanced power oscillations in terms of changes in the frequency and wavenumber domain. To isolate the power spectra of the halo regions we apply spatial masks to the observations before performing a 3D Fourier transform. Since the power spectra are quite sensitive to the window function, or mask, it is necessary to compare the power spectra of observations of the halos with those of quiet-Sun using identical masks. Because of the large filling factor of the active regions in the 2002 January data this comparison nominally requires an additional 7 days of observations of predominantly quiet-Sun. This entails using additional MDI observations from a substantially quiet epoch. For the quiet-Sun comparisons used here, we chose observations (hereafter referred to as the “2003 observations”) from 24 to 27 July 2003 and 18 to 20 October 2003. We refer to the 7 days of data for the active period from 21 to 27 January 2002 as the “2002 observations”. We track and Postel-project the 2003 observations in an identical manner to the 2002 observations and then pair the 2002 and 2003 observations in days according to Table \ireftable1.
Unfortunately, focus changes in the MDI instrument were made between the 2002 and 2003 observations. In addition, the time span between the two datasets is substantial enough that possible solar cycle changes in mode properties could confuse our power spectra comparisons. Thus it is necessary to look for, and rule out, possible changes in the power spectra of the quiet-Sun over the same two epochs which might be due to either instrumental or solar causes. We therefore create two sets of masks; the first of which (called the “halo masks”) is intended to isolate the halo regions in the 2002 observations, and the second (“quiet-Sun masks”) is intended to isolate the quiet regions in the 2002 observations. An additional complication is that the 2003 observations also include magnetic regions which must be eliminated from the comparison. To do this, the halo masks for each pair of days include only pixels with G and in the 2002 observations and with G in the 2003 observations. The set of quiet-Sun masks is constructed for each pair of days from pixels with G in both the 2002 and 2003 observations. This excludes any magnetic pixels present in the 2003 observations, and ensures that the masks used for both sets of days are identical.
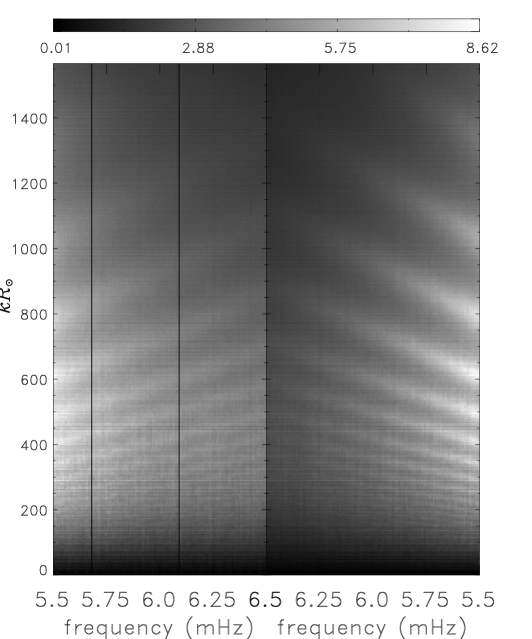
Using these masks we compute the azimuthally summed power spectrum for each pair of days. The 7-day average of the 2002 and 2003 spectra are shown in Figure \irefspectra. It is apparent that the power in the 2002 spectra of the halo regions is greater, and the ridges are more defined, than the spectra in 2003. Moreover, there appears to be a shift towards higher in the mode ridges in the halo power spectra which is particularly visible at higher temporal frequency.
To show this more clearly, we plot cuts through the spectra in Figure \irefpcuts at 6.3 mHz (panel a) and at 5.9 mHz (panel b), as indicated by the vertical lines in the power spectra (Figure \irefspectra). To facilitate the comparison at 5.9 mHz the quiet-Sun cut has been multiplied by a factor of 1.21. From these plots it is clear that there is a shift of the ridges in the 2002 halo-masked power spectrum to higher .
| 2002 obs | Jan | 21 | 22 | 23 | 24 | 25 | 26 | 27 | |
| 2003 obs | Jul | 24 | 25 | 26 | 27 | Oct | 18 | 19 | 20 |

Similar shifts of the ridges between the 2002 and 2003 quiet-Sun regions, if present, would indicate some artifact or other effect which is not unique to the halos. Figure \irefqscuts shows cuts through the power spectra obtained with the quiet-Sun masks. It is apparent that some differences in the magnitude and distribution of power, but not frequency shifts, between the two epochs are observed. The former is not unexpected given the known focus changes between the two epochs. However, it is clear that we do not see a shift in the position of the ridge peaks at constant frequency as is seen in Figure \irefpcuts. This strengthens the likelihood of real differences in the modal properties between halo and quiet regions.

4 Discussion
discussion We find properties of the acoustic halo that confirm prior analyses, but also discover several heretofore unknown properties. The halos are locations of acoustic power increase up to 140% of the quiet-Sun value at higher frequencies and are strongest at intermediate magnetic field strength (150 to 350 G). These results are in general agreement with previous studies [Jain and Haber (2002), Hindman and Brown (1998)]. We have discovered a clear association with near horizontal () magnetic field. The dependence of acoustic amplitude on field inclination occurs over frequencies between 2.5 and 6.5 mHz, and for field strengths between 100 and 800 gauss, but is particularly strong between 5 and 6.5 mHz and at the aforementioned intermediate field strengths. In addition, we show that the frequency of the peak enhancement depends on the field strength, with the peak frequency increasing slightly with field strength, and that in these regions of enhanced power the ridges of the acoustic power spectrum are shifted towards higher . Qualitatively there appears to be a larger shift for higher indicating that this is a shallow surface effect. For constant the phase speed of the ridge is reduced, indicating an increase in travel times, that could be caused by either a slower wave speed or a longer path distance.
Any theory attempting to explain the acoustic halo or fully explain the interacation of waves with the magnetic field needs to incorporate these properties. A quantitative study of changes in the power spectrum requires a much more in depth analysis than our rudimentary study discussed here since, amongst other things, we have made no attempt to remove or account for distortions due to foreshortening and projection effects from the power spectra. On the other hand, we are confident through the multiple comparisons performed here with different masks and solar regions that the ridge shifts are qualitatively real and are clearly associated with the halo regions.
Various authors have pointed to a few different mechanisms to explain the halo. Some of the original discovery papers suggested enhanced acoustic emission [Braun et al. (1992b), Brown et al. (1992)]. More recently, \inlineciteJKWM08 have studied the effects of vertical magnetic fields on solar convection. The convection occurs on smaller scales and higher frequencies than in quiet-Sun regions, and shifts the oscillation power to higher frequencies. It is not as yet understood whether these properties are dependent upon the inclination of the field. However, the lack of halos in continuum observations [Hindman and Brown (1998)] and the relative lack of association with emission sites, as identified with seismic holography analyses sensitive to propagating waves [Donea, Lindsey, and Braun (2000)] casts doubt on this interpretation.
Hanasoge:2008p816 claims that halos may be more likely related to scattering effects. Roughly in agreement with the findings in this paper, he also sees the halo as being confined to magnetic field inclinations and an increase of energy in the higher wavenumber regime. \inlineciteKC2009 propose that high-frequency fast mode waves refracted in the higher atmosphere due to a rapid increase in the Alfvén speed are responsible for the seismic halos. They get a 40-50% increase in power of high frequency vertical velocity in regions of intermediate field strength, although, like \inlineciteHanasoge:2008p816, they find that the horizontal velocity component of the halo is stronger. However, it is difficult to completely reconcile the observations with these simulations, since the latter show only a weak halo being generated in the vertical velocity component (up to a maximum of 5%) and the strongest enhancement (up to 35%) being generated in the horizontal velocity component. If the halo were strongest in horizontal velocities there would be a line-of-sight dependence with the halo power being stronger at larger heliocentric distance. This has not as yet been observed.
Kuridze:2008p578 suggests this enhanced power is caused by high frequency waves trapped beneath the bipolar magnetic canopy. The low frequency waves are reflected below the photosphere and so are not trapped. In regions of open field, the high frequency waves are permitted to propagate upwards and are lost to the atmosphere. These field free cavities have granular dimensions ( Mm), but with SOHO/MDI we must be observing many of these cavities within the resolution which is three times this size, and these cavities must be widely distributed to cover the area of the halo regions. A somewhat similar idea is put forth by \inlineciteMHS05. They suggest that the lack of haloes in the TRACE observations [Muglach (2003)] caused by reflections (and mode conversion) due to an overlying inclined magnetic field.
Simoniello:2009 have studied Sun-as-a-star oscillations and observe enhanced power in high frequency (5.7-6.3 mHz) bands, up to 18%, at solar maximum. We believe that this is due to a large surface of the Sun being covered by plage and the associated enhanced power, as presented in this paper, associated with the increased magnetic activity.
Understanding the properties of surface acoustic power is important in modeling helioseismic signatures due to subsurface perturbations. It has also been suggested that acoustic power be used as a predictive tool to forecast the emergence of active regions [Hartlep et al. (2009)]. The results shown here, namely that the surface acoustic power is a strong function of the local magnetic field properties, may be useful in the removal of surface contributions from acoustic power maps and as a part of a correction to local helioseismic methods (e.g. \inlineciteLB05,\inlineciteCR07).
At this point, we cannot confidently suggest a mechanism explaining all the properties of the acoustic halo. However, a more detailed analyses of the characteristics of the acoustic halo will likely help to pin-point the mechanism behind the acoustic halos. The recently launched Solar Dynamics Observatory hosts the Helioseismic and Magnetic Imager instrument which has a resolution four times better than SOHO/MDI and, along side improvements in numerical modeling, may be able to help resolve the nature of acoustic halos.
\acknowledgementsname
We would like to thank Aaron Birch and Ashley Crouch for helpful comments on the manuscript. HS is supported by the European Helio- and Asteroseismology Network (HELAS), a major international collaboration funded by the European Commission’s Sixth Framework Programme. DCB is supported by NASA contracts NNG07EI51C and NNH09CE41C and NSF grant AST-0406225.
References
- Braun et al. (1992a) Braun, D.C., Lindsey, C., Fan, Y., Jefferies, S.M.: 1992a, Local acoustic diagnostics of the solar interior. ApJ 392, 739. doi:10.1086/171477.
- Braun et al. (1992b) Braun, D.C., Duvall, T.L. Jr., Labonte, B.J., Jefferies, S.M., Harvey, J.W., Pomerantz, M.A.: 1992b, Scattering of p-modes by a sunspot. ApJ 391, L113.
- Brown et al. (1992) Brown, T.M., Bogdan, T.J., Lites, B.W., Thomas, J.H.: 1992, Localized sources of propagating acoustic waves in the solar photosphere. ApJ 394, L65. doi:10.1086/186473.
- Cameron, Gizon, and Duvall (2008) Cameron, R., Gizon, L., Duvall, T.L. Jr.: 2008, Helioseismology of Sunspots: Confronting Observations with Three-Dimensional MHD Simulations of Wave Propagation. Sol. Phys. 251, 291. doi:10.1007/s11207-008-9148-1.
- Couvidat and Rajaguru (2007) Couvidat, S., Rajaguru, S.P.: 2007, Contamination by Surface Effects of Time-Distance Helioseismic Inversions for Sound Speed beneath Sunspots. ApJ 661, 558. doi:10.1086/515436.
- Donea, Lindsey, and Braun (2000) Donea, A.C., Lindsey, C., Braun, D.C.: 2000, Stochastic seismic emission from acoustic glories and the quiet sun. Sol Phys 192, 321.
- Finsterle et al. (2004) Finsterle, W., Jefferies, S.M., Cacciani, A., Rapex, P., McIntosh, S.W.: 2004, Helioseismic Mapping of the Magnetic Canopy in the Solar Chromosphere. ApJ 613, L185. doi:10.1086/424996.
- Gizon et al. (2009) Gizon, L., Schunker, H., Baldner, C.S., Basu, S., Birch, A.C., Bogart, R.S., Braun, D.C., Cameron, R., Duvall, T.L., Hanasoge, S.M., Jackiewicz, J., Roth, M., Stahn, T., Thompson, M.J., Zharkov, S.: 2009, Helioseismology of sunspots: A case study of noaa region 9787. Space Science Reviews 144, 249. (c) 2009: The Author(s).
- Hanasoge (2008) Hanasoge, S.M.: 2008, Seismic halos around active regions: A magnetohydrodynamic theory. The Astrophysical Journal 680, 1457. (c) 2008: The American Astronomical Society. doi:10.1086/587934.
- Hartlep et al. (2009) Hartlep, T., Kosovichev, A.G., Zhao, J., Mansour, N.N.: 2009, Signatures of emerging subsurface structures in the sun. ArXiv e-prints.
- Hindman and Brown (1998) Hindman, B.W., Brown, T.M.: 1998, Acoustic power maps of solar active regions. Astrophysical Journal v.504 504, 1029. doi:10.1086/306128.
- Jacoutot et al. (2008) Jacoutot, L., Kosovichev, A.G., Wray, A., Mansour, N.N.: 2008, Realistic Numerical Simulations of Solar Convection and Oscillations in Magnetic Regions. ApJ 684, L51. doi:10.1086/592042.
- Jain and Haber (2002) Jain, R., Haber, D.: 2002, Solar p-modes and surface magnetic fields: Is there an acoustic emission?. MDI/SOHO observations. A&A 387, 1092.
- Khomenko and Collados (2006) Khomenko, E., Collados, M.: 2006, Numerical Modeling of Magnetohydrodynamic Wave Propagation and Refraction in Sunspots. ApJ 653, 739. doi:10.1086/507760.
- Khomenko and Collados (2009) Khomenko, E., Collados, M.: 2009, Sunspot seismic halos generated by fast MHD wave refraction. ArXiv e-prints.
- Kuridze et al. (2008) Kuridze, D., Zaqarashvili, T.V., Shergelashvili, B.M., Poedts, S.: 2008, Acoustic oscillations in a field-free cavity under solar small-scale bipolar magnetic canopy. Annales Geophysicae 26, 2983.
- Ladenkov et al. (2002) Ladenkov, O.V., Hill, F., Egamberdiev, S.A., Chou, D.Y.: 2002, Acoustic power mapping for active regions from mdi, hlh, and ton data. Astronomy Letters 28, 411. doi:10.1134/1.1484142.
- Lindsey and Braun (2005) Lindsey, C., Braun, D.C.: 2005, The Acoustic Showerglass. I. Seismic Diagnostics of Photospheric Magnetic Fields. ApJ 620, 1107. doi:10.1086/426065.
- Muglach (2003) Muglach, K.: 2003, Dynamics of solar active regions. I. Photospheric and chromospheric oscillations observed with TRACE. A&A 401, 685. doi:10.1051/0004-6361:20021901.
- Muglach, Hofmann, and Staude (2005) Muglach, K., Hofmann, A., Staude, J.: 2005, Dynamics of solar active regions. II. Oscillations observed with MDI and their relation to the magnetic field topology. A&A 437, 1055. doi:10.1051/0004-6361:20041164.
- Parchevsky and Kosovichev (2007) Parchevsky, K.V., Kosovichev, A.G.: 2007, Three-dimensional Numerical Simulations of the Acoustic Wave Field in the Upper Convection Zone of the Sun. ApJ 666, 547. doi:10.1086/520108.
- Rempel, Schüssler, and Knölker (2009) Rempel, M., Schüssler, M., Knölker, M.: 2009, Radiative Magnetohydrodynamic Simulation of Sunspot Structure. ApJ 691, 640. doi:10.1088/0004-637X/691/1/640.
- Sakurai (1982) Sakurai, T.: 1982, Green’s Function Methods for Potential Magnetic Fields. Sol. Phys. 76, 301. doi:10.1007/BF00170988.
- Scherrer et al. (1995) Scherrer, P.H., Bogart, R.S., Bush, R.I., Hoeksema, J.T., Kosovichev, A.G., Schou, J., Rosenberg, W., Springer, L., Tarbell, T.D., Title, A., Wolfson, C.J., Zayer, I., MDI Engineering Team: 1995, The Solar Oscillations Investigation - Michelson Doppler Imager. Sol. Phys. 162, 129.
- Shelyag, Erdélyi, and Thompson (2006) Shelyag, S., Erdélyi, R., Thompson, M.J.: 2006, Forward Modeling of Acoustic Wave Propagation in the Quiet Solar Subphotosphere. ApJ 651, 576. doi:10.1086/507463.
- Simoniello et al. (2009) Simoniello, R., Finsterle, W., Garcia, R.A., Salabert, D., Jimenez, A.: 2009, Evidence of increasing acoustic emissivity at high frequency with solar cycle 23 in Sun-as-a-star observations. ArXiv e-prints.
- Toner and Labonte (1993) Toner, C.G., Labonte, B.J.: 1993, Direct Mapping of Solar Acoustic Power. ApJ 415, 847. doi:10.1086/173206.
- Wiegelmann et al. (2005) Wiegelmann, T., Lagg, A., Solanki, S.K., Inhester, B., Woch, J.: 2005, Comparing magnetic field extrapolations with measurements of magnetic loops. A&A 433, 701. doi:10.1051/0004-6361:20042421.