Observation of isomeric decays and the high spin states in doubly-odd 208Fr
Abstract
Neutron deficient isotopes of Francium (=87, ) as excited nuclei were produced in the fusion-evaporation reaction: 197Au (16O, ) 213-xFr at 100 MeV. The rays from the residues were observed through the high sensitivity Germanium Clover detector array INGA. The decay of the high spin states and the isomeric states of the doubly-odd 208Fr nuclei, identified from the known sequence of ground state transitions, were observed. The half lives of the 194(2) keV isomeric transition, known from earlier observations, was measured to be 233(18) ns. A second isomeric transition at 383(2) keV and 33(7) ns was also found. The measured half lives were compared with the corresponding single particle estimates, based on a the level scheme obtained from the experiment.
keywords:
PACS:
21.10.Tg , 23.20.Lv , 23.35.+g , 27.80.w1 Introduction
Investigation on the nuclear structure of the trans-Lead neutron deficient nuclei (, ) have attracted much attention in recent years[1, 2, 3]. For many of these nuclei, only the ground state spin and parity are known from their -factor/magnetic moment measurements, and perhaps a few low lying excited states are observed so far. The major difficulties in populating the high spin states in these nuclei are: a) very low cross sections for the formation of evaporation residues (ER), and b) very high probability of fission, which removes flux from the ER channel and prevents the excited nucleus from sustaining large angular momenta needed to populate the high spin states.
Experimental investigation of the high spin states of quite a few trans-Lead neutron deficient nuclei have been of interest recently. A series of investigations on the 211-214Fr isotopes[4, 5] showed that the structure can be interpreted in terms of the shell model states, and the excited states reveal an interplay between the protons in the states and the neutron holes in the orbitals, or the neutrons promoted to the high spin orbitals by core excitation, leading to the generation of high spin states. One of the major interests in the spectroscopic investigation of these nuclei is the role played by the shell in creating isomeric levels which decay through transitions of higher multipolarity or are hindered by the close proximity of the levels below.
A few spectroscopic investigations on the proton rich lighter Francium isotopes have been made recently. While a complete study of the 205-207Fr nuclei[1], using Gammasphere and the HERCULES II array for filtering out the evaporation residues from the fission background, revealed the existence of shears band in 207Fr (), investigations on the 208-210Fr nuclei[2, 3] have resulted in contradictory conclusions. Spectroscopic studies made using the YRAST BALL array, comprising six Compton suppressed Clover HPGe detectors[2], coupled to the SASSYER recoil separator[6] for selecting the evaporation residues had concluded that the pair of intense gamma rays of 632 keV (ground state transition) and 194 keV (isomeric transition) belong to 209Fr. The half life of the isomeric transition was measured to be 446(14) ns. At the same time, another independent study of isomeric decay of proton rich nuclei produced by projectile fragmentation reaction of 238U beam at 900 MeV/u on 9Be target at the Fragment Recoil Separator (FRS) facility of GSI, Darmstadt, Germany had assigned the same pair of gamma rays to 208Fr[3]. Clean isotopic and isobaric resolution of nuclei, which have low lying isomers with half lives 100 ns, are routinely achieved using this facility[7]. Half life of the 194 keV isomeric transition was reported to be ns, though the prompt transitions above the isomer could not be observed because of experimental constraints. This paper reports investigation of the isomeric transitions in 208Fr, along with the high spin states above the isomers. It is noteworthy to report here that at the time of final phase of data analysis and preparation of the manuscript, a paper on assignments of levels in 208Fr was published by G. D. Dracoulis et al.[8]. The differences in our methods, the results of observations on the isomeric transitions, new transitions over and above those reported therein, and the basis for our assignments of the isomeric transitions to 208Fr are highlighted in this paper.
2 Experiment and data analysis
The experiment to produce 208Fr was carried out at the Inter-University Accelerator Centre (IUAC), New Delhi. The Fr isotopes were produced by bombarding a 3.5 mg.cm-2 self-supporting Gold (99.95% purity) target with 16O beam at 88, 94 and 100 MeV. The nuclei of interest were produced as evaporation residues (ER) through (16O, ) reactions. The target thickness was chosen on the basis of energy loss calculations based on SRIM2003[9] to stop more than 90% of the ER within the target, and allow most of the fission fragments to fly away from it. Estimation of cross sections, angular distributions of the evaporation residues (ER) and the fission yield were done using the code PACE[10]. Based on these calculations, % of the fusion products at these bombarding energies undergo fission, which causes a huge background. Therefore, an effective filter to clean up the spectra, and / or good statistics are essential for extraction of meaningful results, as were done recently[1]. In the absence of such filters, use of large gamma detector arrays with high resolving power, good efficiencies for and coincidence events, along with additional measurements of excitation functions from in-beam and off-beam measurements yielding consistent results, have been utilized in our attempt to resolve the ambiguity.

The -rays produced were detected by the Indian National Gamma Array (INGA) consisting of 18 Compton suppressed Clover Germanium detectors placed around the target[11] at the INGA-HYRA beam line of the IUAC, New Delhi. Four Clover detectors were placed at , six at , four at , and four at for facilitating measurement of directional correlation from oriented states (DCO) ratios. The linear signals, along with the anti-coincidence logic and the trigger signals, were processed through the indigenously developed Clover electronics modules dedicated for the INGA set-up[12]. Since the measurement of half lives of the isomeric states is crucial for the experiment, time to digital converters (TDC) were used with stop signals from the individual Clover units and common start signal from the master trigger which can be chosen to select 2-fold or higher fold events. Range of the TDC was set to 400 ns for the exclusion of delayed -rays possibly coming from - and decays. Altogether two-fold and three-fold coincidences were recorded in 50 hours at 100 MeV beam energy, and 20% of above numbers were obtained at 88 and 94 MeV. In order to identify and measure the yield of the ER nuclei from their known and decay modes, data were taken in the multiscaling mode during the beam-off condition between the runs. All the on-line and off-line data were collected using the CAMAC-based CANDLE data acquisition system[13], and were analysed off-line using CANDLE, INGASORT[14] and RADWARE[15] analysis softwares.
Data analyses were done in several steps. For the excitation function measurements, coincidence matrices were generated from the 2-fold data collected at the three different energies. Yields for the intense -rays, normalized by the current integrator readings recorded at the beam dump during the excitation function runs, were obtained from the Francium and x-ray gated projections of the symmetrized matrices for each energy. The gated spectra are shown in the Fig. 1, where the intense -rays of 208Fr and 209Fr are indicated. The 724 keV -ray is present in both the nuclei, and hence could not be resolved in the experiment. Since its intensity is stronger in the decay of 209Fr levels, the excitation function shows the energy dependence typical of 209Fr. The trends of the excitation functions graphs for 208Fr and 209Fr, shown in the Fig. 2 are comparable to that predicted from the PACE calculations, though it overestimates the 208Fr yield and underestimates the 209Fr yield at 100 MeV. The 210Fr yield could not be measured even at the two lower energies as the corresponding characteristic -rays are not known.
The relative yields of the Fr isotopes () at the three different energies were also obtained from the radioactive decay runs taken in the beam-off condition. The time stamps in the list data blocks were used to generate the time marker. The vs. time matrices were generated using the CANDLE analysis software from which, the spectra at different time windows were generated. The decay curves for the intense characteristic rays belonging to the decay branches of these nuclei were obtained. A few decay curves are shown in the Fig. 3. The ERs decay via their well known and decay
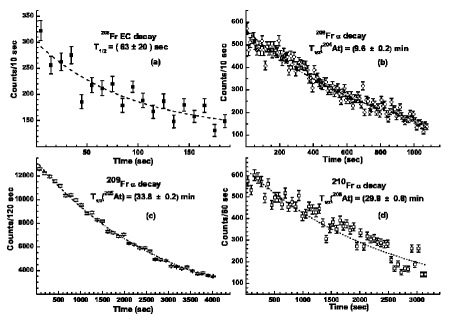
branches, with half lives which are well documented for these nuclei. The half lives , obtained by fitting the equation: for different decay branches observed in this experiment, are enlisted in the Table 1. The results show reasonably good agreement with the reference values quoted in the NNDC database[16, 17, 18, 19, 20, 21]. Relative yields of different ERs at the beginning of beam-off runs, were extracted from the fitted values, measured half lives and the branching fractions of the different decay branches. The relative yields, obtained from our data for the Fr isotopes, are shown in the Table 1. The major contribution to the uncertainties () quoted in the relative yields is from the fluctuation in the beam current before the beginning of the beam-off runs, which were monitored during the analysis, and the rest from the exponential fit to the data. The results are in reasonable agreement with the measured excitation functions of Fig. 2, which agrees with the assignment of the 826 keV isomeric level and the corresponding gamma transitions to 208Fr, rather than to 209Fr[2], in agreement with the conclusions of Refs. [3, 8].
| ER | Decay branch | Yield | Yield | Yield | |||
|---|---|---|---|---|---|---|---|
| (This expt) | (keV) | (88 MeV) | (94 MeV) | (100 MeV) | |||
| 208Fr | 208Fr 208Rn (11%) | 59.1(3) sec[16] | 63(20) sec | 635.8 | |||
| 208Fr 204At (89%) | |||||||
| 204At 204Po (96%) | 9.2(2) min[17] | 9.6(2) min | 516.3 | 0 | 0.14(1) | 0.46(8) | |
| 209Fr | 209Fr 209Rn (11%) | 50.0(3) sec[18] | |||||
| 209Fr 205At (89%) | |||||||
| 205At 205Po (90%) | 26.9(8) min[19] | 33.8(2) min | 719.3 | 1.0(2) | 1.00(5) | 1.0(3) | |
| 210Fr | 210Fr 210Rn (40%) | 3.18(6) min[20] | 3.4(2) min | 643.8 | |||
| 210Fr 206At (60%) | |||||||
| 206At 206Po (99%) | 30.0(8) min[21] | 29.9(6) min | 700.7 | 0.35(5) | 0.18(1) | 0.37(7) |
From the online data taken at 100 MeV beam energy, the matrices, Francium -ray gated matrices, the prompt and the delayed matrices and the -gated matrices were constructed for establishing the level scheme and resolving the isomeric transitions. From the first two sets of matrices and by gating on the strongest 632 keV ground state transition and the intense 194 keV transition, the -transitions belonging to 208Fr were clearly established. These transitions, observed at 100 MeV beam energy, are shown in the Table 2. The relative intensities given in the table were obtained from the 632 keV gated spectra. Because of the existence of low lying isomer with half lives ns, and also due to the large internal conversion of some of the levels, the intensity balance across the isomeric levels could only approximately be done.
| (gate) | Multipolarity | |||||
| (keV) | (keV) | (keV) | (keV) | |||
| 110.0(20)a | 11.00(45) | 4077 | 3967 | |||
| 115.8(20)a | 7.58(31) | 3967 | 3851 | |||
| 122.7(18)a | 17.9(13) | 3851 | 3728 | |||
| 123.2(14)a | 8.6(10) | 2262 | 2139 | |||
| 150.2(17)a | 8.3(17) | 3856 | 3706 | |||
| 156.4(17)a | 13.4(18) | 2139 | 1983 | |||
| 160.1(17) | 9.9(25) | 4070 | 3910 | 1.26(59) | 303(M1) | M1 |
| 181.8(18)a | 11.6(19) | 3910 | 3728 | 1.20(39) | 303(M1) | M1 |
| 194.1(18) | 818(12) | 826 | 632 | 0.99(6) | 632(E2) | E1 |
| 209.7(19)a | 8.70(79) | 2763 | 2553 | 303(M1) | E2 | |
| 232.4(18) | 15.9(13) | 4325 | 4093 | 1.93(80) | 569(E2) | M1 |
| 238.2(18) | 38.8(16) | 4093 | 3855 | 1.74(32) | 569(E2) | M1 |
| 268.5(14)a | 15.4(20) | 1983 | 1715 | |||
| 284.6(15)a | 5.0(16) | 3048 | 2763 | 303(M1) | E2 | |
| 288.1(18) | 11.39(4) | 2246 | 1958 | 569(E2) | M1 | |
| 290.9(15)a | 3.8(13) | 2553 | 2262 | 303(M1) | E2 | |
| 298.8(19) | 17.1(28) | 2133 | 1834 | 1.04(13) | 303(M1) | M1 |
| 303.1(19) | 26.8(35) | 1512 | 1209 | 2.1(6) | 632(E2) | M1 |
| 313.1(17)a | 3.9(12) | 3728 | 3415 | 303(M1) | (E2) | |
| 321.8(22) | 24.8(12) | 1834 | 1512 | 1.02(18) | 303(M1) | M1 |
| 359.3(21) | 67.6(41) | 1715 | 1356 | 1.03(21) | 632(E2) | E2 |
| 365.4(16)a | 4.5(12) | 2633 | 2268 | |||
| 382.9(18)a | 7.13(90) | 1209 | 826 | 0.60(17) | 322(M1) | E2 |
| 404.8(19) | 64.9(39) | 1800 | 1395 | 0.92(12) | 569(E2) | M1/E1 |
| 410.7(13)a | 8.45(76) | 3415 | 3004 | 303(M1) | (E2) | |
| 428.3(15)a | 7.0(13) | 2262 | 1834 | 0.50(34) | 303(M1) | E2 |
| 467.8(21)a | 9.61(41) | 2268 | 1800 | 0.8(4) | 405(M1/E1) | M1/E1 |
| 498.6(13)a | 4.5(12) | 3706 | 3207 | |||
| 510.2(22) | 40.6(33) | 3190 | 2680 | 569(E2) | M1 | |
| 563.5(24) | 88.4(45) | 1958 | 1395 | 1.85(44) | 632(E2) | M1 |
| 566.2(24)a | 27.1(38) | 5487 | 4921 | 0.44(17) | 563(M1) | E2 |
| 569.4(24) | 197.7(62) | 1395 | 826 | 0.89(9) | 632(E2) | E2 |
| 596.2(24)a | 38.5(47) | 4921 | 4325 | 2.0(8) | 632(E2) | M1 |
| 603.6(26)a | 12.3(26) | 3207 | 2603 | |||
| 632.2(19) | 1000 | 632 | 0 | E2 | ||
| 645.3(19)a | 8.9(31) | 2603 | 1958 | 0.6(4) | 563 (M1) | (E1/M1) () |
| 665.1(20)a | 11.7(47) | 3855 | 3190 | 1.05(37) | 563(M1) | M1 |
| 721.6(23)a | 21.0(38) | 2680 | 1958 | 1.0(6) | 563(M1) | M1 |
| 723.9(23) | 160.30(46) | 1356 | 632 | 1.14(11) | 632(E2) | E2 |
| 742.0(23) | 32.2(13) | 3004 | 2262 | 0.56(23) | 303(M1) | E2 |
| 774.6(18) | 5.28(2) | 2169 | 1395 | 569(E2) | (E2) | |
| 880.2(16) | 7.26(2) | 2680 | 1800 | 569(E2) | (E2) | |
| 955.8(16)a | 3.6(11) | 4004 | 3048 | 0.49(24) | 303(M1) | (E2) |
The observed -rays and their relative intensities match reasonably well with those obtained recently by Dracoulis et al.[8]. However, quite a few additional -transitions were observed and indicated in the table. A directional correlation of oriented nuclei (DCO) analysis was also performed with the data taken at and angle pairs. The gating transitions and their multipolarities used for DCO ratio calculations are shown in the Table 2. These assignments match with those obtained in Ref. [8].
Based on the intensity correlations obtained from our gated spectra, and also from the DCO ratio measurements, the level scheme for 208Fr was established as shown in the Figure 4.

Apart from one sequence of transitions (I) passing through 359 and 724 keV, which directly feeds the 632 keV first excited state, two major sequences (III and V) and three minor sequences (II, IV and VI) of transitions, which pass through the isomeric 826 keV level, have been observed. A few relevant gated spectra are shown in the Figs. 5 and 6. Out of these, three sequences (II, III and IV) of transitions pass through the strong 569 keV transition, and two (V and VI) through the sequence of 303 and 322 keV transitions. In all the major sequences, ordering of the transitions are cross-checked by intensity correlations and also by reverse gating.

About 25 new transitions, over and above those observed by Dracoulis et al.[8], were found, as noted in the Table 2. The 722 keV transition in sequence III falls on the tail of the much stronger 724 keV transition of sequence I, and could only be observed in the 238 and 569 keV gates, as shown in the Fig. 6, except for a small contamination at 725 keV in the 569 keV gate, possibly coming from 198Au produced by neutron transfer reaction. The 725 keV contamination was also present in the 194 keV gated spectrum for the same reason mentioned above. The 724 keV contamination line was not found in the 563 keV gate. The contamination from the 724 keV transition is much more severe as it also belongs to 209Fr. Similarly, the 510 keV -ray is also a new line, which was observed consistently in the coincident gates of sequence III transitions. It was placed in the level scheme just above the 722 keV transition, based on the observed intensities in various forward and reverse gates. The 665-510-722 keV sequence in III is bypassed by the 150-499-604-645 keV sequence II transitions which is evident from the 645 keV gated spectrum of Fig. 5 b. The 665 keV and the 150 keV transitions are weak in intensity and allow only an approximate intensity balance. The sequence I was known up to 359 keV[8], which was extended with the 123-156-268 keV transitions observed by overlapping the 632,724 and 359 keV gated spectra (see Fig. 5a). The sequence IV transitions pass through 569 keV but they bypass the 563 keV and 722 keV transitions and hence were placed accordingly. The 880 keV transition, which was also shown in Ref. [8], was absent in 365 and 468 keV gates, but present in the 405 keV gate. Hence it was placed to directly feed the 1800 keV level. By matching the sum energies of the relevant transitions in IV, a 47 keV transition was placed just below the 2680 keV level. This, perhaps, could not be identified due to the absorbers placed in front of the Clover detectors.
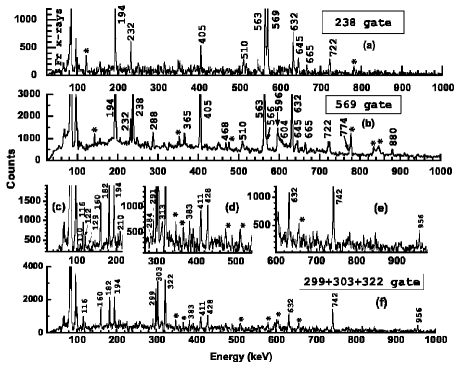
For the sequence V and VI, several new transitions were found and the relative ordering was modified over the level scheme shown in Ref. [8]. 210, 284, 291 and 956 keV lines were observed for the first time in the 299, 303 and 322 keV gates (see Fig. 6a), but absent from the 742 keV gate. This makes the placement of 742 keV above the 299-303-322 keV sequence. Further, the 428 keV line was present in the 303, 322 and 742 keV gates but absent in the 299 keV gate. This was also confirmed by reverse gating on 428 keV. The 129 keV line, though weak possibly because of internal conversion, was present in 299, 303 and 322 keV gates but absent in the 428 keV gate, which makes its placement sequential to 299 keV but parallel to 428 keV. The -rays coming from the levels above 3004 keV in sequence V were observed for the first time, except for the 160 keV transition which has already been reported[8]. A new 383 keV feeding transition to 826 keV level along the sequence V was found. Justification for its placement is given below.
One of the major point of controversy is the life time of the 826 keV isomeric level, which has been measured by several workers[2, 3, 8], and the existence of other isomers in 208Fr. A systematic search for isomeric transitions were done from our data and the half lives were extracted. The spectral measurements covered a ns TDC range, but an useful range of ns could be utilized due to delay matching of the detector array. Typical spectra gated by 632 keV are shown in the Fig. 7. From the 194 keV and 632 keV -gated coincidence matrices, we have projected the gated spectra for the 569 keV, 563 keV, 299 keV, 303 keV, 322 keV and 742 keV gated transitions. The spectra for the first two gated transitions are found to be similar in nature. This clearly establishes the fact that 563 and 569 keV transitions are in sequence and above the 826 keV isomeric level. The combined spectrum for the keV as start and 632 keV as stop are shown in the Fig. 7(a). However, the spectra for the 299, 303, 322 and 742 keV as start and 194 or 632 keV as stop, though similar in nature among themselves, differ significantly from the previous ones (see Fig. 7(a,d)) in that the exponential decay is much faster indicating the existence of another faster isomeric transition above the 826 keV level. The gated spectra obtained for the gates between the pairs of -rays among the 299, 303, 322 and 742 keV, the 563 and 569 keV pair of -rays showed their prompt nature. By comparing the prompt and delayed gated spectra, taken for the sequence V transitions mentioned above, a new but weak 383 keV isomeric transition was found and it was placed just above the 826 keV level along the sequence V.

The half life of the 826 keV isomeric level was extracted by fitting exponential decay function to the spectra, shown in the Fig. 7(c). The results are given in the Table 3. Half life of ns was obtained, which is consistent with the result ns quoted in Ref. [3]. However, the result differs from that obtained recently by Dracoulis et al.[8]. Half life of the 1209 keV isomeric level was extracted from the spectra of Fig. 7(b), in a similar way. The result obtained is: ns. The same half life was extracted independently from the spectrum shown in Fig. 7(d), using two exponential decay fit and the measured half life of the 826 keV isomer mentioned above. The results were mutually consistent and the average of the two measurements is quoted in Table 3.
3 Interpretation of results
The difference in the measured values of the 826 keV isomer half life could not be explained. One of the draw back of the present measurement is the restricted range of . This could not be avoided in the experimental set up of the INGA array, which was optimized for prompt -spectroscopy. To find out the correctness of the present technique, half lives have been extracted for a number of isomeric transitions already known in several nuclei produced in our in-beam experiment. These are listed in the Table 3. The isomer half lives spanned from ns to ns. The results are found to be in good agreement with the earlier measurements, within the quoted uncertainties.
| Nucl. | Level | ML | (ns) | (ns) | |
|---|---|---|---|---|---|
| (keV) | (keV) | (This expt) | (Earlier) | ||
| 208Fr | 826 | 194.1 | E1 | 233(18) | 432(11)[8] |
| [3] | |||||
| 208Fr | 1209 | 382.9 | E2 | 33(7) | |
| 208Rn | 1828 | 88.7 | E2 | 590(144) | 509(14)[22] |
| 206At | 807 | 121.6 | E1 | 377(44) | 410(80)[23] |
| 813(21)[8] | |||||
| 204Po | 1639 | 12.1 | E2 | 161(4) | 158(2)[24] |
The half life for 206At was also reported in Ref. [8] as ns, which is almost twice that obtained earlier[23]. While the probable cause of this difference was cited as due to the restricted TDC range ns in the previous work, our result does not seem to agree with this conclusion. We get results which are consistent with earlier measurements, though the uncertainties are larger in case of larger half lives (eg. 208Rn[22]). The restricted range of TDC would result in poor statistics for fitting data, with consequent larger error bars, as manifested in our results.
The results of DCO ratio measurements are enlisted in the Table 2. These measurements are pivoted on the E2 assignment of the 632 keV ground state transition, which follows from the systematics in the neighbouring nuclei, including Francium isotopes. Based on our DCO results, E1 character was assigned to the 194 keV isomeric transition. The same transition was assigned E1() in Ref. [8]. However, both the assignments arise from the same configuration, with the only difference that the isomeric level would be placed higher than a state, as evident from the spin multiplets observed in 208Bi from the neutron pick-up reactions[25]. The state, arising out of the same configuration, is assigned to the next 1209 keV level, which is also an isomeric level decaying by 383 keV E2 transition. Based on the measured half life and the estimated internal conversion coefficient of 0.0723(11)[26], single particle strength of 0.0264(12) W. u. was obtained. For the isomeric transition of the 826 keV level, internal conversion coefficient of 0.0947(14) was estimated, and the corresponding single particle strength was obtained as W. u. Similar results for the E1, M1, E2 and M2 isomeric transitions are obtained in trans-Lead nuclei(eg. 208Rn[22]) in this mass region.
In the level scheme shown in Fig. 4, the series of levels from 632 keV () to 1983 keV () along sequence I arise from the with proton excitations of higher seniority leading to the generation of angular momenta. This is clear from the connecting sequence of E2 transitions. The maximum angular momentum generated from proton excitation in this case is , which leads to maximum for the given configuration. The 123 and 156 keV transitions above the 1983 keV level could be of E2 nature, though our data is inadequate to make a definite conclusion.
The sequence II transitions, observed for the first time, are weak in intensity but they are fitted into the level scheme from the matched sequence of -ray energies, coincidence conditions and intensities. However, the spin assignments of only the 2603 keV level could be done from the DCO ratio for the 645 keV transition by gating on 563 keV M1 transition. This could be a stretched E2 transition or a M1 transition, but the latter assignment was adopted to fix the spins of the level sequence. The 604 keV, 499 keV and 150 keV transitions appear to be M1 though it cannot be confirmed from our data. Sequence III transitions extend to the highest excitation energy of 208Fr in this experiment. It starts from the 1395 keV level which is connected by 569 keV E2 transition to the 826 keV level. This sequence is likely to arise from the configuration which leads to the highest spin of , and are connected by a series of M1 transitions. Though we could extend up to level, the absence of level is possibly because of the fact that it is pushed down by the residual proton particle neutron hole repulsive interaction, from where gamma transitions are hindered. A detailed shell model calculation will be needed to make a definite conclusion in this regard.
The low lying transitions of the sequences V and VI, extending up to 2763 keV level can be formed by configuration through proton excitation. However, levels above along sequence VI, built on proton excitation to the maximum proton spin of , are due to neutron hole excitation arising from , leading up to the maximum level observed. The series of E2 transitions above the 2262 keV level along the sequence V can be between levels generated by , which leads to a maximum . The levels above it are connected by M1 transitions which are probably generated by a different configuration. A better statistics and / or higher resolving power of the array will be needed to extend the level scheme further.
4 Conclusion
The level scheme of 208Fr was modified over the existing level scheme, and extended up to and MeV excitation energy using a high resolving power Clover detector array. A number of new -transitions were observed and their DCO ratios were measured. Based on search for isomeric transitions from the data using the tagged time difference technique, the half lives of several isomeric transitions in 208Fr and in a few neighbouring nuclei produced as ER in the experiment were measured. The results agree reasonably well with the previously known half lives. The half life of the known 194 keV isomeric transition in 208Fr was found to differ from the previously reported value. A new isomeric E2 transition was obtained and its half life was measured. The Weisskopf estimate of the single particle strength of the associated isomeric levels reveal similarity with the previous estimates in the neighbouring nuclei. From the shell model based interpretation of the level scheme, it is clear that the majority of the excited states are caused by proton excitations, and neutron hole excitations predominantly in and shells. The importance of neutron hole in generating the isomeric levels is clear from the present data. It may be noted that though we have observed only two isomer levels, there can be a few more such levels which could not be observed due to limted statistics in our data. A pulsed beam based experiment, coupled with such a high resolving power array will be needed to extend the study further.
5 Acknowledgement
We are grateful to all the colleagues of the INGA collaboration for their help during the experiment. Smooth running of the 16UD Pelletron accelerator and the INGA detector array at the IUAC, New Delhi by the staff therein are gratefully acknowledged.
References
- [1] D. J. Hartley et al. , Phys. Rev. C 78, 054319 (2008).
- [2] D. A. Mayer et al. , Phys. Rev. C 73, 024307 (2006).
- [3] Zs. Podolyak et al. , AIP Conf Proc 831, 114 (2006).
- [4] A. P. Byrne, G. D. Dracoulis, C. Fahlander, H. Hübel, and A. R. Poletti, A. E. Stuchbery, J. Gerl, R. F. Davie, and S. J. Poletti, Nucl. Phys. A 448, 137 (1986).
- [5] A. P. Byrne, G. J. Lane, G. D. Dracoulis, B. Fabricius, T. Kibédi, A. E. Stuchbery, A. M. Baxter, and K. J. Schiffer, Nucl. Phys. A 567, 445 (1994).
- [6] J. J. Ressler et al. , Nucl. Instr. and Meth. B 204, 141 (2003).
- [7] H. Geissel et al. , Nucl. Instr. and Meth. B 70, 286 (1992).
- [8] G. D. Dracoulis, P. M. Davidson, G. J. Lane, A. P. Byrne, T. Kibédi, P. Nieminen, A. N. Wilson, and H. Watanabe, Euro. Phys. Jour. A 40, 127 (2009).
- [9] James F. Ziegler, Nucl. Instr. Meth. B 219, 1027 (2004).
- [10] A. Gavron, Phys. Rev. C 21, 230 (1980).
- [11] S. Muralithar, et al., DAE Symp. on Nucl. Phys. 52, 595 (2007).
- [12] S. Venkataramanan, et al., DAE Symp. on Nucl. Phys. 45B, 424 (2002).
- [13] E. T. Subramaniam, Kusum Rani, B. P. Ajith Kumar and R. K. Bhowmik, Rev. Sci. Instr. 77, 096102 (2006).
- [14] R. K. Bhowmik, S. Muralithar and R. P. Singh, DAE Symp. on Nucl. Phys. 44B, 422 (2001).
- [15] D.C. Radford, Nucl. Instr. Meth. A 361, 297 (1995).
- [16] M. J. Martin, Nucl. Data Sheets 108, 1583 (2007).
- [17] M. R. Schmorak, Nucl. Data Sheets 72, 409 (1994).
- [18] M. J. Martin, Nucl. Data Sheets 63, 723 (1991).
- [19] F. G. Kondev, Nucl. Data Sheets 101, 521 (2004).
- [20] E. Browne, Nucl. Data Sheets 99, 649 (2003).
- [21] F. G. Kondev, Nucl. Data Sheets 109, 1527 (2008).
- [22] W. J. Triggs, A. R. Poletti, G. D. Dracoulis, C. Fahlander, and A. P. Byrne, Nucl. Phys. A 395, 274 (1983).
- [23] X. C. Feng, et al. , Eur. Phys. J. A 6, 235 (1999).
- [24] V. Rahkonnen and T. Lönnroth, Nucl. Phys. A 464, 349 (1989).
- [25] G. M. Crawley, E. Kashy, W. Lanford, and H. G. Blosser, Phys. Rev. C 8, 2477 (1973).
- [26] T. Kibédi, T.W. Burrows, M.B. Trzhaskovskaya, P.M. Davidson, C.W. Nestor Jr., Nucl. Instr. and Meth. A 589, 202 (2008).