CCD Photometry of the Pleiades Delta Scuti Star V650 Tauri
Abstract
The preliminary results of a three-site CCD photometric campaign are reported. The Scuti variable V650 Tauri belonging to the Pleiades cluster was observed photometrically for 14 days on three continents during 2008 November. An overall run of 164 hr of data was collected. At least five significant frequencies for V650 Tauri have been detected.
Keywords:
oscillations, Sct, photometry:
97.10.Sj1 Introduction
Scuti variables are stars with masses between 1.5 and 2.5 located at the intersection of the classical Cepheid instability strip with the main sequence. These variables are thought to be excellent laboratories for probing the internal structure of intermediate mass stars. Intents of modelling Scuti stars belonging to open clusters have been performed recently (e.g. [1], [2], [3]). Although the constraints imposed by the cluster parameters have proved to be very useful when modelling an ensemble of Scuti stars, more detected frequencies in individual stars would improve current seismic studies.
The target star V650 Tau (HD 23643, , A7) was identified as a short-period pulsating variable by Breger (1972). Intensive observations performed by the STEPHI network in November 1990, revealed four frequency peaks in V650 Tau [4]. One-site CCD photometric observations carried out by [5] in November-December 1993, confirmed the results obtained by the STEPHI campaign. Since then, no new observations of V650 Tauri have been performed.
The present paper provides preliminary observational results of a three-site campaign on V650 Tauri in 2008.
2 Observations and data reduction
Three observatories were involved in the observational campaign. They are listed in Table 1 together with the telescopes and instruments used. Table 2 gives the log of observations. A total amount of 164 hours of useful data were obtained from the three sites.
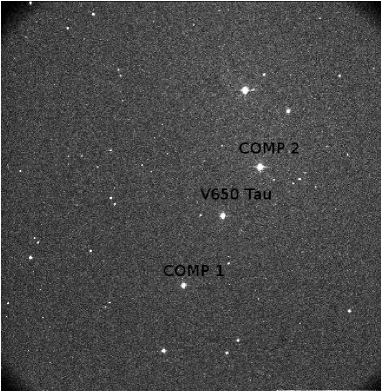
The observations were obtained through a Johnson filter except at the SPM observatory where a Strömgren filter was used. Table 3 shows the main observational parameters corresponding to the target and comparison stars as taken from the SIMBAD database operated by CDS (Centre de Données astronomique de Strasbourg). Two comparison stars have been used during the observations depending on the constraints set by the field of view of the CCD’s and sizes of the telescopes. The first one, HD 23605 (, F5), is a suitable comparison star considering its brightness and spectral type. However, this star could not be observed neither at Teide nor at San Pedro Martir observatory because it is so bright that at these telescopes the CCD detectors saturated in a few seconds of exposure time. Rather at these sites we observed the comparison star, HD 23653 (, K0), since its magnitude is similar to that of the target star. Figure 1 shows a typical image of the CCD’s field of view () at the 0.50m telescope of the Xing Long observatory.
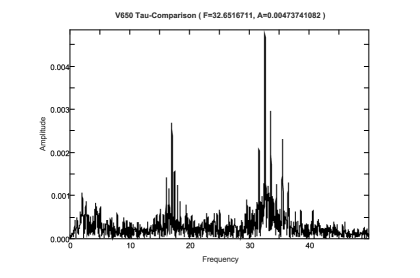
Sky flats, dark and bias exposures were taken every night at all sites. All data were calibrated and reduced using standard IRAF routines. Aperture photometry was implemented to extract the instrumental magnitudes of the stars. The differential magnitudes were normalized by subtracting the mean of differential magnitudes for each night. In Figure 2 the entire light curves V650 Tau - Comp 2 are presented.
| Observatory | Telescope | Instrument | Observers |
|---|---|---|---|
| Observatorio del Teide (OT, Spain) | 0.80m | 2048x2048 CCD | CZ |
| Observatorio San Pedro Mártir (SPM, Mexico) | 0.84m | 1024x1024 CCD | LFM, RM, MA |
| Xing Long Station (XL, China) | 0.50m | 1024x1024 CCD | JNF |
| Day | Date 2008 | HJD | SPM | XL | OT |
|---|---|---|---|---|---|
| 2454774+ | |||||
| 01 | Nov 11 | 07 | 0.70 | 5.70 | |
| 02 | Nov 12 | 08 | 3.58 | 8.80 | |
| 03 | Nov 13 | 09 | 4.76 | - | |
| 04 | Nov 14 | 10 | 9.68 | 1.08 | |
| 05 | Nov 15 | 11 | 9.42 | - | |
| 06 | Nov 16 | 12 | 9.79 | - | 8.17 |
| 07 | Nov 17 | 13 | 7.64 | - | - |
| 08 | Nov 18 | 14 | 10.15 | 10.28 | - |
| 09 | Nov 19 | 15 | 10.26 | 10.19 | - |
| 10 | Nov 20 | 16 | 10.33 | 10.59 | - |
| 11 | Nov 21 | 17 | 7.22 | 10.36 | - |
| 12 | Nov 22 | 18 | - | 10.66 | - |
| 13 | Nov 23 | 19 | - | - | - |
| 14 | Nov 24 | 20 | - | 4.98 | - |
| Total | observing | time | SPM | XL | OT |
| Nov 11 | Nov 24 | 164.34 | 83.52 | 57.06 | 23.75 |
| Star | HD | ST | |||||
|---|---|---|---|---|---|---|---|
| V650 Tau | 23643 | A7 | 7.79 | 0.25 | 0.14 | 219 | 2.823 |
| Comparison 1 | 23605 | F5 | 6.99 | 0.50 | 0.09 | - | 2.653 |
| Comparison 2 | 23653 | K0 | 7.71 | 1.27 | 1.12 | - | - |
3 Spectral analysis
The period analysis has been performed by means of standard Fourier analysis and least-squares fitting. In particular, the amplitude spectra of the differential time series were obtained by means of Period04 package [6], which considers Fourier as well as multiple least-squares algorithms. This computer package allows to fit all the frequencies simultaneously in the magnitude domain.
The amplitude spectrum of the differential light curve V650 Tauri - Comparison 2 (see Fig 2) is shown in Figure 3. As can be seen, V650 Tauri presents high-amplitude peaks distributed between 17 c/d and 35 c/d.
The frequencies have been extracted by means of standard prewhitening method. In order to decide which of the detected peaks in the amplitude spectrum can be regarded as intrinsic to the star we follow Breger’s criterion given by [7], where it was shown that the signal-to-noise ratio (in amplitude) should be at least 4 in order to ensure that the extracted frequency is significant.
The frequencies, amplitudes and phases are listed in Table 4. Five significant frequencies have been detected in V650 Tauri. Among these only the first two frequencies (35.66 c/d and 17.04 c/d) are similar to that found by Kim & Lee (1996). A detailed analysis of these observations will be given in a forthcoming paper [8].

| Freq. | A | /() | |
|---|---|---|---|
| (c/d) | (mmag) | ||
| 32.6565 | 4.43 | 0.39 | 13.4 |
| 17.0356 | 2.65 | 0.09 | 10.0 |
| 35.5970 | 2.49 | 0.25 | 8.6 |
| 31.6285 | 1.91 | 0.85 | 6.4 |
| 34.6409 | 1.41 | 0.04 | 4.5 |
References
- (1) L. Fox Machado, et al., 2006, A&A, 446, 611.
- (2) M.M. Hernández, et al., 1998, A&A, 338, 511.
- (3) E. Michel, et al., 1999, A&A, 342, 253.
- (4) J.A. Belmonte, et al., in: Weiss W.W., Baglin, A. (eds.) IAU Coll. 137, Inside the stars, p. 347
- (5) S.-L. Kim, S.-W. Lee, A&A, 310, 831
- (6) P. Lenz, M. Breger, 2005, CoAst, 146, 53
- (7) M. Breger, et al., 1993, A&A, 271, 482.
- (8) L. Fox Machado, 2009, et al., AJ, submitted.