Infrared optical absorption spectra of CuO single crystals: Fermion-spinon band and dimensional crossover of the antiferromagnetic order
Abstract
We have obtained mid-infrared optical absorption spectra of the quasi one-dimensional CuO using polarized transmission measurement and interpreted the spectra in terms of phonon assisted magnetic excitations. When the electric field is parallel to the main antiferromagnetic direction a shaped peak is observed with the maximum at eV which is attributed to spinons along Cu-O chains. At low temperatures in the antiferromagnetic phase another peak appears at eV which is attributed to two-magnon absorption but the spinon peak remains. This behavior is interpreted as due to a dimensional crossover where the low temperature three-dimensional magnetic phase keeps short range characteristics of a one-dimensional magnet.
pacs:
74.72.-h,71.10.Pm,74.25.Gz, 78.20.-eProperties of one dimensional systems are radically different from those of higher dimension. For Heisenberg one-dimensional (1D) antiferromagnets (AF) the ground state is a spin liquid with fermionic excitations called spinons rather than the usual, propagating spin waves, of ordered higher dimensional systems. A fundamental question in condensed matter physics is what of these anomalous properties and to which extent can survive in anisotropic but higher dimensional systems. For a quasi-1D system formed by chains bridged by small perpendicular interactions the ground state is expected to be ordered, however a spin liquid may still be a good approximation for the ground state. Furthermore 2D quantum antiferromagnets, although ordered at , are believed to be close to a spin liquid ground state. This has been widely studied in connection with high temperature superconductors as it has been proposed that superconductivity emerges from a spin liquidand04 . Even in an ordered state, intermediate to short range spin liquid characteristics may reflect on the response at finite frequencies, as proposed by Anderson and collaborators to explain puzzling side bands in optical spectra of 2D AF cupratescho01 .
In this communication we study the mid-infrared spectrum of CuO (tenorite) due to magnetic excitations infrared (IR) active by the Lorenzana and Sawatzky (LS) phonon-assisted mechanismlor95 ; lor95b . CuO is a quasi-1D spin-1/2 compound (Cu2+) which becomes a 3D antiferromagnetyan89b ; for89 at low temperatures K. It has an intermediate phase at K which is a spiral and has attracted recent attention for being a high- multiferroickim08 . We show that the mid-IR spectrum of CuO at can be interpreted as due to spinon excitations as found for Sr2CuO3, the well known 1D S=1/2 AF material suz96 ; lor97 . In the ordered phase () a feature due to the propagation of two spin waves appears similar to the bimagnon peak of 2D cuprateslor95 ; lor95b . The high energy side bands however remain strong and evolve continuously from the fermionic spectrum in strong analogy with the scenario of Ref. cho01 in which fermionic excitations persist in an ordered system.
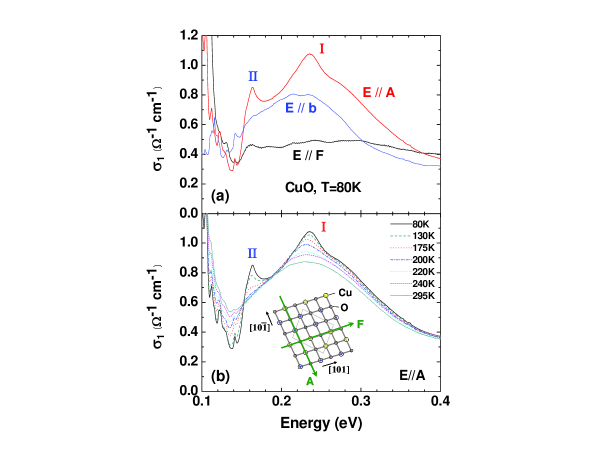
The tenorite CuO single crystal with the monoclinic lattice structure was grown using the floating zone method kim08 . At the Cu2+ spins (S=1/2) are parallel to the [010] direction (=-axis) pointing normal to the -plane (see inset of Fig. 1 (b)). Within the plane they show antiferromagnetic alignment along the [10] direction and ferromagnetic order along the [101] direction. We label the two magnetic directions as A=[10] and F=[101] respectively. To probe IR response of the three principle axes A,, and F, we have prepared three samples with (A,F),(A,) and (,F) faces respectively with typical area of 5mm 5mm. For IR transmission measurement, they were mechanically polished to 50 m thickness. Incident IR radiation was linearly polarized such that the electric field was parallel to the magnetic axes. For example in the (A,F) sample the transmission was measured with the IR electric field and magnetic field set as (//A, //F) and (//F, //A). With the three samples we collect the full set of data, (, )// (A,F), (A,),(F,),(F,A),(,F) and (,A). From them we find that is determined by but not dependent on . For example, ’s for (, )// (A,F) and (A,) were identical. It holds when is polarized along C and axes as well. In the monoclinic CuO, A and F are not orthogonal but form an angle of 99.54o. Therefore it is not possible to get a “pure” F or A response but there is “leakage” in although the effect is small. The optical conductivity for the three modes //A, //F, and // were extracted from using the standard Fresnel formula analysis.
Fig. 1(a) shows the optical conductivity of CuO taken at K when E is parallel to A, F, and axes. In //A mode, the mid-IR absorption consists of a broad shaped peak labeled II with a much narrow peak superposed on the low energy part labeled I. These Peak I and II are absent in the ferromagnetic axis //F. This is consistent with an electric dipole operatorlor95 containing a term which excites AF aligned spins in sites ,. In the //b polarization we find an absorption bands with an intermediate strength. The rapid rise of at meV is due to the optical phonons. The infrared phonons of CuO crystal were studied by Kuzmenko et al. from reflectivity measurement kuz01 according to which the highest energy phonon peak lies at 65 meV for //A. We have checked that the tail of such phonon overlaps the rise of below 140 meV. The strength of the phonon at its center frequency is about 800 cm)-1, much greater than that of the mid-IR peak. It shows that although both features are E-active, the mid-IR absorption has a different activation origin from the phonon.
According to the LS mechanism magnetic excitations which are not directly dipole active, become visible in the IR spectra thanks to the assistance of an optical phonon. At lowest order two magnons (or two spinons in 1D) plus a phonon are created by the absorbed photon. Generally the spectrum is similar to the magnetic Raman spectrum with the difference that because the phonon carries momentum, an extra integration over the total momentum of the magnon (or spinon) pair, is required, instead of the pair having zero total momentum as in Raman. Thus the spectrum may have sharp structures due to Van Hove singularities which provide precious information on the excitations in the system. Another important difference with Raman is that the spectrum at is shifted by the phonon frequency thus appearing as a phonon side band. The relevant phonon is usually a stretching mode phonon whose frequency can be estimated from the highest optical phonon. In the following we take meVkuz01 for the E//A mode which we analyze in detail. The AF chains can also contribute in the direction involving a polarized buckling phonon which can add to interchain magnetic contributions involving other phonons. Thus the E// line shape has a mixed intrachain -interchain character. This more complicated case probably relevant for the multiferroic effect will be analyzed elsewhere.
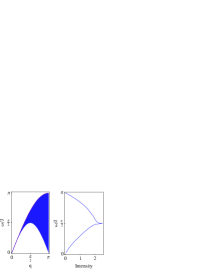 |
We note that peak I, in E//A mode, is similar to the two-magnon peak observed in 2D cuprates at which is dominated by bimagnonsper93 ; per98 ; lor95 ; lor95b while peak II resembles the shaped peak observed in 1D cupratessuz96 and well understood in terms of spinon absorptionlor97 . In a purely 1D AF Heisenberg system with exchange interaction , the dipole operator connects the ground state with the two spinon continuum which is limited by the des Cloizeaux-Pearson dispersion relationclo62 (the shaded region in the left panel of Fig. 2). At the spectrum of spinon excitations can be computed virtually exactlylor97 while at finite temperatures numerical and analytical results are availablegag00 . The lower edge of the continuum has a saddle at momentum (setting the lattice spacing ) with energy . When integrated over momentum at a Van Hove singularity appears at corresponding to the maximum of the absorptionlor97 (c.f. Fig. 2, right panel). Increasing the temperature the Van Hove singularity broadens gag00 but the maximum remains close by.
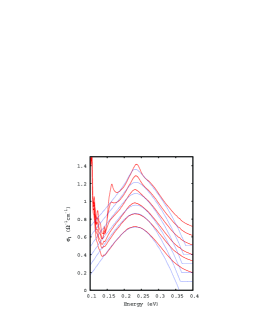 |
Fig. 3 compares the experimental data with the two spinon theoretical ansatz of Ref. lor97 ; gag00 for a purely 1D system at different temperatures. Surprisingly despite the substantial 3D character of the magnetism in CuO, the main feature is in good agreement with the theory with a weakly varying temperature dependent effective . At high temperatures the main difference is the high energy tail which may be attributed to higher multispinon or multiphonon/multispinon processes. Thus above the ordering temperatures the line shape is well explained by the fermionic spinon excitations of a pure 1D system. Indeed at high enough temperature spins on different chains are uncorrelated and the small interchain interactions average to zero. As the temperature is lowered the effect of the interchain interactions becomes to be relevant. One effect is to renormalize upwards the effective along the chains due to indirect exchange processes. This explains the weak temperature dependence of needed to fit the experiment. Another effect will be to drive 3D magnetic order as discussed below.
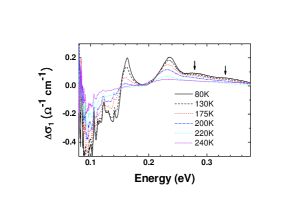 |
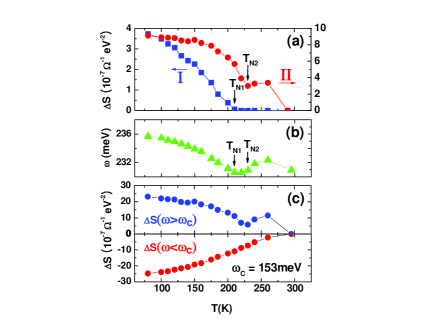
In order to understand the origin of peak I we plot in Fig. 4 the change of optical conductivity with respect to the room- data. Note that peak I and peak II show different -dependences; while peak II evolves gradually in this temperature range, consistently with the fact that , peak I develops below trough a reorganization of the low energy part of the spinon continuum. This can be seen more clearly in Fig. 5(a) where we plot the change in oscillator strength of the two peaks as where the integral is taken for the relevant ranges 153 meV 186 meV for I and 186 meV 260 meV for II, respectively. Peak I grows reorganizing the spinon spectral weight which is transferred from low energies to high energies. In addition the whole magnetic line shape gains weight as the temperature is lowered. This is due to transfer of spectral weight from the phonon region to the magnetic region as the AF ordering builds up and the excitation of antialigned spins become more likely. Notice that these two processes keep the total sum rule practically constant [c.f. Fig. 5(c)]. On passing we notice that an anomaly appears on the temperature dependence of peak II when the spiral develops at , which may be related to the mutiferroic effect.
The temperature dependence of peak I shows that it requires long-range order where spin waves became well defined propagating excitations. The dipole operator produces two spin waves in nearest neighbor sites which interact stronglylor95 ; lor95b . A rough estimate of the position of the peak can be obtain from the energetic cost to flip two neighboring spin, along the AF chain, in the Ising limit. Taking into account only along the chains one expects the peak to appear at eV in good agrement with the observation. Clearly the smaller interactions which drive the 3D AF order can not be neglected and at first sight they would spoil the agreement. Their effect would be to increase (decrease) the estimate providing they are non-frustrating (frustrating) with the non-frustrating effect expecting to dominate. To some extent this is already taken into account by the renormalization of however some hardening is still expected. On the other hand more realistic interacting spin wave theory (ISWT) computations give generally a smaller result than the Ising estimate so a cancellation of errors may explain the surprisingly good agreement of the simple estimate . For example in 2D one obtains while . A precise ISWT computation in the present case is not possible because the structure is much more complicated and the interchain interactions are not precisely known.
In the ordered temperature range exhibits two weak sideband peaks at higher frequencies as indicated by the arrows. Their peak energies, 0.276eV and 0.334eV are close to eV and eV consistent with multi-spin-wave excitations as observed in 2D cuprates. Also the position of peak II has an anomaly at the ordering temperature and hardens below . All this shows that the reorganization of the spinon spectral weight due to the emergence of the spin waves occurs also at high energies. Spinons and spin-waves mix but conserve to a surprising extent their own character.
 |
The value found for meV is larger than a previous “rough” neutron scattering estimateyan89b (6720 meV), a susceptibility measurementshi03 (73 3 meV) and self-interaction-free LDA (52 meV)fil05 but smaller than a recent LDA study (126 meV or 118 meV depending on detail of the method)roc09 . Notice also that our measurements weight more heavily the high energy part of the spectrum which may be affected differently by the smaller interactions than the previous experiments.
To conclude we have shown that CuO can be described at high temperatures as a 1D quantum antiferromagnet with fermionic excitations. As the temperature is lowered a dimensional crossover occurs and the system becomes ordered with well defined propagating spin-waves but with a strong remnant of the spinon band. A similar phenomena has been seen in KCuF3 using neutron scattering where the spin waves appeared as a very subtle reorganization of the low energy spinon spectral weightlak05 . Here the effect is much more dramatic challenging theories of the crossover.
The ordered spectrum is qualitatively similar to the one of AF cuprates parent of the high- superconductors. There the spectrum was interpreted as the superposition of two-magnon propagating spin wave excitations plus a prominent high energy band due to incoherent multimagnon processes, for which no well establish theory exist. Comparison with CuO suggest that a spinon interpretation is reasonablecho01 . Furthermore, the relative weight of the two propagating spin wave processes respect to the higher energy excitations decreases as one approaches spin liquid states changing the spin or the dimensionality. For example in spin-1 2D La2NiO4 the spectrum is exhausted by the two-magnon peakper98 , in 2D cuprates 43% of the spectral weight is in the two-magnon peaklor99 , here it amounts to only and in Sr2CuO3lor97 it is zero. This progression gives credit to theories which argue that 2D cuprates are close to a spin liquid phase.
This work was supported by the Frontier Research Facility Program at the University of Seoul. Y. S. and T. K. were supported by KAKENHI (20674005 and 20001004), Japan. J. L was supported by MIUR PRIN 2007FW3MJX003 and partially by NSF grant PHY05-51164 at KITP. J.L thanks KITP-UCSB for hospitality under the program “The Physics of Higher Temperature Superconductivity”.
References
- (1) P. W. Anderson, P. A. Lee, M. Randeria, T. M. Rice, N. Trivedi, and F. C. Zhang, J. of Phys. Condens. Matter 16, R755 (2004).
- (2) C. M. Ho, V. N. Muthukumar, M. Ogata, and P. W. Anderson, Phys. Rev. Lett. 86, 1626 (2001).
- (3) J. Lorenzana and G. A. Sawatzky, Phys. Rev. Lett. 74, 1867 (1995).
- (4) J. Lorenzana and G. A. Sawatzky, Phys. Rev. B 52, 9576 (1995).
- (5) B. X. Yang, T. R. Thurston, J. M. Tranquada, and G. Shirane, Phys. Rev. B 39, 4343 (1989).
- (6) J. B. Forsyth, P. J. Brown, and B. M. Wanklyn, J. of Phys. C: Solid State Phys. 21, 2917 (1988).
- (7) T. Kimura, Y. Sekio, H. Nakamura, T. Siegrist, and A. P. Ramirez, Nat. Mater. 7, 291 (2008).
- (8) H. Suzuura, H. Yasuhara, A. Furusaki, N. Nagaosa, and Y. Tokura, Phys. Rev. Lett. 76, 2579 (1996).
- (9) J. Lorenzana and R. Eder, Phys. Rev. B 55, R3358 (1997).
- (10) A. B. Kuzmenko, D. van der Marel, P. J. M. van Bentum, E. A. Tishchenko, C. Presura, and A. A. Bush, Phys. Rev. B 63, 094303 (2001).
- (11) J. D. Perkins, J. M. Graybeal, M. A. Kastner, R. J. Birgeneau, J. P. Falck, and M. Greven, Phys. Rev. Lett. 71, 1621 (1993).
- (12) J. D. Perkins, R. J. Birgeneau, J. M. Graybeal, M. A. Kastner, and D. S. Kleinberg, Phys. Rev. B 58, 9390 (1998).
- (13) D. J. Cloizeaux and J. J. Pearson, Phys. Rev. 128, 2131 (1962).
- (14) E. Gagliano, F. Lema, S. Bacci, J. J. V. Alvarez, and J. Lorenzana, Phys. Rev. B 62, 1218 (2000).
- (15) T. Shimizu, T. Matsumoto, A. Goto, K. Yoshimura, and K. Kosuge, J. Phys. Soc. Japan 72, 2165 (2003).
- (16) A. Filippetti and V. Fiorentini, Phys. Rev. Lett. 95, 086405 (2005).
- (17) X. Rocquefelte, M. H. Whangbo, A. Villesuzanne, S. Jobic, F. Tran, K. Schwarz, and P. Blaha (unpublished).
- (18) B. Lake, D. A. Tennant, C. D. Frost, and S. E. Nagler, Nature Mat. 4, 329 (2005).
- (19) J. Lorenzana, J. Eroles, and S. Sorella, Phys. Rev. Lett. 83, 5122 (1999).