11email: paolo.davanzo@brera.inaf.it 22institutetext: Università degli Studi dell’Insubria, Dipartimento di Fisica e Matematica, via Valleggio 11, I-22100 Como, Italy 33institutetext: Instituto de Astrofísica de Canarias, 38200 La Laguna, Tenerife, Canary Islands, Spain 44institutetext: INAF, Osservatorio Astronomico di Roma, via Frascati 33, I-00040 Monte Porzio Catone, Roma, Italy
The optical counterparts of Accreting Millisecond X-Ray Pulsars during quiescence††thanks: Based on observations made with ESO Telescopes at the Paranal Observatory under programmes ID 077.D-0677(D) and ID 079.D-0884(A) and observations made with the ESO telescopes obtained from the ESO/ST-ECF Science Archive Facility.
Abstract
Context. Eight Accreting Millisecond X–ray Pulsars (AMXPs) are known to date. Although these systems are well studied at high energies, very little information is available for their optical/NIR counterparts. Up to now, only two of them, SAX J1808.43658 and IGR J00291+5934, have a secure multi-band detection of their optical counterparts in quiescence.
Aims. All these systems are transient Low-Mass X–ray Binaries. Optical and NIR observations carried out during quiescence give a unique opportunity to constrain the nature of the donor star and to investigate the origin of the observed quiescent luminosity at long wavelengths. In addition, optical observations can be fundamental as they ultimately allow us to estimate the compact object mass through mass function measurements.
Methods. Using data obtained with the ESO-Very Large Telescope, we performed a deep optical and NIR photometric study of the fields of XTE J1814338 and of the ultracompact systems XTE J0929314 and XTE J1807294 during quiescence in order to look for the presence of a variable counterpart. If suitable candidates were found, we also carried out optical spectroscopy.
Results. We present here the first multi-band () detection of the optical counterpart of XTE J1814338 in quiescence together with its optical spectrum. The optical light curve shows variability in both bands consistent with a sinusoidal modulation at the known 4.3 hr orbital period and presents a puzzling decrease of the band flux around superior conjunction that may be interpreted as a partial eclipse. The marginal detection of the very faint counterpart of XTE J0929314 and deep upper limits for the optical/NIR counterpart of XTE J1807294 are also reported. We also briefly discuss the results reported in the literature for the optical/NIR counterpart of XTE J1751305.
Conclusions. Our findings are consistent with AMXPs being systems containing an old, weakly magnetized neutron star, reactivated as a millisecond radio pulsar during quiescence which irradiates the low-mass companion star. The absence of type I X–ray bursts and of hydrogen and helium lines in outburst spectra of ultracompact ( hr) AMXPs suggests that the companion stars are likely evolved dwarf stars.
Key Words.:
1 Introduction
Some Low Mass X–ray Binaries (LMXBs) exhibit sporadic outburst activity while for most of their time they remain in a state of low-level activity; these systems are commonly referred to as X-ray transients (White et al. 1984). Historically, the classification of X-ray transients is made on the basis of their spectral hardness. The outbursts of Soft X-ray Transients (SXTs), characterized by equivalent bremsstrahlung temperatures keV, are often accompanied by a pronounced increase in the luminosity of their (faint) optical counterparts and by the onset of type I X-ray burst activity (Maraschi & Cavaliere 1977; Woosley & Taam 1976). During quiescence, these transient systems are very faint in X-rays ( erg s-1) and their optical luminosity drops by as much as 6-7 mag, giving a unique opportunity for the study of their companion stars. These properties clearly associate SXTs with LMXBs containing an old, weakly magnetized, neutron star, (for a review see, e.g. Campana et al. 1998). In the following we will refer to these systems as Low-Mass X–ray Transients (LMXTs).
It has long been suspected that millisecond radio pulsars are the spun-up products of sustained mass transfer onto neutron stars in LMXBs. According to this scenario, the companions in the LMXBs evolve and transfer matter onto the neutron star on a long time-scale, spinning it up to periods as short as a few ms. This model has gained strong support about ten years ago thanks to the launch of the Rossi X-ray Timing Explorer (RXTE) satellite that discovered kilohertz quasi-periodic oscillations (kHz QPOs) as well as coherent oscillations during type-I X-ray bursts in a number of LMXBs (e.g. Strohmayer et al. 1996). These periodicities are interpreted as the millisecond spin periods of weakly magnetic neutron stars. In April 1998 the first Accreting Millisecond X-ray Pulsar (AMXP) was discovered, with a 401 Hz (2.5 ms) X-ray pulsations (SAX J1808.4-3658; Wijnands & van der Klis 1998). This conclusion was further strengthened by the discovery of additional systems in the following years. Eight such systems are now known: SAX J1808.43658 (Wijnands & van der Klis 1998; Chakrabarty & Morgan 1998); XTE J1751305 (Markwardt et al. 2002); XTE J0929314 (Galloway et al. 2002); XTE J1807294 (Markwardt et al. 2003a); XTE J1814338 (Markwardt & Swank 2003; Strohmayer et al. 2003); IGR J00291+5934 (Galloway et al. 2005); HETE J1900.1-2455 (Morgan et al. 2005) and SWIFT J1756.9-2508 (Krimm et al. 2007)111Very recently, episodes of coherent ms X-ray pulsations were discovered in archival data of the LMXTs Aql X-1 (Casella et al. 2008) and SAX J1748.9-2021 (Altamirano et al. 2008). We will not consider these sources in the present paper.. These findings directly confirmed evolutionary models that link the neutron stars of LMXBs to those of millisecond radio pulsars, the former being the progenitors of the latter. All these systems are LMXTs, have orbital periods in the range between 40 min and 4.3 hr and spin frequencies from 1.7 to 5.4 ms. These eight accreting millisecond pulsars are well studied at high energies, especially in Xrays, both during outburst and quiescence (see Wijnands 2006 for a review). On the other hand, with the significant exception of SAX J1808.43658 and IGR J00291+5934, their optical/NIR quiescent counterparts are only poorly known. The optical light curve of SAX J1808.43658 in outburst and quiescence shows variability modulated at the orbital period, in antiphase with the Xray light curve (Giles et al. 1999; Homer et al. 2001; Campana et al. 2004). This is unlike other quiescent transients that normally show a double-humped morphology, due to an ellipsoidal modulation, and indicates that the companion star is exposed to some irradiation. The same behaviour is seen in the quiescent optical light curve of IGR J00291+5934 (D’Avanzo et al. 2007)222A recent paper of Jonker et al. (2008) pointed out evidence for a change in the quiescent level of IGR J00291+5934 and for strong flaring episodes. A slight phase difference in the folded light curve is also found with respect to that reported in D’Avanzo et al. (2007). In a theoretical study on SAX J1808.43658 Burderi et al. (2003) proposed, on the base of previous works (Stella et al. 1994; Campana et al. 1998), that the irradiation is due to the release of rotational energy by the fast spinning neutron star, switched on, as a radio pulsar, during quiescence. Following this idea, Campana et al. (2004) and D’Avanzo et al. (2007) measured the required irradiating luminosity needed to match the optical flux of SAX J1808.43658 and IGR J00291+5934, respectively, and found that it is a factor of about 100 larger than the observed quiescent Xray luminosity for both systems. Neither accretiondriven Xrays nor the intrinsic luminosity of the secondary star or the disk can account for it. So, these authors conclude that the only source of energy available within these systems is the rotational energy of the neutron star, reactivated as a millisecond radio pulsar.
Among the eight accretion-powered millisecond X–ray pulsars known to date, four of them are in ultracompact systems, with orbital periods shorter than 60 minutes. Three of these ultracompact systems, XTE J1751305, XTE J0929314 and XTE J1807294 are remarkably homogeneous, with measured orbital periods of 42.4, 43.6 and 40.1 minutes respectively, well below the minimum period for a system with a donor composed primarily of hydrogen ( min; Rappaport et al. 1982).
Optical and NIR observations performed in the past by different groups only led to deep upper limits for the counterparts of XTE J1751305 (Jonker et al. 2003) and XTE J1814338 (Krauss et al. 2005) or to the detection of very faint candidates, if any (Monelli et al. 2005 for XTE J0929314). No observations of XTE J1807294 during quiescence have been reported to date, while HETE J1900.1-2455 is still in outburst and SWIFT J1756.9-2508 has been discovered very recently (June 2007). The intrinsic faintness of the targets during quiescence, in combination with the large interstellar absorption and high stellar crowding of the relevant fields clearly explain the lack of detections at optical wavelengths.
2 Observations and data reduction
Optical and NIR observations of the field of XTE J1814338, XTE J0929314 and XTE J1807294 were carried out with the ESO Very large Telescope (VLT), using FORS1, FORS2 and ISAAC. All nights were clear, with seeing in the range . For XTE J1814338 we collected from the ESO archive333http://archive.eso.org/ images taken with the FORS2 camera on nights 2004 May 20-21. A set of about 8 images of 5-6 min integration were obtained every night which cover about % of the 4.3 hr orbital period at each filter. From the ESO archive we downloaded images of the field of XTE J0929314 taken with the FORS1 camera on nights 2003 December 19-20-21. The dataset consists of a set of 6 images of 5 min integration that cover more than twice per night the 43.6 min orbital period at each filter. We observed the field of XTE J1807294 with our approved program ID 077.D-0677(D) in service mode with the ISAAC camera. Observations were carried out in band on 2006 May 5 and covered about 92% of the 40.1 min orbital period of the system. In addition, we collected from the ESO archive images taken with the FORS2 camera on night 2004 June 10 that cover about of the orbital period. We also obtained optical spectra of the counterpart candidates of XTE J1814338 and XTE J1807294 with the FORS1 camera on nights 2007 September 2-3 during our observing run approved under program ID 079.D-0884(A). The complete observing log is presented in Table 1
Image reduction was carried out following standard procedures: subtraction of an averaged bias frame, division by a normalized flat frame; NIR frames were reduced using the ISAAC pipeline data reduction jitter, part of the ECLIPSE444http://www.eso.org/projects/aot/eclipse/ package. Astrometry was performed using the USNOB1.0555http://www.nofs.navy.mil/data/fchpix/ and the 2MASS666http://www.ipac.caltech.edu/2mass/ catalogues. PSF-photometry was made with the ESO-MIDAS777http://www.eso.org/projects/esomidas/ daophot task for all the objects in the field. The photometric calibration was done against Landolt standard stars for filters and against the 2MASS catalog for NIR filters. In order to minimize any systematic effect, we performed differential photometry with respect to a selection of local isolated and non-saturated reference stars.
Our spectra of XTE J1814338 and XTE J1807294 were acquired with the grism 300V, covering the wavelength range 40009000 Å. We used a slit, resulting in an effective resolution of . The extraction of the spectrum was performed with the ESO-MIDAS software package. Wavelength and flux calibration of the spectra were achieved using helium-argon lamp and observing spectrophotometric stars.
A short Xray observation of XTE J1814338 was carried out with the XMM-Newton satellite. Details about the observation and data analysis are given in Sec. 3.1.
| Source | UT observation | Exposure | Seeing | Instrument | Filter/ |
|---|---|---|---|---|---|
| (YYYmmdd) | (s) | (arcsec) | Grism | ||
| XTE J1814338 | 20040521.27086 | s | VLT/FORS2 | ||
| 20040521.27194 | s | VLT/FORS2 | |||
| 20040522.26303 | s | VLT/FORS2 | |||
| 20040522.25830 | s | VLT/FORS2 | |||
| 20070904.07468 | s | VLT/FORS1 | |||
| XTE J0929314 | 20031220.27210 | s | VLT/FORS1 | ||
| 20031220.27646 | s | VLT/FORS1 | |||
| 20031220.28083 | s | VLT/FORS1 | |||
| 20031221.29201 | s | VLT/FORS1 | |||
| 20031221.29636 | s | VLT/FORS1 | |||
| 20031221.30071 | s | VLT/FORS1 | |||
| 20031222.26029 | s | VLT/FORS1 | |||
| 20031222.26467 | s | VLT/FORS1 | |||
| 20031222.26904 | s | VLT/FORS1 | |||
| XTE J1807294 | 20040610.16380 | s | VLT/FORS2 | ||
| 20040610.17390 | s | VLT/FORS2 | |||
| 20040610.18748 | s | VLT/FORS2 | |||
| 20060505.19875 | s | VLT/ISAAC | |||
| 20070903.19999 | s | VLT/FORS1 |
3 XTE J1814338
XTE J1814338 was discovered in outburst on 2003 June 5 during monitoring of the central Galactic plane with the RXTE (Markwardt & Swank 2003). The detection of coherent pulsations at frequency of 314.3 Hz (3.2 ms), modulated on an orbital period of 4.3 hr, makes this source the widest accreting millisecond X–ray pulsar known to date (Markwardt & Swank 2003; Markwardt et al. 2003b). Many Xray bursts were observed from XTE J1814338 with the RXTE satellite. Assuming the Eddington limit for the brightest of those bursts Strohmayer et al. (2003) obtained a source distance of kpc. X–ray observations carried out with the Chandra satellite during outburst led to a precise source position and showed a featureless X-ray spectrum which is best fit by an absorbed power law plus blackbody model, where the equivalent hydrogen column density () is comparable to the Galactic value (Krauss et al. 2005). An candidate optical counterpart was identified within the small Chandra error box during the outburst and was no longer visible during quiescence down to a limiting magnitude ( c.l.; Krauss et al. 2005). Optical spectroscopy of the candidate carried out during the outburst revealed prominent hydrogen and helium emission lines, supporting its association with XTE J1814338 (Steeghs 2003). An X-ray heated accretion disk model is able to account for the magnitudes measured during the 2003 outburst but this model is unable to account for the band data, which are systematically brighter than predicted (Krauss et al. 2005). A similar “IR excess” with respect to the X-ray heated disk model, was observed in the accretion-powered millisecond pulsar SAX J1808.4-3658 (Wang et al. 2001; Greenhill et al. 2006) and suggests for both sources a significant contribution from the companion star or from a synchrotron-emitting region (Wang et al. 2001; Krauss et al. 2005; Greenhill et al. 2006; Russell et al. 2007). No radio observations of this source have been reported to date. Using RXTE data taken during outburst, Papitto et al. (2007) performed a precise timing analysis measuring a spin-down behaviour of the source ( Hz s-1) and used this value to estimate a magnetic field of G. No quiescent X–ray observations of this system have been reported to date.
3.1 XMMNewton observations
XMM-Newton observed XTE 1814–338 on Sep. 6 2005 for 41 ks. The observation is plagued by strong proton flares and only 9 ks (pn data) survive after filtering. A faint source can be detected at the known source position with a signal to noise ratio of 2.6. The source count rate is c s-1 (1 confidence level). The source is not detected in the MOS1 and MOS2 exposures. Assuming a power law spectrum with and the outburst column density (Krauss et al. 2005) we can estimate a 0.5–10 keV unabsorbed flux of erg cm-2 s-1, converting to a quiescent luminosity of erg s-1 (assuming a distance from Earth of 8 kpc). Despite that this luminosity is somewhat higher than what usually observed in AMXPs, we remark that the uncertainties connected to this value are very large due to the paucity of counts as well as to the spectral parameters.
3.2 Optical counterpart during quiescence
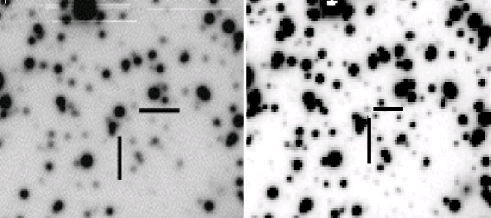
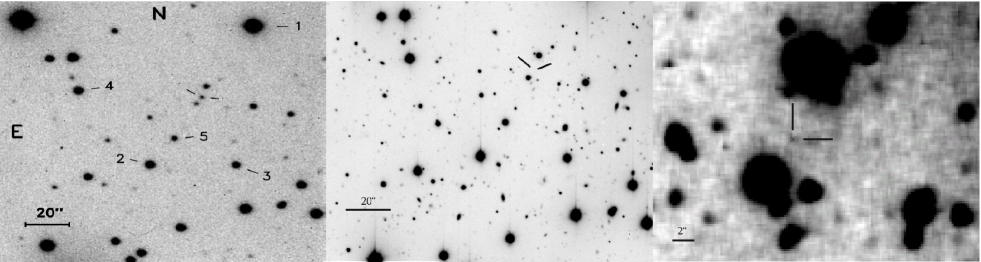
In all our and frames we found a point-like object inside the Chandra error box at the following coordinates (J2000): R.A. = , Dec = ( error). This position is coincident with the one of the optical counterpart of XTE J1814338 detected by Krauss et al. (2005) during the 2003 outburst. The object has and . A finding chart is shown in Fig. 1.
3.3 Optical light curve
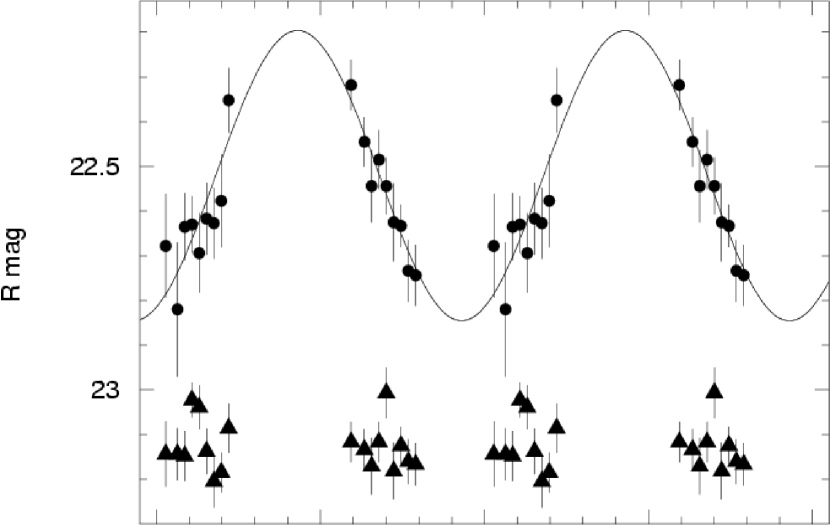
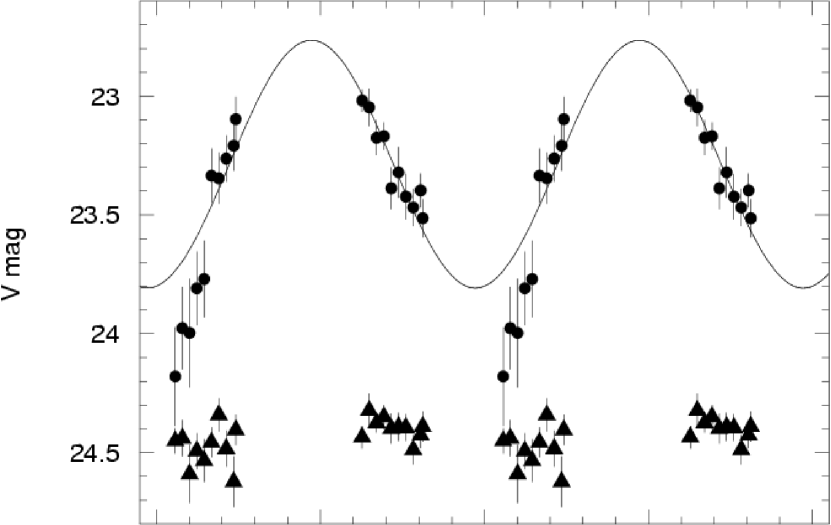
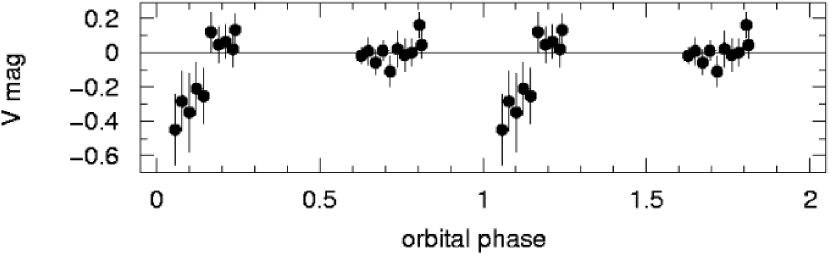
Once we identified the candidate, we searched for variability of this source in each filter. We performed PSF-photometry of our candidate and of a selected sample of bright, non-saturated, isolated stars assumed to be non-variable in all our frames. The result of such differential photometry is that our source is variable with a clear sinusoidal modulation at the 4.3 hr orbital period with an average semiamplitude of about 0.4 mag (Fig. 2). This unambiguously identifies the source as the optical counterpart of XTE J1814338 and represents the first detection at optical wavelengths of this source during quiescence. In both and band the light curve shows a single minimum around phase 0, i.e. at superior conjunction (when the neutron star is behind the companion) and a maximum around phase 0.5 ( and respectively, based on the precise X–ray ephemerides of Papitto et al. 2007), likely indicating that irradiation of the companion star plays a crucial role and it is reminiscent of the optical light curves of SAX J1808.43658 and IGR J00291+5934 during quiescence. All the results of our phase-resolved multi-band photometry are reported in Table 2.
It is interesting to note that in the band light curve, the points between phases 0.05 - 0.17 are well below the sinusoid best-fit of the data. We carefully checked the band images used to obtain the measurement, and it seems that they are not affected by problems (e.g., cosmic rays, spikes, bad pixels). In addition, the comparison stars are not affected by this decrease. However, there is no clear evidence of a similar effect in the corresponding points of the band light curve taken contemporaneously (Fig. 2). A tentative explanation for this observed phenomenon will be presented and discussed in Sec. 3.5.
| Filter | Mean magnitude | Semiamplitude | Aλ | |
|---|---|---|---|---|
| (Å) | (mag) | (mag) | ||
| 5270 | ||||
| 6440 |
3.4 Optical spectrum
Our spectra of XTE J1814338 were acquired on the night 2007 Sept. 3, with the FORS1 camera of the ESO-VLT equipped with the grism 300V, covering the wavelength range 40009000 Å. We calibrated them observing spectrophotometric standard stars and corrected the flux for interstellar absorption (see Sec. 3.5 for details on reddening correction). We accounted for slit losses by matching our and photometry. With a simple rescaling (by a factor 1.2) we were able to correct the flux discrepancy between spectra and photometry, showing that the spectral flux calibration was robust. We then computed an average of all the available spectra, in order to increase the signal-to-noise ratio. In our averaged spectrum we can clearly detect H, H and a possible HeI 5875 emission lines, superposed on a blue continuum (Fig. 3), with equivalent widths of Å, Å and Å, respectively. These emission lines are also visible in each single spectrum. Unfortunately, the S/N and the spectral resolution are not high enough to determine if these lines have a double-horned profile (the typical signature of an accretion disk) or not.

3.5 Origin of the quiescent optical emission
The X–ray mass function () computed by Markwardt et al. (2003b), combined with a neutron star mass of , implies for XTE J1814338 a minimum companion mass of . Based on the harmonic properties of the burst oscillations, Bhattacharyya et al. (2005) were able to derive 90% confidence intervals of for the inclination of XTE J1814338. A similar constraint was derived by Krauss et al. (2005) from the absence of X–ray eclipses or dips and assuming an absolute magnitude of the system during quiescence of . With these constraints on the system inclination the companion mass should be in the range . Information about the companion mass can also be obtained from our color photometry. To compute the color of the source we first need to correct our magnitudes for interstellar absorption computed with the relation cm-2 mag-1 (Bohlin et al. 1978) and assuming cm-2 (Krauss et al. 2005). The resulting color excess is mag. Using a standard extinction curve from Fitzpatrick (1999) we obtained the reddening parameters for our filters (Table 2). We thus computed a mean unabsorbed color and compared it (Fig. 4) with the theoretical mass-color diagrams computed for solar metallicity low-mass stars reported in Baraffe et al. (1998). The result is that the secondary’s mass should be ( c.l.). Using the Xray mass function, we can derive for these masses the inclination of the system . Assuming a uniform a priori distribution of inclination angles, the inferred inclination would be low, and therefore improbable (). In addition, these inclinations are at variance with the estimates of Bhattacharyya et al. (2005) and Krauss et al. (2005) described above.

The discrepancies in the estimate of the companion’s mass can find a natural explanation under the hypothesis that the secondary star is subjected to strong irradiation from the compact object, as suggested by the optical light curve. Since during our observations XTE J1814338 was in quiescence, we try to investigate the possible causes of its optical/NIR emission. Following Campana et al. (2004) and D’Avanzo et al. (2007) we now attempt to account for the optical spectrum flux (corrected for interstellar absorption) with the simple model of an irradiated star with a blackbody spectrum (for the details of the modeling see Chakrabarty 1998 eqs. [8][13]). We fit the data by using the irradiating luminosity (), the distance from Earth (), the radius of the companion star () and the albedo of the star () as free parameters. To fill the Roche lobe of a 4.3 hr binary system, a main-sequence companion star of XTE J1814338 should obey the mass-radius relation (see, e.g., Frank et al. 1992). For each possible radius we can thus derive the binary separation which is also a parameter foreseen in the Chakrabarty (1998) model. We obtain an acceptable fit to all the data (see Fig. 5 and Table 3), with a reduced (18 degrees of freedom, n.h.p. of 58%).
| Model | Distance | Rin | ||||
|---|---|---|---|---|---|---|
| (erg s-1) | (kpc) | () | (cm) | |||
| Star | 0.9 | |||||
| Disc + star |

The result of our fit is that the required irradiating luminosity is erg s-1. Taking this value as a lower limit for the spin-down luminosity of a classical rotating magnetic dipole, we can estimate a neutron star’s magnetic field greater than Gauss. Such value is in agreement with the estimate of Papitto et al. (2007). The required irradiating luminosity is about two orders of magnitude larger than the quiescent Xray luminosity of XTE J1814338 ( erg s-1; see Sec. 3.1). Such discrepancy is reminiscent of that observed for SAX J1808.43658 (Burderi et al. 2003; Campana et al. 2004) and IGR J00291+5934 (D’Avanzo et al. 2007) and can be explained with the presence in the system of a relativistic particle wind from an active pulsar which irradiates the companion star. As reported in Table 3, we were able to estimate and consequently, using the mass-radius relation reported above, . Such values are typical of a main-sequence M-type star, in agreement with the estimate made by Krauss et al. (2005) for this system. On the other hand, the color we measured is consistent with a late G or K-type main-sequence star. In addition, the optical spectrum of XTE J1814338 is well fitted with a blackbody with Å (Fig. 5), equivalent to a surface temperature of K (typical of a G-K star). With a typical mass and radius comparable to the Sun, a G or K star cannot fit the Roche lobe of a binary system like XTE J1814338. However, this discrepancy between the observed spectral type of the companion star and the geometrical limits of the system finds a natural explanation if we assume that the relativistic particle wind of the radio pulsar, which irradiates the companion, would increase its surface temperature making it appear as an earlier spectral type star.

The simple model we considered above does not predict the presence of a residual disk during quiescence. To check for a more realistic solution we tried to fit our data with the model of an irradiated star plus a disk by using the irradiating luminosity (), the distance from Earth (), the radius () and the albedo of the companion star () and the internal disk radius () as free parameters. We fixed the Xray albedo of the disk to 0.95 (Chakrabarty 1998). For each possible radius we assumed an outer disk radius of (where is the binary separation). We obtained an acceptable solution for values of the fitting parameters similar to the model of the irradiated star alone (see Table 3 and Fig. 6). We can provide just an upper limit for the inner disk radius, given that the reduced of the fit reaches a minimum for values of the inner disk radius that go beyond the level of the neutron star surface. Within the limits of our fit, the residual accretion disk contributes about 20% to the observed optical flux888We also tried to fit our data with a disk model, but we found an acceptable solution only for large values of the irradiation luminosity ( erg s-1) and of the disk inner radius ( cm).. Such scenario might shed light on the puzzling optical light curve we presented in Sec. 3.2 and in Fig. 2. A possible way to explain this flux decrease can be found assuming that the companion star or an intra-binary shock front (created by the interaction of the relativistic pulsar wind and matter outflowing from the companion star and the disk) are eclipsing the disk. Since the disk is very blue (peaking at Å ), we would expect a marked decrease in the band ( mag) and a minor decrease () in the band999Assuming that around phase zero the whole contibution of the disk () to the observed optical flux is eclipsed., which might be hidden in the error bars of our photometry. As reported in Sec. 3.2, the eclipse duration is of at least 10% of (unfortunately we do not have data between orbital phase ). We can also derive an upper limit of on the eclipse duration assuming that the eclipse profile is symmetric around phase 1.0 (Fig. 2). So, the size of the region producing the eclipse should be which means , where is the binary separation. Using and we obtain . This might indicate that the extended region is producing the eclipse, rather than a compact feature as also suggested by the broad decrease in the observed band flux. However, if the companion is eclipsing the disk, the system should be close to edge-on but, as noted by Krauss et al. (2005), no eclipses or dips are visible in the Xray light curve (), weakening the hypothesis of the companion eclipsing the disk.
Alternatively, as shown in Campana et al. (2004) for SAX J1808.4-3658, the intra-binary shock front (if present) is expected to have a blue spectrum, partially contributing to the whole observed optical flux. If the companion star is eclipsing this shock front, then the eclipse should be visible also at low-inclinations, the shock front being spatially close to the companion star. As in the previous scenario, such an eclipse should be more marked in the bluer bands, however only the lower limit of our estimate of is compatible with the expected size of the companion star of XTE J1814338.
Finally, if the companion star is not fully convective (but see Podiadlovski 1991) and has a temperature gradient between the hemisphere facing the neutron star and the other one persistently hidden, this can explain the flux decrease without invoking eclipses.
4 Ultracompact Accreting ms X–ray Pulsars
Binary systems with minutes can be formed in at least two possible channels as summarized, e.g., by Deloye & Bildsten (2003). The first scenario starts from stable mass transfer onto a neutron star from an evolved main-sequence star close to core hydrogen exhaustion (Nelson et al. 1986; Fedorova & Ergma 1989; Podsiadlowski et al. 2002; Nelson & Rappaport 2003), or a He-burning star (Savonije et al. 1986; Tutukov & Fedorova 1989). According to this scenario, the system goes through the 40 minute period range twice. Such a system will initially evolve to orbital periods comparable to the ultracompact AMXPs and can reach a period minimum of about 10 minutes. The resulting ultracompact binaries have donor masses of as they pass through minutes on their way toward the minimum period. At this stage, the donors have masses significantly greater with respect to those measured for the ultracompact AMXPs known to date. However, systems evolving through minutes on the way out from their period minimum have masses of the order of 0.01 , more in line with the measurements. By this time the donors have become partially degenerate low-mass, low-luminosity donor stars. On the contrary, the second channel involves evolution through the common-envelope phase during an unstable mass transfer from an intermediate mass () to the neutron star. The donor and the neutron star spiral-in to shorter orbital periods until the envelope is expelled. The remaining core of the donor could be either an He or C/O white dwarf star with (Bildsten 2002; Deloye & Bildsten 2003). The main difference between these two evolutionary models is that according to the first one a residual fraction of hydrogen still should be present in the companion star as the system reaches minutes. Since the evolution of these systems is still unknown, a detection of the companion star will allow us to differentiate between these different formation scenarios.
4.1 XTE J0929314
The Xray transient XTE J0929314 was discovered by the All-Sky Monitor (ASM) on the RXTE satellite in 2002 April (Remillard & Smith 2002). RXTE observations revealed persistent 185.1 Hz (5.4 ms) pulsations and a binary orbital period of 43.6 minutes. The measured X-ray mass function () gives a minimum companion mass of () and implies (95% c.l.) for a uniform a priori distribution of inclination angles (Galloway et al. 2002). Chandra observations carried out during the 2002 outburst showed a featureless Xray spectrum ( keV) that is well fitted by a power-law blackbody model with consistent to Galaxy line-of-sight values cm-2 (Juett et al. 2003). Variable optical (Greenhill et al. 2002; Cacella 2002) and radio (Rupen et al. 2002) counterparts were detected during outburst. Optical photometry performed by Giles et al. (2005) during outburst revealed a sinusoidal modulation probably due to a combination of emission by a hotspot and an Xray heated secondary star. These authors also report the evidence of an excess in the and band in the broad-band spectrum (similar to what observed in SAX J1808.43658 and XTE J1814338), that may be due to synchrotron emission in matter flowing out of the system. The optical spectrum of XTE J0929314, carried out during outburst, shows a strong feature around 4640 Å, probably due to C or N emission, and no clear evidence for H/He emission or absorption lines (Nelemans et al. 2006). During quiescence, XTE J0929314 was barely detected by Chandra in the 0.510 keV range. The quiescent Xray spectrum could be fitted with a simple power-law model and no thermal component was detected (Wijnands et al. 2005). Deep optical observations carried out during quiescence led to the detection of a very faint () source at a position consistent with the Xray and radio error circles (Monelli et al. 2005).
4.1.1 Optical counterpart during quiescence
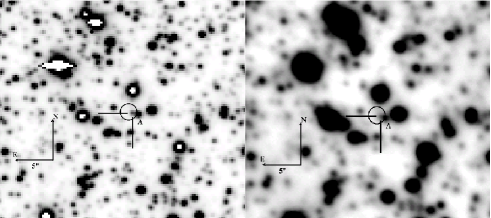
We averaged all our , and frames in order to obtain a deep image of the field of XTE J0929314 for each filter. We found a faint, point-like object inside the precise radio error circle (Rupen et al. 2002) at the following coordinates (J2000): R.A. = , Dec = ( error). This position is coincident with the one of the optical counterpart detected by Giles et al. (2005) during the 2002 outburst (Fig. 7). The source is not visible in the single VLT frames, and no check for variability could be performed. The results of our PSF photometry are shown in Table 4; we note that we only have a marginal detection of the source but our photometry is in agreement with the results reported by Monelli et al. (2005).
| Filter | Mean magnitude | Aλ | Absolute mag | |
|---|---|---|---|---|
| (Å) | (mag) | |||
| 5270 | ||||
| 6440 | ||||
| 7980 |
We can use our detection to evaluate the possible nature of the optical counterpart of XTE J0929314 in light of the possible evolutionary states of ultracompact systems presented in Sec. 4. Given that the source is detected during quiescence, we will assume that, if present, the accretion disk contribution is low with respect to the total observed flux, as discussed for XTE J1814338 (Sec. 3.5) and found for other accretion powered millisecond X–ray pulsars (Campana et al. 2004; D’Avanzo et al. 2007).

Using a column density cm-2 (Juett et al. 2003) we estimate a color excess of mag and, assuming for the system a distance of 8 kpc, we estimated the expected absolute magnitudes of the different possible Roche-lobe filling companion stars and compared them with our photometry of XTE J0929314. Following similar work by Jonker et al. (2003) on the AMXP XTE J1751305, we considered, for the evolved main-sequence star scenario, the post-period-minimum model for XB 1832330 (, ), a binary system with orbital period close to 40 min (Table 1 in Podsiadlowski, Rappaport & Pfahl 2002) and the helium star donor model reported in Table III in Tutukov & Fedorova (1989; , ). For the white-dwarf scenario, we used the model of Deloye & Bildsten (2003) which estimates for XTE J0929314 either a hot C/O star or a hot He star (, and , , respectively; Figs. 5, 6 in Deloye & Bildsten 2003). In light of the results obtained above for XTE J1814338 and given the low number of data points, we considered the simple model of an irradiated star with a blackbody spectrum (for details of the modeling see Chakrabarty 1998 and Sec. 3.5). As shown in Fig. 8, we see that for an irradiating luminosity equal to the X–ray quiescent one ( erg s-1, assuming a distance of 8 kpc; Wijnands et al. 2005) none of the proposed models can account for the observed magnitudes of XTE J0929314. To match our photometry, we need an irradiating luminosity higher than about a factor of 8 ( erg s-1). Taking this value as a lower limit for the spin-down luminosity of a classical rotating magnetic dipole, we can estimate a lower limit of G for the neutron star’s magnetic field (in agreement with the estimate of Monelli et al. 2005 and the upper limit of Wijnands et al. 2005).
4.2 XTE J1807294
XTE J1807294 was discovered on February 21, 2003 revealing a frequency of 190.6 Hz (5.3 ms) by the RXTE satellite during a Galactic plane scan (Markwardt et al. 2003a). A follow-up Chandra observation allowed to obtain a precise position ( uncertainty, 90% c.l.) and to determine an orbital periodicity of 40.1 minutes, making it the shortest orbital period of all accreting millisecond X–ray pulsars known to date (Markwardt et al. 2003a). No type I X–ray bursts have been detected, so the distance of XTE J1807294 is still unknown. Campana et al. (2003) observed the source during outburst with the XMM-Newton satellite at a luminosity level of about erg s-1 ( keV, assuming a distance of 8 kpc) with an X–ray featureless spectrum well fitted by an absorbed ( cm-2) blackbody plus hard Comptonization model like COMPTT (Titarchuk 1994). Kilohertz quasi-periodic oscilllations (kHz QPOs) have been detected in the X–ray flux of XTE J1807294 during outburst with a frequency separation consistent with the 191 Hz pulse frequency (Linares et al. 2005). From XMM-Newton outburst observations, Kirsch et al. (2004) improved the determination of binary orbital parameters and estimated an X–ray mass function of the system of , which implies (assuming a neutron star mass of 1.4 and ) a minimum companion mass of 0.007 . A re-analysis of these data enabled Falanga et al. (2005) to constrain the companion mass to , suggesting that is a very low mass (likely white) dwarf. INTEGRAL observations of XTE J1807294 in the 0.5200 keV carried out during the 2003 outburst (simultaneously with the XMM-Newton and RXTE observations) revealed a spectrum consistent with a combination of thermal Comptonization and blackbody, as found at lower energy by Campana et al. (2003) but with a higher equivalent temperature (Falanga et al. 2005). During quiescence, XTE J1807294 was observed with XMM-Newton and the source was not detected down to a upper limit of erg s-1 (0.510 keV) assuming a distance of 8 kpc (Campana et al. 2005). No detection of the counterpart of the system at other wavelengths has been reported so far.
4.2.1 A search for the optical counterpart during quiescence
Our imaging dataset of XTE J1807294 covers, respectively, about 32%, 32%, 57% and 90% of the 40.1 min orbital period of the system (see Table 1). An analysis of our images revealed the presence of a source within the precise () Chandra error circle (Fig. 9) at the following coordinates (J2000): R.A. = , Dec = ( error). As can be seen in Fig. 9, this source is barely visible in our averaged band image, obtained under worse seeing conditions, and no solution can be obtained with aperture or PSF-photometry in this band. phase resolved PSF-photometry gave no evidence for variability. The source appears to be almost constant at a level of and 101010When calibrated with respect to Landolt standard stars, our band magnitudes of the candidate counterpart of XTE J1807294 appear to be suspiciously brighter than expected from the extrapolated color. We found that this behaviour is common to other sources in the field and we conclude that our band photometry is very likely affected by some systematic error and, therefore, we report here only our results.. If any variability is present, it should be lower than 0.1 mag. Assuming a column density (Campana et al. 2003) we estimated a color excess of mag and compute the unabsorbed color, typical of an A5-F2 main sequence star.
To further investigate the nature of this source, we obtained on 2006 Sept. 3 an optical spectrum in the wavelength range 40009000 Å. We extracted the spectrum and found no evidence for Balmer or He emission lines (Fig. 10). The spectrum is almost featureless, with the exception of and absorption lines, superposed onto a blue continuum, suggesting an early-type star (in agreement with the results of our color photometry). The fact that the flux density of the spectrum is a factor of brighter than our photometry (after correcting for interstellar reddening) shows that it is probably contaminated by a nearby bright star (star “A” in Fig. 9). Among the possible scenarios of formation and evolution of ultracompact X–ray binaries that we have reported in Sec. 4.1, only an evolved main-sequence companion star is supposed to show hydrogen features in its optical spectrum but they should be detected together with prominent helium lines (Nelemans, Jonker & Steeghs 2006). The detection of H absorption features together with the non-detection of He lines in the spectrum of our source and the absence of variability in the light curve suggests that our candidate is not the quiescent optical counterpart of XTE J1807294 but more likely an early-type main-sequence star. We then used 3 upper limits of our photometry (reported in Table 5) to constrain the possible companion star of XTE J1807294. Assuming a distance of 8 kpc we converted our upper limits into absolute magnitudes (Table 5).

| Filter | Limiting magnitude | Aλ | Absolute mag | |
|---|---|---|---|---|
| (Å) | (mag) | |||
| 5270 | ||||
| 6440 | ||||
| 12500 |
As done in Sec. 4.1.1 for XTE J0929314, we compared the results of our photometry to a set of spectral energy distributions computed for the model of an irradiated companion star. All the models we considered for XTE J0929314 (Fig. 8) can be considered valid for XTE J1807294. In addition, we also considered the model of a cold C white dwarf (, ; Deloye & Bildsten 2003; Falanga et al. 2005). We assumed an irradiating quiescent X–ray luminosity of about erg s-1 (consistent with the non-detection of Campana et al. 2005) or a spin-down luminosity of erg s-1, as measured for the accretion-powered millisecond X–ray pulsars XTE J1814338 (Sec. 3.5), SAX J1808.43658 (Campana et al. 2004) and IGR J00291+5934 (D’Avanzo et al. 2007). As shown in Fig. 11, our upper limits do not constrain any of the models, even assuming a high irradiating luminosity.

4.3 XTE J1751305
The transient accreting millisecond X–ray pulsar XTE J1751305 was discovered on 2002 April during regular monitoring observations of the Galactic bulge region by the RXTE satellite. The pulsar has a spin frequency of 435.3 Hz (2.3 ms), a signature of orbital Doppler modulation on an orbital period of 42.4 minutes; no X–ray eclipses were detected (Markwardt et al. 2002). The precise determination of the orbital parameters enabled Markwardt et al. (2002) to derive the X–ray mass function , which implies a minimum mass for the companion star of depending on the mass of the neutron star. These authors derived a lower limit for the distance of the source of 7 kpc, by assuming a mass transfer rate from the companion equal to the one measured for SAX J1808.43658. XMM-Newton observations carried out during the 2002 outburst revealed an X–ray (0.510 keV) featureless spectrum consistent with a simple absorbed blackbody plus power-law model with atoms cm-2 (Miller et al. 2003). Gierliński & Poutanen (2005) presented the results of an extensive study of all the X–ray data of XTE J1751305 taken with the RXTE and XMM-Newton satellites during its 2002 outburst. These authors show that the broad X–ray spectrum of XTE J1751305 can be fitted with a model of two soft components (which originate from a cool accretion disk and a hot-spot on the neutron star surface) and a hard component due to thermal Comptonization in a shocked region in the accretion column. During quiescence, XTE J1751305 was observed with Chandra and was not detected down to a keV luminosity upper limit of erg s-1, assuming a distance of 8 kpc (Wijnands et al. 2005).
4.3.1 Constraints on the optical counterpart
The X–ray observations of XTE J1751305 place some strong constraints on the geometry of its companion star. The non-detection of X–ray eclipses or dips and the assumption that the mass transfer is driven by gravitational radiation (Markwardt et al. 2002) constrain the orbital inclination to be in the range and the companion mass to be . Nelson & Rappaport (2003) computed a model for the evolution of a main-sequence, hydrogen-rich companion star of XTE J1751305 that can evolve to the observed short period of about 42 minutes. According to this model, the current companion star should be a low-mass, low-luminosity non-degenerate star with a residual fraction of hydrogen. An alternative scenario is presented by Deloye and Bildsten (2003) and foresees a hot white dwarf companion with an evolved (He, C/O) composition. The detection (e.g. via optical spectroscopy) of hydrogen would thus be a key discriminant for determining the validity of these models. Unfortunately, there are no detections of the optical counterpart of XTE J1751305 to date, nor in outburst or in quiescence. An observational campaign at optical and NIR bands placed upper limits on the presence of a star at the precise Chandra position of XTE J1751305 (Jonker et al. 2003).
| Filter | Limiting magnitude | Aλ | Absolute mag | |
|---|---|---|---|---|
| (Å) | (mag) | |||
| 6500 | ||||
| 8000 | ||||
| 9625 | ||||
| 12500 |

We used 3 upper limits of the Jonker et al. (2003) photometry (reported in Table 6) to constrain the possible companion star of XTE J1751305 and converted them into absolute magnitudes assuming a source distance of 8 kpc (Table 5). Following the procedure discussed in Sec. 4.1.1 for XTE J0929314, we compared the results of Jonker et al. (2003) photometry to different models of an irradiated companion star. All the models we have considered for XTE J0929314 (Fig. 8) can be considered valid also for XTE J1751305. We assumed an irradiating quiescent X–ray luminosity of about erg s-1 (consistent with the non-detection of Wijnands et al. 2005) and a spin-down luminosity of erg s-1 erg s-1. As shown in Fig. 12, these limits are not deep enough to constrain any of the proposed models for the companion star of this system, even for a high irradiating luminosity value.
5 Discussion and Conclusions
We have presented an extensive study of the optical counterparts of Accreting Millisecond X–ray Pulsars during quiescence. The results of our observational campaigns (also presented in Campana et al. 2004 and D’Avanzo et al. 2007), together with data collected from public archives, provided the first comprehensive optical study of the AMXPs class during quiescence. As we discussed in Sec. 1, the eight accreting millisecond X–ray pulsars known to date can be divided into two subclasses using the orbital period as a discriminant parameter: compact ( hr) and ultracompact ( hr) systems. The compactness of these systems implies very low-mass companion stars as inferred from the measured X–ray mass functions. So, it is reasonable to foresee a very low optical luminosity during quiescence, when the main contribution to the total optical flux is expected to come from the companion star. On the other hand, in such narrow systems, irradiation from the compact object might play a key role in the observed luminosity, by heating the inner face of the companion star (this energy is then redistributed through the star; Podsiadlowski 1991). We reported the first detection of the quiescent optical/NIR counterparts of XTE J1814338 (Sec. 3.2). Phase resolved photometry of this source revealed a highly sinusoidal optical light curve, modulated at the orbital period with a minimum when the neutron star is seen behind the companion, with respect to the observer. This behaviour, reminiscent of what observed for SAX J1808.43658 (Homer et al. 2001; Campana et al. 2004) and IGR J00291+5934 (D’Avanzo et al. 2007), suggests a companion star heated by the compact object. This is at variance with the “classical” ellipsoidal modulation observed in wider LMXTs. The irradiating luminosity required to account for the observed optical flux is in all cases at least one order of magnitude greater than the observed quiescent X–ray luminosity. An explanation for this observed “optical excess” could be found if we assume that these systems host an active millisecond radio pulsar. According to the standard model of formation of millisecond pulsars these neutron stars have been recycled in interacting low-mass X-ray binaries, i.e. have been spun up by accretion after substantial decay of their surface magnetic fields. During quiescence (i.e. when the accretion rate onto the neutron star drops by orders of magnitude or even stops) the radio pulsar may turn on and start to lose rotational energy in the form of a relativistic particle wind that can irradiate the companion star. This wind eventually can be stopped by the pressure of the material flowing from the companion star generating a shock front. The presence of such an extended feature may eclipse the light coming from a residual accretion disk (if present during quiescence), providing an explanation for the puzzling behaviour of the band light curve of XTE J1814338 we presented in Fig. 2 and discussed in Sec. 3.5.
As for the compact AMXP systems, the detection of the observed optical flux during quiescence of the ultracompact system XTE J0929314 can be accounted for only by invoking an irradiating luminosity about one order of magnitude greater than the quiescent X–ray luminosity (Fig. 8). Taking our estimates of the irradiating luminosity as a lower limit for the spin-down luminosity of a classical rotating magnetic dipole, we could estimate the neutron star’s magnetic field for both systems. The derived limits are in agreement with the standard scenario of weakly magnetized ( G) neutron stars to be the progenitors of millisecond radio pulsars (Sec. 3.5 and 4.1.1). We note that no radio pulsations were detected from XTE J0929314 during quiescence. Beaming factor and intrinsic low radio luminosity were suggested as the most likely explanations for this non-detection (Iacolina et al. 2009). XTE J1751305 and XTE J1807294 lie both on the Galactic plane and are therefore heavily absorbed (we estimated mag and mag, respectively). Even assuming a high spin-down luminosity ( erg s-1), the upper limits of the photometry are consistent with a non detection of the quiescent optical counterpart.
As we discussed in Sec. 4, there are two main basic and competing scenarios for the formation of ultracompact binary systems. The first involves an evolved main-sequence or a He-burning companion star (both with a residual presence of hydrogen) while the second predicts for the presence of a He or C/O white dwarf. We note that according to both scenarios the companion star of these ultracompact systems should be a very low-mass () low-luminosity star. As shown in Figures 7, 10 and 11, with our data we cannot constrain any of the evolutionary models for ultracompact binary systems. However, as we reported in Sec. 4, the detection of hydrogen from one of these systems would be a key discriminant in determining the validity of the first scenario (which involves an evolved main-sequence or a He-burning star) with respect to the second one (white dwarf companion). Optical spectroscopy of XTE J0929314 carried out during outburst did not reveal any clear evidence of hydrogen or helium lines (Nelemans, Jonker and Steeghs 2006). In addition, we note that, at variance with what is observed for all the compact systems, none of the ultracompact AMXPs showed Type-I X–ray bursts. These events originate from explosive nuclear ignition on the surface of neutron stars. At a critical point, degenerate hydrogen and/or helium burning ignites explosively, suddenly heating up the entire surface, enough to emit strong X-rays (Maraschi & Cavaliere 1977; Woosley & Taam 1976). The absence of Type-I bursts among ultracompact AMXPs finds a natural explanation if we assume that there is no hydrogen and/or He left in the donor star, as expected in the case of a C/O white dwarf companion star, suggesting that the other evolutionary channel for these systens is not populated.
With quiescent unabsorbed magnitude in the range , compact AMXPs are well within the spectroscopic capabilities of telescopes of the 8-meter class. An estimate of the radial velocity of the companion star can lead to a determination of the optical mass function and, consequently, to place constraints on the mass of the two stars. Firm upper limits on the neutron star mass could be fundamental to discriminate between different equations of state. Phase-resolved spectroscopy of these sources would be the natural continuation of the work presented in this paper.
Acknowledgements.
We thank the anonymous referee for her/his useful comments and suggestions. PDA and SC acknowledge the Italian Space Agency for financial support through the project ASI I/R/023/05. PDA wants to thank Prof. A. Treves for useful suggestion and discussion. PDA acknowledge H. Sana, S. Hubrig and L. Faunez for useful help given during observations at the ESO-VLT.References
- Altamirano et al. (2008) Altamirano, D., Casella, P., Patruno, A., Wijnands, R., & van der Klis, M. 2008, ApJ, 674, L45
- Baraffe et al. (1998) Baraffe, I., Chabrier, G., Allard, F., & Hauschildt, P. H. 1998, A&A, 337, 403
- Bhattacharyya et al. (2005) Bhattacharyya, S., Strohmayer, T. E., Miller, M. C., & Markwardt, C. B. 2005, ApJ, 619, 483
- Bildsten (2002) Bildsten, L. 2002, ApJ, 577, L27
- Bohlin et al. (1978) Bohlin, R. C., Savage, B. D., & Drake, J. F. 1978, ApJ, 224, 132
- Burderi et al. (2003) Burderi, L., Di Salvo, T., D’Antona, F., Robba, N. R., & Testa, V. 2003, A&A, 404, L43
- Cacella (2002) Cacella, P. 2002, IAU Circ., 7893, 3
- Campana et al. (1998) Campana, S., Colpi, M., Mereghetti, S., Stella, L., & Tavani, M. 1998, A&A Rev., 8, 279
- Campana et al. (2004) Campana, S., D’Avanzo, P., Casares, J., et al. 2004, ApJ, 614, L49
- Campana et al. (2005) Campana, S., Ferrari, N., Stella, L., & Israel, G. L. 2005, A&A, 434, L9
- Campana et al. (2003) Campana, S., Ravasio, M., Israel, G. L., Mangano, V., & Belloni, T. 2003, ApJ, 594, L39
- Casella et al. (2008) Casella, P., Altamirano, D., Patruno, A., Wijnands, R., & van der Klis, M. 2008, ApJ, 674, L41
- Chakrabarty (1998) Chakrabarty, D. 1998, ApJ, 492, 342
- Chakrabarty & Morgan (1998) Chakrabarty, D. & Morgan, E. H. 1998, Nature, 394, 346
- D’Avanzo et al. (2007) D’Avanzo, P., Campana, S., Covino, S., et al. 2007, A&A, 472, 881
- Deloye & Bildsten (2003) Deloye, C. J. & Bildsten, L. 2003, ApJ, 598, 1217
- Falanga et al. (2005) Falanga, M., Bonnet-Bidaud, J. M., Poutanen, J., et al. 2005, A&A, 436, 647
- Fedorova & Ergma (1989) Fedorova, A. V. & Ergma, E. V. 1989, Ap&SS, 151, 125
- Fitzpatrick (1999) Fitzpatrick, E. L. 1999, PASP, 111, 63
- Frank et al. (1992) Frank, J., King, A., & Raine, D. 1992, Accretion Power in Astrophysics (Accretion Power in Astrophysics, ISBN 0521408636, Cambridge University Press, 1992.)
- Galloway et al. (2002) Galloway, D. K., Chakrabarty, D., Morgan, E. H., & Remillard, R. A. 2002, ApJ, 576, L137
- Galloway et al. (2005) Galloway, D. K., Markwardt, C. B., Morgan, E. H., Chakrabarty, D., & Strohmayer, T. E. 2005, ApJ, 622, L45
- Gierliński & Poutanen (2005) Gierliński, M. & Poutanen, J. 2005, MNRAS, 359, 1261
- Giles et al. (2005) Giles, A. B., Greenhill, J. G., Hill, K. M., & Sanders, E. 2005, MNRAS, 361, 1180
- Giles et al. (1999) Giles, A. B., Hill, K. M., & Greenhill, J. G. 1999, MNRAS, 304, 47
- Greenhill et al. (2006) Greenhill, J. G., Giles, A. B., & Coutures, C. 2006, MNRAS, 370, 1303
- Greenhill et al. (2002) Greenhill, J. G., Giles, A. B., & Hill, K. M. 2002, IAU Circ., 7889, 1
- Homer et al. (2001) Homer, L., Charles, P. A., Chakrabarty, D., & van Zyl, L. 2001, MNRAS, 325, 1471
- Iacolina et al. (2009) Iacolina, M. N., Burgay, M., Burderi, L., Possenti, A., & di Salvo, T. 2009, A&A, 497, 445
- Jonker et al. (2003) Jonker, P. G., Nelemans, G., Wang, Z., et al. 2003, MNRAS, 344, 201
- Jonker et al. (2008) Jonker, P. G., Torres, M. A. P., & Steeghs, D. 2008, ApJ, 680, 615
- Juett et al. (2003) Juett, A. M., Galloway, D. K., & Chakrabarty, D. 2003, ApJ, 587, 754
- Kirsch et al. (2004) Kirsch, M. G. F., Mukerjee, K., Breitfellner, M. G., et al. 2004, A&A, 423, L9
- Krauss et al. (2005) Krauss, M. I., Wang, Z., Dullighan, A., et al. 2005, ApJ, 627, 910
- Krimm et al. (2007) Krimm, H. A., Markwardt, C. B., Deloye, C. J., et al. 2007, ApJ, 668, L147
- Linares et al. (2005) Linares, M., van der Klis, M., Altamirano, D., & Markwardt, C. B. 2005, ApJ, 634, 1250
- Maraschi & Cavaliere (1977) Maraschi, L. & Cavaliere, A. 1977, in X-ray binaries and compact objects, p. 127 - 128, 127–128
- Markwardt et al. (2003a) Markwardt, C. B., Smith, E., & Swank, J. H. 2003a, The Astronomer’s Telegram, 122, 1
- Markwardt et al. (2003b) Markwardt, C. B., Strohmayer, T. E., & Swank, J. H. 2003b, The Astronomer’s Telegram, 164, 1
- Markwardt & Swank (2003) Markwardt, C. B. & Swank, J. H. 2003, IAU Circ., 8144, 1
- Markwardt et al. (2002) Markwardt, C. B., Swank, J. H., Strohmayer, T. E., Zand, J. J. M. i., & Marshall, F. E. 2002, ApJ, 575, L21
- Miller et al. (2003) Miller, J. M., Wijnands, R., Méndez, M., et al. 2003, ApJ, 583, L99
- Monelli et al. (2005) Monelli, M., Fiorentino, G., Burderi, L., et al. 2005, in American Institute of Physics Conference Series, Vol. 797, Interacting Binaries: Accretion, Evolution, and Outcomes, ed. L. Burderi, L. A. Antonelli, F. D’Antona, T. di Salvo, G. L. Israel, L. Piersanti, A. Tornambè, & O. Straniero, 565–568
- Morgan et al. (2005) Morgan, E., Kaaret, P., & Vanderspek, R. 2005, The Astronomer’s Telegram, 523, 1
- Nelemans et al. (2006) Nelemans, G., Jonker, P. G., & Steeghs, D. 2006, MNRAS, 370, 255
- Nelson & Rappaport (2003) Nelson, L. A. & Rappaport, S. 2003, ApJ, 598, 431
- Nelson et al. (1986) Nelson, L. A., Rappaport, S. A., & Joss, P. C. 1986, ApJ, 304, 231
- Papitto et al. (2007) Papitto, A., di Salvo, T., Burderi, L., et al. 2007, MNRAS, 375, 971
- Podsiadlowski (1991) Podsiadlowski, P. 1991, Nature, 350, 136
- Podsiadlowski et al. (2002) Podsiadlowski, P., Rappaport, S., & Pfahl, E. D. 2002, ApJ, 565, 1107
- Rappaport et al. (1982) Rappaport, S., Joss, P. C., & Webbink, R. F. 1982, ApJ, 254, 616
- Remillard & Smith (2002) Remillard, R. & Smith, D. 2002, The Astronomer’s Telegram, 88, 1
- Rupen et al. (2002) Rupen, M. P., Dhawan, V., & Mioduszewski, A. J. 2002, IAU Circ., 7893, 2
- Russell et al. (2007) Russell, D. M., Fender, R. P., & Jonker, P. G. 2007, MNRAS, 379, 1108
- Savonije et al. (1986) Savonije, G. J., de Kool, M., & van den Heuvel, E. P. J. 1986, A&A, 155, 51
- Steeghs (2003) Steeghs, D. 2003, IAU Circ., 8155, 2
- Stella et al. (1994) Stella, L., Campana, S., Colpi, M., Mereghetti, S., & Tavani, M. 1994, ApJ, 423, L47
- Strohmayer et al. (2003) Strohmayer, T. E., Markwardt, C. B., Swank, J. H., & in’t Zand, J. 2003, ApJ, 596, L67
- Strohmayer et al. (1996) Strohmayer, T. E., Zhang, W., Swank, J. H., et al. 1996, ApJ, 469, L9+
- Titarchuk (1994) Titarchuk, L. 1994, ApJ, 434, 570
- Tutukov & Fedorova (1989) Tutukov, A. V. & Fedorova, A. V. 1989, Soviet Astronomy, 33, 606
- Wang et al. (2001) Wang, Z., Chakrabarty, D., Roche, P., et al. 2001, ApJ, 563, L61
- White et al. (1984) White, N. E., Kaluzienski, J. L., & Swank, J. H. 1984, in American Institute of Physics Conference Series, Vol. 115, American Institute of Physics Conference Series, ed. S. E. Woosley, 31
- Wijnands (2006) Wijnands, R. 2006, in Trends in Pulsar Research, ed. J. A. Lowry, 53
- Wijnands et al. (2005) Wijnands, R., Homan, J., Heinke, C. O., Miller, J. M., & Lewin, W. H. G. 2005, ApJ, 619, 492
- Wijnands & van der Klis (1998) Wijnands, R. & van der Klis, M. 1998, Nature, 394, 344
- Woosley & Taam (1976) Woosley, S. E. & Taam, R. E. 1976, Nature, 263, 101