A Curious Source of Extended X-ray Emission in the Outskirts of Globular Cluster GLIMPSE-C01
Abstract
We report the discovery of an unusual source of extended X-ray emission CXOU J184846.3–013040 (‘The Stem’) located on the outskirts of the globular cluster GLIMPSE-C01. No point-like source falls within the extended emission which has an X-ray luminosity (0.3–8 keV) ergs s-1 and a physical size of pc at the inferred distance to the cluster. These X-ray properties are consistent with the pulsar wind nebula (PWN) of an unseen pulsar located within the 95-percent confidence error contour of unidentified Fermi -ray source 0FGL J1848.6–0138. However, we cannot exclude an alternative interpretation that postulates X-ray emission associated with a bow shock produced from the interaction of the globular cluster and interstellar gas in the Galactic plane. Analysis of the X-ray data reveals that ‘The Stem’ is most significant in the 2–5 keV band, which suggests that the emission may be dominated by non-thermal bremsstrahlung from suprathermal electrons at the bow shock. If the bow shock interpretation is correct, these observations would provide compelling evidence that GLIMPSE-C01 is shedding its intracluster gas during a galactic passage. Such a direct detection of gas stripping would help clarify a crucial step in the evolutionary history of globular clusters. Intriguingly, the data may also accommodate a new type of X-ray source.
keywords:
X-rays: general – gamma rays: observations – globular clusters: general – stars: neutron1 Introduction
For decades, the Galactic plane has been a source of amazement and unexpected X-ray discoveries (Giacconi et al., 1971, 1979; Tanaka, Inoue, & Holt, 1994; Voges et al., 1999). The current generation of X-ray satellites Chandra and XMM-Newton are the latest to extend the census of X-ray sources along the Galactic plane to unprecedented depths (Motch et al., 2003; Grindlay et al., 2005). Together these experiments have revealed a rich tapestry of X-ray binaries, neutron stars, pulsar wind nebulae (PWNe), supernova remnants, coronal emitting stars, and non-thermal filaments along the Galactic plane. However, for every physical object identified with high confidence, the literature is plagued by an equal or greater amount of X-ray sources that continue to elude firm identifications (Wang, Gotthelf, & Lang, 2002; Muno et al., 2008). Frustratingly, a combination of high extinction, excessive crowding, and the lack of direct distance indicators prevent further progress in the identification of many of these sources.
During a routine multiwavelength survey of -ray error contours produced by the Fermi mission (Mirabal, 2009), we have encountered the latest puzzling source connected with the Galactic plane. The object CXOU J184846.3–013040 – which we nickname ‘The Stem’ – corresponds to a source of extended emission in the outskirts of GLIMPSE-C01. The low-latitude Globular Cluster GLIMPSE-C01 is located in the Galactic plane at and was discovered during Galactic plane scans conducted by the Spitzer Space Observatory (Kobulnicky et al., 2005) and the Two Micron All Sky Survey (2MASS; Simpson & Cotera, 2004). Subsequently, superb observations with the Chandra X-ray Observatory revealed a population of X-ray point-like sources with luminosities ergs s-1 around the core of the cluster (Pooley et al., 2007).
‘The Stem’ is an extended source of emission placed well outside the cluster centre and is remarkable for two completely different reasons. First, it lies within the 95-percent confidence error contour of unidentified Fermi source 0FGL J1848.6-0138 (Abdo et al., 2009a; Luque-Escamilla et al., 2009). If powered by a compact object, ‘The Stem’ would constitute a formidable counterpart candidate for the -ray emitter. The second reason, unrelated to the -ray emission, is the fact that the position of GLIMPSE-C01 along the Galactic plane indulges us in that rare geometrical arrangement where a Globular cluster is caught in the act of crossing the Galactic plane. This is the precise moment in which the cluster is believed to interact with the interstellar medium (ISM) and proceed to shed some of the intracluster medium accumulated from the continuous mass loss of individual stars within the cluster (Frank & Gisler, 1976; Faulkner & Smith, 1991).
In order to weigh the merits of each possibility, we analyse archival Chandra images; as well as infrared observations of ‘The Stem’ obtained with the Spitzer Space Telescope. The organization of the paper is as follows. §2 describes the observations. Spectral fits are summarized in §3. In §4 we discuss alternative models for the X-ray emission. Finally, conclusions and future work are presented in §5.
2 Observations
X-ray observations of GLIMPSE-C01 and surrounding regions were obtained with the Advanced CCD Imaging Spectrometer (ACIS) onboard the Chandra X-ray Observatory on 2006 August 15–16 UT. The total exposure time for the observation was 46 ks. The Chandra data were analysed using CIAO version 4.1.1 and version 4 of the calibration database (CALDB). Apart from the population of point-like sources associated with the cluster, the ACIS image reveals an extended source of emission CXOU J184846.3–013040 centered at (J2000.0) R.A.=, decl.=. The source lies 79 arcsec from the cluster centre and appears to have an extent of 5 arcsec in radius, although it seems slightly elongated. We designate this source ‘The Stem’ that in this context can be understood as the front part of a moving object (GLIMPSE-C01), as will be clear later on.
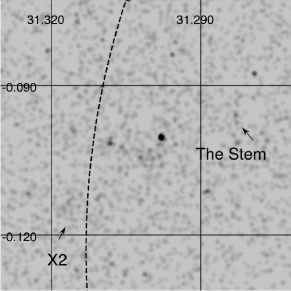
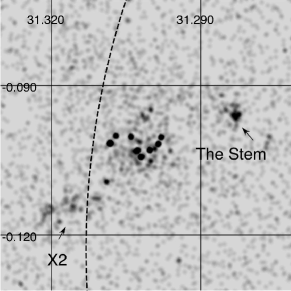
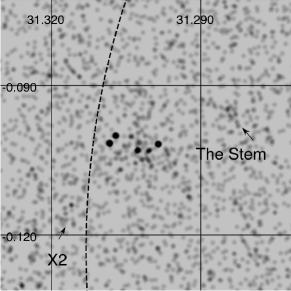
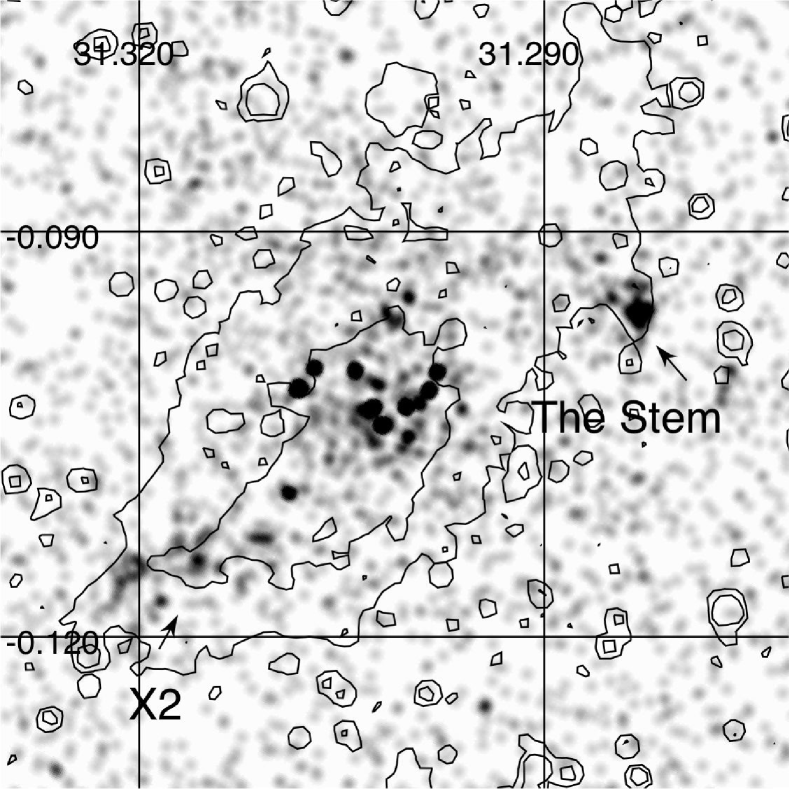
Figure 1 shows the resulting smoothed Chandra ACIS-S3 chip divided in soft (0.3–2 keV), medium (2–5 keV), and hard (5–8 keV) bands. In all cases, the X-ray images have been smoothed with a Gaussian kernel with radius = 2.5″. We find that the Chandra images are dominated by point-like sources surrounding the cluster core already discussed by Pooley et al. (2007). Away from the cluster core, two separate regions of extended emission are visible. ‘The Stem’ corresponds to the area located on the northwest corner. There is also evidence for a fainter trail of extended emission (which we dub X2) that can be made out in the southeast corner of GLIMPSE-C01. Both ‘The Stem’ and X2 are revealed most prominently (9.4 level of significance for ‘The Stem’) in the medium (2–5 keV) band. For completeness, we note that the said sources do not show extreme variability over the span of the observations.
To investigate the radial distribution of the extended X-ray emission across the cluster, we removed all the bright point-like sources within the half-light radius of the cluster. We next proceeded to extract net counts in a sequence of tangent circles (of radius equivalent to 10 pixels) starting at the centre of the globular cluster. Background counts were computed from source-free regions located from the cluster center. To determine , the number of counts in each region were divided by its respective area in square arcsec. The derived radial brightness profile is shown in Figure 2. The profile shows an initial peak dominated by extended emission associated with the globular cluster (Pooley et al., 2007). Away from the centre, the most striking feature in the surface brightness profile is the jump that occurs near 79 arcsec that coincides with the position of ‘The Stem’. Such a sharp discontinuity in the profile excludes significant contamination from background emission in surrounding regions.
3 Spectral Analysis
In order to characterize the X-ray spectrum of ‘The Stem’, counts were extracted from a circular region with a 20-pixel radius (9.8″) centered at (J2000.0) R.A.=, decl.=. The background was extracted from a source-free region with similar radius. Within this region, we obtained 103 source events in the 0.3–8 keV band. As a last step, the extracted photons were grouped to a minimum of 15 counts per bin. Spectral fits to X2 are omitted since it comprises a series of low-significance structures rather a single continuous region. Herein, we shall discuss X2 only in terms of specific X-ray bands.


The resulting spectrum was modelled using the X-ray fitting package XSPEC. Several models provide statistically acceptable fits to the data. A power-law model results in a steep photon index and a rather high Galactic H I column density = cm-2 (). Here and throughout the text, error on individual parameters are quoted at the one-sigma level. The derived value of is in excess of the total Galactic column density = cm-2 obtained from the nH tool111http://heasarc.gsfc.nasa.gov/cgi-bin/Tools/w3nh/w3nh.pl. The fit worsens if the absorption if is treated as a fixed parameter. Because of the low number of photons associated with other point sources around the core, no additional constraints can be placed on the column density for the cluster. The resulting spectrum and best-fitting power-law model for ‘The Stem’ are shown in Figure 3.
For comparison, a black-body model yields T = keV and a column density = cm-2 () closer to the value inferred using the nH tool. A thermal bremsstrahlung model with T = keV and = cm-2 () is also a possibility. Lastly, a Raymond-Smith model with solar abundance results in T = keV and = cm-2 ().
With the variety of models allowed by the observation, attempting multi-component models become a superfluous exercise. Instead, we choose to restrict the rest of our analysis to the models considered here. It might be the case that the actual X-ray spectrum is best explained by multi-component fits, but better and deeper observations will be needed to settle this point. Independent of the specific model, we derive an unabsorbed flux in the 0.3–8 keV band of erg cm-2 s-1 for a fixed column density = cm-2.
4 Possible Interpretations of the Extended Emission
4.1 A Pulsar Wind Nebula within the error contour of 0FGL J1848.6–0138?
A PWN seems to offer a natural explanation for ‘The Stem’. In this picture, the pulsar wind shocks with the ISM and creates a nebula morphology that emits synchrotron radiation (Gaensler & Slane, 2006). In order to evaluate this possibility further, we examined an infrared map composed from 3.6, 5.8, and 8.0m images obtained by the Spitzer Space Telescope with the IRAC instrument on 2004 April 21 (Kobulnicky et al., 2005). Figure 4 shows the three-color image of this region overlain by the X-ray contours derived from the Chandra observation. Note that the area around ‘The Stem’ itself is void of bright stars, which appears to exclude a chance alignment of coronal emitting stars or novae that could explain the extended X-ray emission (Anderson et al., 2003).
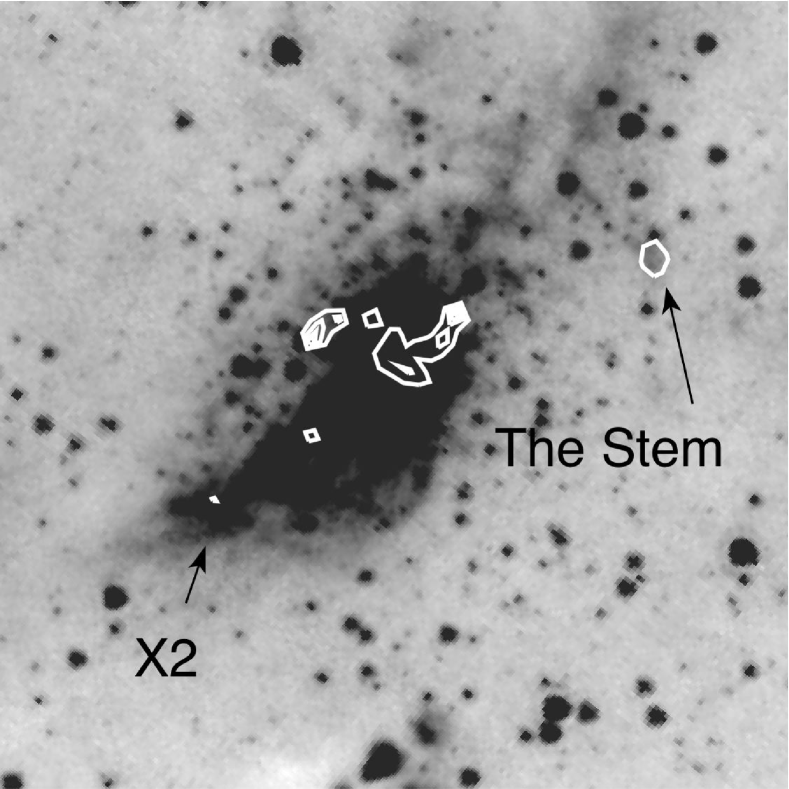
Turning the bands around, Figure 5 shows the Chandra X-ray image overlaid with the infrared contours. From the figure, we can see that ‘The Stem’ is properly aligned with a distinct infrared structure growing continuously from the main plume of infrared emission. We argue that the morphological correspondence suggests that the extended X-ray emission lies at the same distance as GLIMPSE-C01. As noted by Pfahl, Rappaport, & Podsiadlowski (2002), a fraction of neutron stars or potential neutron star progenitors could be ejected from the core but remain bound to the cluster as a result of dynamical interactions. The placement of ‘The Stem’ may be the result of one such interactions. However, actual physical membership in the cluster is not a requirement for a PWN interpretation.
Assuming that indeed ‘The Stem’ lies at the distance to the globular cluster kpc (Pooley et al., 2007), the unabsorbed flux implies an X-ray luminosity ergs s-1 in the 0.5–8 keV band. Such value is generally consistent with observed values for well-studied PWNe (Cheng, Taam, & Wang, 2004). Similarly, the derived spatial extent of the source ( 5 arcsec in radius) translates to 0.1 pc at this distance. We note that this value is also perfectly in line with the values reported for the termination radii of PWNe (Cheng et al. 2004). The overall agreement with typical values of known pulsars provides encouraging evidence for a PWN interpretation.
Owing to the lack of radio emission, Kobulnicky et al. (2005) have also reported a radio upper limit of 1.4 mJy for point-like sources within this region based on 1.4 GHz observations obtained with the Very Large Array (VLA). An integration of the radio upper limit from to Hz with an assumed flux density and spectral index of 0.4 implies a a radio luminosity upper limit ergs s-1. We note that such low value is not unprecedented for the emission of PWNe in radio (Frail & Scharringhausen, 1997).
It is only when one turns to the spectral properties of the source that a potential problem arises. A pure synchrotron model, the spectrum should be characterized by a power-law spectrum with photon indices (Gaensler & Slane, 2006). The power-law fit of the observed spectrum from ‘The Stem’ gives consistent with a rather steep electron spectral index . As a possible way out of this challenge, we postulate that the observed X-ray spectrum most likely comprises a complicated mixture of non-thermal and thermal components of the as-yet unresolved X-ray point-like source powering the nebula. We point out that a two-component model consisting of a blackbody plus a power-law component requires a non-thermal to thermal flux ratio (0.3–8 keV) in the range of . Such ratio is consistent with that observed for rotation-powered pulsars (Cheng, Taam, & Wang, 2004).
Previous X-ray observations of PWNe have also shown that the pulsar itself is usually revealed as a point source within the nebular morphology (Gaensler & Slane, 2006). In this instance, it is possible that the pulsar itself is disguised by an overluminous clump of extended emission. Otherwise, the pulsar might have moved well outside the observed pulsar wind nebula. Moving with a transverse velocity 500 km s-1, it would require the pulsar at least yr to reach the edge and even longer to disappear from the vicinity of the PWN. As stated earlier, deeper X-ray observations are needed to clarify these alternatives.
On the basis of a PWN interpretation, ‘The Stem’ immediately becomes a potential counterpart candidate of the unidentified Fermi -ray source 0FGL J1848.6-0138 (Abdo et al., 2009a) and more loosely HESS J1848–018 (Chaves et al., 2008). A previous multiwavelength search of the error Fermi 95-percent confidence error contour of 0FGL J1848.6-0138 failed to produce any prominent counterpart candidate of the unidentified -ray source (Luque-Escamilla et al., 2009). Considering that a remarkable number of pulsar PWNe have been found to be coincident with both EGRET and Fermi error contours (Roberts et al., 2005; Abdo et al., 2009a), it is conceivable that ‘The Stem’ is powering the -ray emission. Provided that the ratio of X-ray luminosity to spin-down power Ė lies in the range – (Halpern et al., 2001), the hypothesized spin-down power of ‘The Stem’ pulsar should be – ergs s-1. These values of Ė are consistent with the range derived among the -ray pulsars discovered by Fermi (Abdo et al., 2009b).
Though this scenario appears feasible, it is important to realize that ‘The Stem’ is located at the tangent point of the Crux-Scutum spiral arm where there is a high density of unusual sources (Vallée, 2008). As a result, we warn that it will be difficult to prove a direct association with any -ray source in this region.
4.2 A globular cluster being stripped by the Galactic plane?
Possibly the greatest challenge to the preceding explanation is the odd placement of ‘The Stem’ in the outskirts of the globular cluster GLIMPSE-C01. A typical globular cluster is expected to accumulate – of gas mainly due to mass-loss from red giant and asymptotic giant branch stars within the cluster (Rood, 1973). Despite dedicated efforts in mapping globular clusters, an actual detection of this hypothesized intracluster gas remains elusive (van Loon et al., 2006). In order to explain the observed discrepancy, it has been suggested that most of the hypothesized intracluster gas could be shed during globular cluster passages through the Galactic plane (Frank & Gisler, 1976; Faulkner & Smith, 1991).
Since globular clusters are predicted to be moving at velocities 100–300 km s-1, a particular associated prediction is that a bow shock should form at the interaction of the intracluster gas and the ISM. Yet, X-ray imaging have failed to find definite observational evidence for such interactions (Krockenberger & Grindlay, 1995; Hopwood et al., 2000; Okada et al., 2007). We argue that previous attempts to locate bow shocks have failed mainly due to two effects: (1) the majority of globular clusters reside within the low-density Galactic halo and (2) the waiting time for a future Galactic plane passage ( yr) is largely unpractical relative to a typical human lifetime.
At a low Galactic latitude , GLIMPSE-C01 is ideally placed to search for such an encounter. Interestingly, ‘The Stem’ coincides nicely with a continuous infrared morphology growing out of the main infrared plume (see Figure 5). In fact, Kobulnicky et al. (2005) originally suggested that much of the extension of GLIMPSE-01 both in infrared and submillimeter could be connected with intracluster debris stripped by the Galactic ISM. However, these authors lacked the X-ray imaging that could directly trace the bow shock from such interaction.
When a moving object interacts supersonically with the ambient medium, one would expect the formation of a nebula with cometary morphology including a ‘head’ and a ‘fan-like tail’ (Olbert et al., 2001). In our case, the X-ray image displays an enhanced region (‘The Stem’) that could only correspond the apex of the interaction (‘head’). However, we find no evidence for the expected cometary morphology. An ellipse fit to ‘The Stem’ in the Chandra image gives an ellipticity of 0.64. For comparison, a fit of the correponsing infrared contour in the Spitzer image indicates an ellipticity of 0.44 nearly aligned with the X-ray shape. The consistency of the position angles derived in X-rays and infrared favors the physical association of ‘The Stem’ with GLIMPSE-C01. Given the latter consideration, deeper observations are needed to confirm or rule out the presence of low-level cometary structure surrounding ‘The Stem’.
If we adopt the bow shock interpretation, ‘The Stem’ would mark the apex of latest impact (moving south-north in galactic coordinates). Accepting this hypothesis, the stand-off distance of the bow shock can be approximated from the balance between the medium ram pressure and the momentum flux of the stellar winds associated with red giant and asymptotic giant branch stars in the cluster,
| (1) |
for a stellar mass-loss rate = yr-1 , mass-loss velocity = 100 km s-1, globular-cluster velocity = 100 km s-1, and ISM density g cm-3 (where corresponds to the ambient ISM density). The derived stand-off distance is compatible with the observed location of the ‘The Stem’ at pc from the center of the cluster. In this interpretation, the low-level emission regions around X2 could be consistent with ISM that was previously impacted and now forms a trail of shocked gas (Figure 1).
Next, we need to evaluate the energetic budget of the bow shock. Faulkner & Smith (1991) have already provided excellent estimates to compute the X-ray luminosity that can be emitted in bow shocks around a globular cluster. The actual energy input associated with the globular cluster can written as
| (2) |
using = yr-1, = 100 km s-1, and = 100 km s-1. With average densities 0.1–1 cm-3 along the Galactic plane, Krockenberger & Grindlay (1995) estimated that the corresponding fraction of the energy input that could be transferred to X-ray emission lies between 10-4 and 0.1 of . Converting implies an X-ray luminosity in the range – ergs s-1 of the total. This range nicely brackets the derived X-ray luminosity ergs s-1 at the distance of GLIMPSE-C01.
Spectrally, the interpretation is more complicated. Postshock temperatures from a bow shock are expected to be K, where is the velocity of the cluster in units of 100 km s-1 (Krockenberger & Grindlay, 1995). X-ray photons at this temperature would be most abundant in the 0.1–0.5 keV band. Instead, the X-ray temperature derived from Raymond-Smith fit (Raymond & Smith, 1977) to the ‘The Stem’ indicates much harder emission with . The same applies to the X2 region that is most prominent in the the 2–5 keV band. Assuming that the X-ray emission is thermal in origin, such high temperature would require a globular cluster moving at an unrealistic 1,000 km s-1.
Krockenberger & Grindlay (1995) argued that the hard X-ray emission may instead be formed by non-thermal emission generated as relativistic electrons in the bow shock inverse Compton scatter cluster photons to harder X-ray energies. Coincidentally, a fraction of the unresolved emission detected near the centre is generally hard (see Figure 2). This supply of ‘hard’ photons from the cluster core could potentially scatter off electrons accelerated within the shock. However, it is not entirely clear that there are enough mildly relativistic electrons within the cluster to support this process (Krockenberger & Grindlay, 1995).
Alternatively, the hard emission could be due to non-thermal bremsstrahlung produced by a population of suprathermal electrons at the bow shock (Okada et al., 2007). Measurements near the Earth’s bow shock have revealed such population of suprathermal electrons in the 1–20 keV range with a power-law spectrum of index (Gosling et al., 1989). The biggest uncertainty in this scenario is the actual number of suprathermal electrons carried by the bow shock. In order to estimate the required value, Okada et al. (2007) obtained an expression that relates the number of suprathermal electrons in the bow shock to X-ray luminosity given by ergs s-1, where denotes the total number of suprathermal electrons in units of . This estimate implies that a population of suprathermal electrons must be available across the bow shock to reproduce the observed emission.
Assuming that the bow shock covers 10 percent of a sphere of 9 radius (where pc represents the core radius) with an annulus width of 0.2 pc, we find a maximum of suprathermal electrons given by . Here, represents the fraction of suprathermal electrons associated with the bow shock. Using the estimate by Okada et al. (2007), we find that a value of is required. As previously stated, it is difficult to estimate and directly from the data. Therefore, future X-ray observations and modelling must clarify this issue.
We close by noting that numerous models have been investigated to explain the evacuation of gas from globular clusters (Spergel, 1991; Freire et al., 2001). However, if the bow shock interpretation of ‘The Stem’ is correct, these observations would provide direct evidence of a mechanism for removing intracluster gas on Galactic scales. Under this scenario, the vast amount of stellar ejecta accumulated during the orbit of the globular cluster would be stripped during successive passages through the ISM in the Galactic plane.
4.3 Alternative explanations
Because we cannot directly derive a distance to the source of extended emission, there is always a chance that ‘The Stem’ is produced by a foreground or background source completely unrelated to a PWN or a globular cluster passage. Spectral fitting with an absorbed MEKAL component (Mewe et al., 1995), commonly used to describe gas in galaxy clusters, results in an unacceptable . Furthermore, the positional coincidence between the X-ray and infrared images, alongside the high extinction estimated for this line of sight (Kobulnicky et al., 2005) most likely rules out an extragalactic origin for the X-ray emission.
Probably, the only outstanding explanation is a non-thermal radio filament (Yusef-Zadeh, Morris, & Chance, 1984). However, we find such possibility unlikely as no prominent radio-emitting filament has been revealed in this general region. Nevertheless, since none of the proposed explanations has been proven conclusively, it is important to leave open the option of a new type of X-ray source with unique properties. Perhaps a novel emitter remains to be found, but such issue is beyond the scope of this work.
5 Conclusions and Future Work
In view of our discussion, two leading explanations emerge to explain the source of extended emission in the outskirts of GLIMPSE-CO1. First, based purely on its purported X-ray luminosity and physical size, ‘The Stem’ may represent a PWN lacking a central point-like source. If so, ‘The Stem’ becomes the most notable object in the 95-percent confidence error contour of unidentified Fermi source 0FGL J1848.6-0138. The alternative model, a potentially more intriguing explanation for the extended source of emission, is that ‘The Stem’ traces back to a bow shock produced as the globular cluster GLIMPSE-C01 passes through the Galactic plane. If confirmed, the latter explanation would indicate that GLIMPSE-C01 is losing part of its intracluster gas in the process. More generally, it would provide evidence of the systematic stripping of intracluster gas on Galactic scales long predicted by a number of theoretical models. However, given the unusual nature of this source, it is also possible that ‘The Stem’ represents a new type of X-ray emitter.
With these findings at hand, it is critical to determine the radial velocity and proper motion of GLIMPSE-C01 through alternative means. In addition, deeper X-ray observations of this region are needed to refine the current modelling of the X-ray emission. We envision two vital tests that may conclusively trim these models. First, the orbit of the GLIMPSE-C01 must agree with the placement of the purported bow shock. Second, radio/X-ray pulsation searches must aim for a pulsar within the extended emission and place stricter constraints on the radio component. Given the heavy crowding around this region, we believe that GLIMPSE-C01 makes an exquisite target for the newly refurbished Hubble Space Telescope that would result in the most accurate proper motion measurements of the globular cluster.
Acknowledgments
I thank Fernando Camilo, Eric Gotthelf, Jules Halpern and Daniel Nieto for useful comments. I am also grateful to the referee for suggestions that helped to improve the article. I acknowledge support from the Spanish Ministry of Science and Technology through a Ramón y Cajal fellowship.
References
- Abdo et al. (2009a) Abdo A. A., Ackermann M., Ajello M. et al., 2009a, ApJS, 183, 46
- Abdo et al. (2009b) Abdo A. A., Ackermann M., Ajello M. et al., 2009b, Science, 325, 840
- Anderson et al. (2003) Anderson J., Cool A. M., King I. R., 2003, ApJ, 597, L137
- Becker & Trumper (1997) Becker W., Trumper J., 1997, A&A, 326, 682
- Chaves et al. (2008) Chaves R. C. G., Renaud M., Lemoine-Goumard M., Goret P., 2008, AIP Conf. Proc. 1085, High Energy Gamma-ray Astronomy: Proceedings of the 4th International Meeting on High Energy Gamma-ray Astronomy, Melville, p. 1085
- Cheng, Taam, & Wang (2004) Cheng K. S., Taam R. E, Wang W., 2004, ApJ, 617, 480
- Faulkner & Smith (1991) Faulkner D. J., Smith, G. H., 1991, ApJ, 380, 441
- Frail & Scharringhausen (1997) Frail D. A., Scharringhausen B. R., 1997, ApJ, 480, 364
- Frank & Gisler (1976) Frank J., Gisler G., 1976, MNRAS, 176, 533
- Freire et al. (2001) Freire P. C., Kramer M., Lyne A. G., Camilo F., Manchester R. N., D’Amico, N., 2001, ApJ 557, L105
- Gaensler & Slane (2006) Gaensler B. M., Slane P. O., 2006, ARA&A, 44, 17
- Giacconi et al. (1971) Giacconi R., Kellogg E. M., Gorenstein P., Gursky H., Tananbaum H., 1971, ApJ, 165, L27
- Giacconi et al. (1979) Giacconi R., Branduardi G., Briel U. et al., 1979, ApJ, 230, 540
- Gosling et al. (1989) Gosling J. T., Thomsen M. F., Bame S. J., Russell, C. T., 1989, J. Geophys. Res., 94, 10011
- Grindlay et al. (2005) Grindlay J. E., Hong J., Zhao P. et al., 2005, ApJ, 635, 920
- Halpern et al. (2001) Halpern J. P., Camilo F., Gotthelf E. V. et al. 2001, ApJ, 552, L125
- Hopwood et al. (2000) Hopwood M. E. L., 2000, MNRAS, 316, L5
- Kobulnicky et al. (2005) Kobulnicky H. A., Monson A. J., Buckalew B. A. et al., 2005, ApJ, 129, 239
- Krockenberger & Grindlay (1995) Krockenberger M., Grindlay J. E., 1995, ApJ, 451, 200
- Luque-Escamilla et al. (2009) Luque-Escamilla P. L., Marti J., Munoz-Arjonilla A. J., Sanchez-Sutin J. R., Combi J. A., Sanchez-Ayaso E., 2009, A&A, accepted (arXiv:0909.2520)
- Markevitch et al. (2002) Markevitch M., Gonzalez A. H., Davis L. et al., 2002, ApJ, 567, L27
- Mewe et al. (1995) Mewe R., Kaastra J., Liedahl D., 1995, Legacy, 6, 16
- Mirabal (2009) Mirabal, N. 2009, submitted (arXiv0908.1389)
- Motch et al. (2003) Motch C., Herent O., Guillout et al. 2003, AN, 324, 61
- Muno et al. (2008) Muno M. P., Baganoff F. K., Brandt W. N., Morris M. R., Starck J. -L., 2008, ApJ, 673, 251
- Okada et al. (2007) Okada Y., Kokubun M., Yuasa T., Makishima K., 2007, PASJ, 59, 727
- Olbert et al. (2001) Olbert C. M., Clearfield C. R., Williams N. E., Keohane J. W., Frail D. A., 2001, ApJ, 554, L205
- Pfahl, Rappaport, & Podsiadlowski (2002) Pfahl E., Rappaport S., Podsiadlowski P., 2002, ApJ, 573, 283
- Pooley et al. (2007) Pooley D., Rappaport S., Levine A., Pfahl E., Schwab J., 2007, ApJ, submitted (arXiv:0708.3365)
- Raymond & Smith (1977) Raymond J. C., Smith, B. W., 1977, ApJS, 35, 419
- Roberts et al. (2005) Roberts M. S. E., Brogan C. L., Gaensler B. M., Hessels J. W. T., Ng C.-Y., Romani, R. W., 2005, Ap&SS, 297, 93
- Rood (1973) Rood R. T., 1973, ApJ, 184, 815
- Simpson & Cotera (2004) Simpson J. P., Cotera A. S., 2004, BAAS, 204, No. 45.01.
- Spergel (1991) Spergel D. N., 1991, Nature, 352, 221
- Tanaka, Inoue, & Holt (1994) Tanaka Y., Inoue H., Holt S. S., 1994, PASJ, 46, L37
- Vallée (2008) Vallée J. P., 2008, AJ, 135, 1301
- van Loon et al. (2006) van Loon J. Th., Stanimirović S., Evans A., Muller, E., 2006, MNRAS, 365, 1277
- Voges et al. (1999) Voges W., Aschenbach B., Boller Th. et al., 1999, A&A, 349, 389
- Wang, Gotthelf, & Lang (2002) Wang Q. D., Gotthelf E. V., Lang, C. C., 2002, Nature, 415, 148
- Yusef-Zadeh, Morris, & Chance (1984) Yusef-Zadeh F., Morris M., Chance D., 1984, Nature, 310, 557