Is the black hole in GX 339-4 really spinning rapidly?
Abstract
The wide-band Suzaku spectra of the black hole binary GX 3394, acquired in 2007 February during the Very High state, were reanalyzed. Effects of event pileup (significant within of the image center) and telemetry saturation of the XIS data were carefully considered. The source was detected up to keV, with an unabsorbed 0.5–200 keV luminosity of erg s-1 at 8 kpc. The spectrum can be approximated by a power-law of photon index 2.7, with a mild soft excess and a hard X-ray hump. When using the XIS data outside of the image center, the Fe-K line appeared extremely broad, suggesting a high black hole spin as already reported by Miller et al. (2008) based on the same Suzaku data and other CCD data. When the XIS data accumulation is further limited to to avoid event pileup, the Fe-K profile becomes narrower, and there appears a marginally better solution that suggests the inner disk radius to be times the gravitational radius (1-sigma), though a maximally spinning black hole is still allowed by the data at the 90% confidence level. Consistently, the optically-thick accretion disk is inferred to be truncated at a radius times the gravitational radius. Thus, the Suzaku data allow an alternative explanation without invoking a rapidly spinning black hole. This inference is further supported by the disk radius measured previously in the High/Soft state.
Subject headings:
stars: individual (GX 339-4) — X-rays: binaries1. INTRODUCTION
One of the current issues in black hole (BH) research is to measure the spin parameter, . This is possible if we can estimate the radius of the innermost stable orbit , which decreases from ( being the gravitational radius) down to 1.235 as increases from 0 to 1. A traditional method of measuring of black-hole binaries (BHBs) is to parameterize the optically-thick disk emission component in their X-ray spectra in terms of the disk-blackbody (diskBB) model (Mitsuda et al. 1984). First applied successfully to GX 339-4 (Makishima et al. 1986) and LMC X-3 (Ebisawa et al. 1993), this method has been calibrated using BH masses estimated from companion star kinematics, and confirmed to give reliable (e.g., within %) estimates of (Makishima et al. 2000) if distance uncertainties can be neglected.
A more modern way to estimate , applicable also to active galactic nuclei, is to utilize iron line profiles, which become broadened and skewed due to stronger relativistic effects as increases (e.g., Fabian et al. 1989). First found from the Seyfert galaxy MCG–6-30-15 by ASCA (Tanaka et al. 1995), the broad Fe-K lines were later reported in a number of Seyferts using, e.g., XMM-Newton (Nandra et al. 2007). The latest Suzaku results on MCG–6-30-15 indicate a high spin parameter of (Miniutti et al. 2007).
Similar high values of were derived from BHBs (Miller 2007, Miller et al. 2009), including GX 3394 observed with XMM-Newton and Chandra (Miller et al. 2004ab). Analyzing the Suzaku data of this BHB acquired in 2007 February, Miller et al. (2008), hereafter MEA08, confirmed the broad Fe-K feature, and argued that the object is an extreme Kerr BH with .
The wide-band Suzaku spectra of Cyg X-1 in the Low/Hard state (LHS), in contrast, gave (Makishima et al. 2008), via both the disk emission analysis and the Fe-K line modeling. Likewise, was obtained from the Suzaku data of GRO 1655-40 (Takahashi et al. 2008). Also, a 2–20 keV Tenma observation of GX 3394 (Makishima et al. 1986) in the High/Soft state (HSS), with dominant disk emission, gave km, or times ; here , is the distance in 8 kpc (Zdziarski et al. 2004), is the BH mass in units of a typical value of (Hynes et al. 2004), and was recalculated applying a correction factor of 1.18 (Kubota et al. 1998; Makishima et al. 2000) and assuming an inclination of (Gallo et al. 2004). These results imply .
To examine these apparent discrepancies on , we reanalyzed the same Suzaku data of GX 339-4 as MEA03, and found that the X-ray Imaging Spectrometer (XIS; Koyama et al. 2008) events suffer heavy pileup and telemetry saturation. These effects, neglected by MEA08, distort the continuum, and indirectly affect the Fe-K line shape.
2. OBSERVATION
The present Suzaku data of GX 3394, as used by MEA08, were obtained on 2007 February 12, during an outburst which started in late 2006 (Swank et al. 2006). The XIS employed the 1/4 window option and a burst option (0.3 sec for XIS0/XIS1, and 0.5 sec for XIS3), to achieve a time resolution of 2 sec and a duty cycle of 15% or 25%. The Hard X-ray Detector (HXD; Kokubun et al. 2008) was operated in the standard mode. The data processing and reduction were performed in the same way as MEA08, using the Suzaku pipeline processing ver. 2.0.6.13.
In spite of the 1/4 window and burst options,
the XIS events piled up significantly (§ 3.1)
as the source was very bright
( Crab in the 2–10 keV Suzaku band).
In fact, the unscreened XIS event file contains
an unusually high fraction of Grade 1 events,
which are produced when pileup occurs.111http://www.astro.isas.ac.jp/suzaku/analysis/xis/pileup/
HowToCheckPileup_v1.pdf.
In addition, a variable fraction of the CCD frame was
often lost due to telemetry saturation;
this affects the absolute XIS flux.
Out of the 10.3 ks of XIS0 exposure,
only 2.84 ks was free from this problem.
The HXD-PIN and HXD-GSO spectra, acquired for a net exposure of 87.9 ks, were corrected for small dead times, but no other correction due to the source brightness was necessary. We subtracted modeled non X-ray backgrounds (NXBs; Fukazawa et al. 2009). The cosmic X-ray background, of the total counts, was ignored. By analyzing the HXD data acquired during Earth occultations, we confirmed the NXB models to reproduce the PIN and GSO data to within 1%, a typical accuracy level (Fukazawa et al. 2009). Since the signal becomes comparable to this uncertainty at 300 keV, we quote the source detection up to keV.
In the present Letter, we use data from XIS0, HXD-PIN, and HXD-GSO. We do not use data from XIS1 or XIS3, which are affected more by pileup than XIS0. Unless otherwise stated, errors refer to 90% confidence limits.
3. DATA ANALYSIS AND RESULTS
3.1. Effects of event pileup and telemetry saturation
To examine in detail the XIS0 data for pileup effects, we produced a radial count-rate profile from a 0.5–10.0 keV XIS0 image (discarding telemetry-saturated frames), and compared it with that of a pileup-free point source, i.e., MCG–6-30-15 observed on 2005 August 17. The profile ratio between GX 3394 and MCG–6-30-15 decreases significantly within a radius of of the image centroid, reaching at the center of the ratio at . Therefore, the XIS0 data are affected by pileup at least within , and possibly up to .
Figure 1 shows XIS0 spectra of GX 3394, accumulated over different annuli around the source, and divided by that outside to visualize shape changes. Pileup thus affects the 1-10 keV continuum shape, and produces line-like features at 1.8 and 2.2 keV. Although MEA08 attributed the line features to response uncertainties, it fails to explain the fact that the line strength increases inwards. These features, appearing at the Si-K edge in the XIS and the Au M-edge in the X-ray Telescope (Serlemitsos et al. 2007), are due to rapid changes of the instrumental response coupled with pileup.
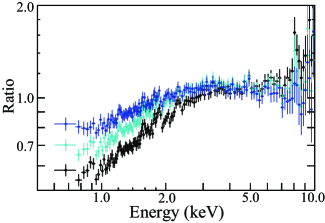
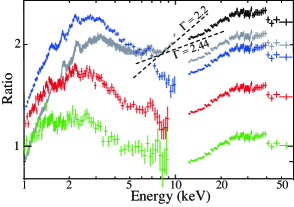
Figure 2 shows raw XIS0 spectra accumulated from different annular regions of the image, including telemetry-saturated frames, and corrected for neither pileup nor live-time fraction. They are shown divided by a powerlaw (PL) prediction, which is calculated using respective ARFs (Ishisaki et al. 2007) that properly consider the fractional photons falling therein. In all cases, the PL was chosen to have (which approximates the average 2–50 keV spectral slope), and a common normalization of 5 ph cm-2 keV-1 s-1, absorbed by a column of cm-2. Towards the image centroid, the continua are severely distorted by event pileup. In addition, the spectral ratio decreases towards outer regions, which suffer increasingly from the telemetry saturation. The live-time fractions of XIS0 are 85%, 79%, 60%, and 43%, from the inner to outer annuli.
In Figure 2, the NXB-subtracted HXD-PIN spectrum is shown in black. It is further repeated four times, but scaled by the XIS live-time fractions so that a pair of XIS and HXD-PIN spectra with the same color should match. MEA08 used the grey XIS0 spectrum and the black HXD-PIN data, but even putting aside the pileup distortions, this is an incorrect combination. In MEA08, the XIS and HXD-PIN data points match rather accidentally, because pileup (which increases the highest XIS spectral end) and the telemetry saturation (which reduces the XIS normalization) have opposite effects.
3.2. Analysis of the spectra
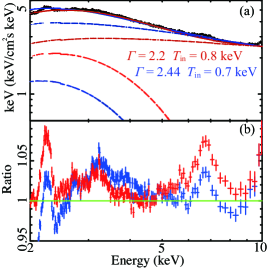
We tentatively fitted the raw XIS0 spectrum from (grey one in Figure 2), with a PL plus diskBB model, but ignoring the 4–7 keV range as MEA08 did. When using the PL photon index of which MEA08 (supplemented by Miller 2009) found for XIS data, the diskBB temperature was keV (shown in Figure 3 (a) in red). The ratio plot (shown in Figure 3 (b) also in red) reveals the broad Fe-K line feature reported by MEA08. However, the feature becomes much narrower and weaker (blue crosses), if we employ which is close to the value of used by Miller (2009) for the HXD-PIN data. In this case, keV. Thus, the large Fe-K line width claimed by MEA08 depends on the employed continuum slopes, which are also indicated in Figure 2. In fact, the slope should not differ by between the XIS and PIN (suzaku memo-2008-06).
3.3. Analysis of the spectra
Discarding the region where the pileup effects are severe, we jointly fit the “blue” pair of XIS0 and HXD-PIN spectra in Figure 2, in the 2.4–9.0 keV and 13.0–60.0 keV ranges, respectively. Though still piled up, this XIS0 spectrum () retains high signal statistics.
The spectra in Figure 2 exhibit a soft ( keV) and a hard (20–40 keV) hump, and an Fe-K emission line, as found before (Zdziarski et al. 1998; Ueda et al. 1993). We hence employed a model consisting of a diskBB, a PL, the associated ionized reflection pexriv (Magdziarz & Zdziarski 1994), and a laor (Loar 1991) model for the Fe-K line with the emissivity index fixed at and the outer disk radius at . The metal abundances in pexriv were fixed to solar values except that of iron (), while the disk inclination was allowed to vary over . The “constant” parameter was set at (the live-time fraction), for XIS0 with a tolerance of , while at 1.07 (Suzaku memo 2007-11) for HXD-PIN. We left free all the other model parameters, including the absorbing column .
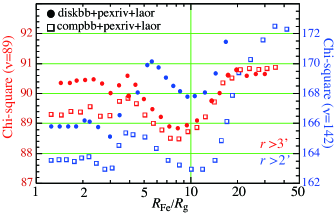
The fit was acceptable, and behaved as shown by filled blue circles in Figure 4 as a function of the laor inner radius, . We thus find , which is consistent with the conclusion of MEA08. The other parameters are: , , keV, the pexriv solid angle fraction , its ionization parameter , and . Fixing worsened the fit by . The laor rest-frame energy was keV, and its inclination . However, the Fe-K equivalent width (EW), eV, much exceeds the value of eV (George & Fabian 1991) predicted by the derived , , and .
The steep slope of indicates that the source was in the Very High state (VHS; Miyamoto et al. 1993), wherein the disk emission must be Comptonized (Kubota & Makishima 2004). We hence replaced diskbb with a Comptonized blackbody, compbb; the photon source it assumes, a single blackbody, may be reconciled with the multi-color diskbb formalism by the free . The results of this analysis are given in Figure 4 by open blue squares. Thus, the local minimum at , which existed in the diskbb modeling, became as good as the small- solution. This large- solution is characterized by a blackbody temperature of keV, a Compton optical depth of , an electron temperature of keV, keV and . Again, we find that the Fe-line solutions are degenerate, depending on the continuum choice.
3.4. Analysis of the spectra
We finally analyze the “red” spectra in Figure 2 in the same way as in § 3.3, under a constraint of . Although this XIS0 spectrum ( is estimated to be still weakly () piled up, we do not correct for this, because no established method is available yet. The HXD data are the same as in § 3.3. In advance, the red XIS0 spectrum and that of XIS3 from , where the count rates are comparable, were confirmed to have a constant ratio within . We also confirmed with the MCG–6-30-15 data that XIS spectra from these outer regions have a constant (within ) ratios to those from the image core.
As shown in Figure 4 in red, the results from the diskbb and compbb modeling agree better than for 2, with for compbb. Below, we examine the diskbb+pexriv+laor fit (filled red circles). In contrast to the “blue” spectra (§ 3.3), the data now prefer the small- solution as (with minimum at 8.2) at 68% confidence, although is unconstrained at 90% level due to poor statistics. The other parameters are: keV, , , , cm-2, and (the entire range of – is allowed at the 90 % confidence). The line energy keV is consistent with the derived range of . The Fe-line EW, eV, is also now in agreement with the prediction ( eV) from , , and . Employing and the correction factor 1.18 (§ 1), the diskbb normalization yields km, or . The results remain largely unchanged when fixing at 1.0.
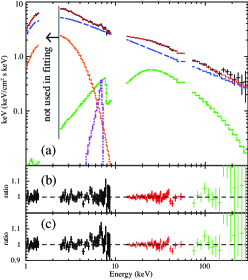
As shown in Figure 5(a), the best-fit model has been extended to incorporate the 70–300 keV HXD-GSO data, resulting in an acceptable () simultaneous fit. The model parameters have remained unchanged within their statistical errors. Panels (b) and (c) therein show the fit residuals. We tried a simple continuum blurring, and found no important change, but we defer detailed analysis to later work.
4. DISCUSSION
We reanalyzed the Suzaku XIS0 and HXD data of GX 339 acquired in the 2007 VHS. When the disk emission was modeled with diskbb, the “blue” XIS0 spectrum, using , gave a small Fe-K inner radius as (§ 3.3). Although this apparently reconfirms the high BH spin by MEA08, the Fe line EW is too large (§3.3). In addition, a large- () solution is also allowed when considering disk Comptonization that is usually the case in the VHS. Thus, the Fe line shapes degenerate, depending on the continuum modeling.
To further eliminate the XIS pileup effects, we utilized the “red” XIS0 spectrum from (§3.4). Then, the diskbb and compbb results became more consistent. Importantly, the large- solution (e.g., at ), are preferred, although the small- solution still remains valid at the 90% confidence level. The implied Fe-K line EW and the center energy are consistent with the reflection parameters (§3.4).
Assuming isotropic emission, the 0.5–200 keV luminosity is erg s-1, or times the Eddington limit (). Since the VHS have so far been observed in other sources over a typical luminosity range of (Kubota & Makishima 2004), this indicates , or . Considering extreme BH masses of () and (), we then obtain .
The diskbb radius , found in § 3.4, is in fact a lower limit, because a significant fraction of disk photons will be Comptonized into the PL by hot electron clouds (Kubota & Makishima 2004). Then, the true disk area must be a sum of the diskBB area and that of the seed photon source. Since the 0.5–200 keV photon number in the PL component is times larger than that contained in the 0.5–10 keV diskBB emission, the estimated radius will increase by a factor of , to . The above estimated uncertainty in then yields . Since we derived this range assuming (or = 0.93), uncertainties in can increase the upper bound, but would not affect the lower bound by more than 7%.
The present Fe-line and diskbb analyses consistently suggest , and hence , in contrast to the value of by MEA08. If our interpretation is correct, GX 339-4 is inferred to be spinning only mildly (if at all), like Cyg X-1 (§ 1; Miller et al. 2009). In addition, the consistency between the two methods reconfirms that is relatively close to unity.
We must admit that the assumption of a single PL continuum down to keV might not be warranted. In that sense, the value of (§ 1) measured with Tenma is more reliable, since it was obtained in the HSS where the spectral modeling is much less ambiguous, and by a non-CCD instrument that is free from any pileup. This, together with our estimates on , further argues against the large spin parameters.
So far, large values of were reported for GX 3394 based on Chandra data, and from XMM-Newton plus RXTE (Miller et al. 2004ab, and Reis et al. 2008). However, these measurements have not been examined for systematic effects due to the continuum choice employed therein. In addition, the former may be limited by the continuum bandwidth, and the latter could be still subject to CCD pileup.
The authors would like to express their thanks to the Suzaku team members and an anonymous referee who gave us valuable comments. The present work was supported by Grant-in-Aid for JSPS Fellows.
References
- (1) Ebisawa, K., et al. 1993, ApJ, 403, 684
- (2) Fabian, A. C., Rees, M. J., Stella, L., & White, N. E. 1989, MNRAS, 238, 729
- (3) Fukazawa Y. et al. 2009, PASJ, 61, S17
- (4) Gallo, E., Corbel, S., Fender, R., Maccarone, T., & Tzioumis, A. 2004, MNRAS 347, L52
- (5) George, I. M., & Fabian, A. C. 1991, MNRAS, 249, 352
- (6) Hynes, R. I., Steeghs, D., Casares, J., Charles, P. A., & O’Brien, K. 2004, ApJ, 609, 317
- (7) Ishisaki, Y., et al 2007, PASJ, 59, 113
- (8) Kokubun, M. et al. 2007, PASJ, 59, S53
- (9) Koyama, K., et al. 2007, PASJ, 59, S23
- (10) Kubota, A., & Makishima, K. 2004, ApJ, 601, 428
- (11) Kubota, A., et al. 1998, PASJ, 50, 667
- (12) Laor, A et al. 1991, ApJ, 90L, 376
- Magdziarz & Zdziarski (1995) Magdziarz, M., & Zdziarski, A. 1995, MNRAS, 273, 837
- Makishima et al. (1986) Makishima, K., et al. 1986, ApJ, 308, 635
- Makishima (2000) Makishima, K., et al. 2000, ApJ, 535, 632
- Makishima (2008) Makishima, K., et al. 2008, PASJ, 60, 585
- Miller et al. (2007) Miller, J. M. 2007, ARA&A, 45, 1, 441
- Miller et al. (2009) Miller, J. M. 2009, Atel, 1966
- (19) Miller, J. M., et al. 2004a, ApJ, 601, 450
- (20) Miller, J. M., et al. 2004b, ApJL, 606, 131
- Miller et al. (2008) Miller, J. M., et al. 2008, ApJ, 679, 113 (MEA08)
- Miller et al. (2004) Miller, J., Reyolds, C., Fabian, A., Miniutti, G., & Gallo, L. 2009, ApJ, 697, 900
- Miniutti (2007) Miniutti, G., et al. 2007, PASJ, 59, 315
- Mitsuda et al. (1984) Mitsuda, K., et al. 1984, PASJ, 36, 741
- Miyamoto et al. (1991) Miyamoto, S., Kimura, K., Kitamoto, S., Dotani, T., & Ebisawa, K. 1991, ApJ, 383, 784
- Nandra (2007) Nandra, K., O’Neill, P. M., George, I. M., & Reeves, J. N. 2007, MNRAS, 382, 1, 194
- (27) Reis, R. C., Fabian, A. C., Ross, R. R., Miniutti, G., Miller, J. M., Reynolds, C., 2008, MNRAS, 387, 1289
- (28) Serlemitsos, P. J., et al. 2007, PASJ, 59, 9
- (29) Swank, J. H., Smith, E. A., Smith, D. M., Markwardt, C. B. 2006, ATel, 944, 1
- (30) Tanaka, Y,. et al. 1995, Nature, 375, 659
- (31) Takahashi, H., et al. 2008, PASJ, 60, 69
- (32) Ueda, Y., Ebisawa, K., & Done, C. 1993, PASJ, 46, 107
- (33) Zdziarski, A., et al. 1998, MNRAS, 301, 435
- (34) Zdziarski, A., et al. 2004, MNRAS, 351, 791