Out-of-plane nesting driven spin spiral in ultrathin Fe/Cu(001) films
Abstract
Epitaxial ultrathin Fe films on fcc Cu(001) exhibit a spin spiral (SS), in contrast to the ferromagnetism of bulk bcc Fe. We study the in-plane and out-of-plane Fermi surfaces (FSs) of the SS in 8 monolayer Fe/Cu(001) films using energy dependent soft x-ray momentum-resolved photoemission spectroscopy. We show that the SS originates in nested regions confined to out-of-plane FSs, which are drastically modified compared to in-plane FSs. From precise reciprocal space maps in successive zones, we obtain the associated real space compressive strain of 1.50.5% along -axis. An autocorrelation analysis quantifies the incommensurate ordering vector =(2)(0,0,0.86), favoring a SS and consistent with magneto-optic Kerr effect experiments. The results reveal the importance of in-plane and out-of-plane FS mapping for ultrathin films.
Fe metal is delicately perched on a magneto-structural instability, with antiferromagnetic Cr and Mn to its left, and ferromagnetic Co and Ni to its right in the periodic table. In spite of its high ferromagnetic Curie temperature (=1043 K) and large magnetic moment (=2.22 ) in its bulk body-centered-cubic (bcc) form, theoretical studies have predicted face-centered-cubic (fcc) Fe to be nonmagnetic, ferromagnetic, antiferromagnetic or exhibit a spin spiral (SS: corresponding to a periodic variation of the angle of the spins), sensitively depending on its lattice parameter Herring1966 ; Wang1985 ; Uhl1992 ; Korling1996 . The phase diagram of Fe metal is indeed very rich with, (1) the bcc to fcc Bain transformation at 1184 K Okatov2009 , (2) a hexagonal-close-packed (hcp) non-magnetic phase at high pressure (P) and low temperature (T) which shows superconductivity Shimizu2001 , while (3) the high-P, high-T phase was debated in terms of a hcp or orthorhombic structure Dubrovinsky1998 . Also, fcc Fe nanoparticle precipitates (diameter 50 nm) stabilized in a Cu matrix shows a SS state with an ordering vector = (2)(0.12,0,1.0) and a low-spin moment (=0.7 ) per atom Tsunoda1989 ; Tsunoda1993 . Remarkable progress has been achieved in understanding the interplay of crystal structure and electronic instabilities in realizing spin order and its influence on properties of complex materials such as multiferroic oxides, superconducting copper-oxides Ramesh2007 and iron-pnictides Zhao2008 , etc. Surprisingly, despite extensive efforts, the simpler SS associated with the bcc-fcc (-) transition in elemental Fe and its momentum-resolved electronic structure has remained a challenging unsolved problem for over 40 years Herring1966 .
In contrast to experiments at high-T, high-P or nanoparticles confined in a matrix, a simpler route was developed to study structure property correlations in Fe: Fe thin films grown epitaxially on fcc Cu(001) substrate Kief1993 ; Ellerbrock1995 ; Bernhard2005 ; Meyerheim2005 . Fe thin films on Cu(001) also show a complex magnetic and structural phase diagram Kief1993 ; Bernhard2005 ; Meyerheim2005 ; Li1994 ; Donath2009 and it is known that (1) Below 4 monolayers (MLs), it is ferromagnetic and has the face-centered-tetragonal (fct) structure (Region I). (2) Between 5–11 ML, it has the fcc structure and a SS, with a top bilayer which is ferromagnetic (Region II). The SS ordering T is 200 K Li1994 ; Qian2001 . (3) Above 12 ML, it transforms to the bulk ferromagnetic bcc structure (Region III). The SS phase of Region II is the focus in this work, and as determined by magneto-optic Kerr effect measurements, it has a SS ordering vector of = 2/2.6 or 2/2.7 (where is the interlayer distance of the Fe thin film) Li1994 ; Qian2001 . This corresponds to = (2)(0,0,0.75) (where = 2 is the lattice parameter of the Fe thin films). The magneto-optic Kerr effect (MOKE) experiments provided the (out-of-plane)-component of the SS vector and ruled out a type-1 antiferromagnetic structure. The obtained average magnetic moment per atom was 1.5 , significantly larger than for the nanoprecipitates Li1994 ; Qian2001 . A depth resolved X-ray magnetic circular dichroism study indicated a magnetic moment of 1.7 for the SS phase, thus confirming a clear difference compared to the nanoprecipitates Amemiya2004 . The possibility of a SS in fcc Fe has been extensively discussed from theory. The salient features for fcc Fe from theory indicates absence of Fermi surface (FS) nesting but allows for SSs with ordering vectors = (2)(0,0,0.6) or = (2)(0.5,0,1.0) Korling1996 ; Uhl1992 . Both these SSs show high-spin moment (1.5 ) and total energy considerations indicate is slightly more stable than . Also, a spin density wave (SDW: corresponding to a periodic modulation in the magnitude of collinear spins) was found to be extremely unfavourable compared to a non-collinear SS Spisak2002 . It is noted that and do not match with of the MOKE measurements. The most serious limitation to date, however, is the absence of experimental results relating the momentum () resolved electronic structure to the SS in epitaxial ultrathin Fe/Cu(001) films.
In order to make this connection, it is necessary to determine the in-plane and out-of-plane FSs of ultrathin Fe/Cu(001) films. While in-plane FSs are routinely measured with a fixed photon energy and angle-resolved photoemission spectroscopy (ARPES), the specific requirement of investigating the component of the SS in the out-of-plane FSs necessarily requires ARPES with tunable energy Venturini2008 ; Kamakura2006 . While crystalline order along the -axis has been reported for 6–8 ML Fe/Cu(001) films using surface diffraction Meyerheim2005 , the present experiments constitute the first out-of-plane FS measurements for ultrathin films. Early study of the thickness dependent valence band structure of Fe/Cu(001) films identified distinct changes at 5 ML thickness, the borderline of regions I and II Madjoe1999 . FS mapping carried out with a fixed energy ( = 75 eV), showed diffuse in-plane FSs which could not be satisfactorily explained by generalized gradient approximation band structure calculations of the bulk bcc or fcc structure. The added complication of the top ferromagnetic bilayer motivated our use of soft x-ray (SX)-ARPES as the technique of choice due to its larger probing depth, typically 10–20 Å. Recent studies using SX-ARPES have reported the 3-dimensional (D) momentum resolved electronic structure of solids Plucinski2008 ; Venturini2008 ; Kamakura2006 . In a very recent work, it was used to obtain the 3D charge density of bulk copper metal Mansson2008 . Hence, in comparison to low-energy ARPES, energy-dependent SX-ARPES ( 400–800 eV) is well-suited to investigate the 3D FSs of the SS phase in ultrathin Fe/Cu(001) films.
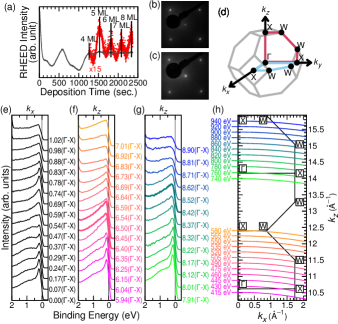
Epitaxial Fe films were grown on Cu(001) using electron beam deposition at room temperature (RT) EPAPS . The thickness of the Fe thin films was controlled to 8 ML by monitoring reflection high energy electron diffraction (RHEED) oscillations (Fig. 1(a)). The crystallinity and crystal orientation of the Cu(001) substrate and the deposited Fe thin films were measured by low energy electron diffraction (LEED) (Fig. 1(b) and (c), respectively). The RHEED oscillations and LEED patterns are in very good agreement with earlier work Li1994 ; Qian2001 ; Bernhard2005 , indicating the high quality of the epitaxial ultrathin 8 ML Fe/Cu(001) films.
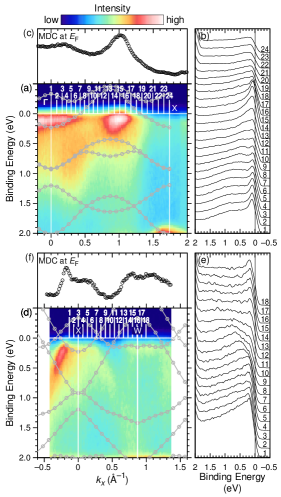
SX-ARPES measurements were performed with an electron energy analyzer, Gammadata-Scienta SES2002, at undulator beamline BL17SU of SPring-8 using a grazing incidence geometry (5∘) spectrometer EPAPS ; Ohashi2007 ; Takata2004 . The grazing incidence spectrometer makes the ARPES measurements highly efficient and also ensures that the x-ray photon momentum (0.1-X at = 400 eV) imparted to the electrons are accounted for easily Plucinski2008 ; Kamakura2006 . Circularly polarized x-rays were used to avoid the symmetry selectivity of linearly polarized x-rays EPAPS . The measurements were carried out at 50 K, which is well below 200 K, to minimize indirect transition losses. The and positions in the 3D Brillouin zone (BZ) (Fig. 1(d)) were accurately determined from energy and momentum distribution curves (EDCs and MDCs) obtained from intensity maps measured for incident photon energies probing two successive BZs. The arcs in - momentum space traced by the specific photon energies used are shown in Fig. 1(h). Figure 1(e) shows the EDCs for the scan along -X at = 430 eV, while Fig. 1(f) and (g) show EDCs for -X along in successive BZs, respectively, as marked in Fig. 1(h). The overall similarity of the EDCs, particularly at the high symmetry points and X along and confirms the viability of 3D FS mapping of the Fe films. However, since we are measuring ultrathin films with soft x-rays, we have to be careful about contributions from the copper substrate in the EDCs. It is well-known that copper shows very weak intensity due to a band crossing near X point (along -X and X-W) within a binding energy of 2 eV Courths1984 ; EPAPS . We have actually confirmed the same by measuring the clean copper substrate ARPES spectra before the film depositions EPAPS . Then, as we show in the following results, the SS associated electronic states are well separated from the copper states in energy and -space. Thus, the intensity maps within 2 eV binding energy are dominated by the Fe spectral weight. Fig. 2(a) and (b) show the in-plane -X and X-W intensity maps of the Fe films, obtained using = 430 eV and 580 eV, respectively. Figure 2(b)/(e) and (c)/(f) are the corresponding EDCs and MDCs which show clear band crossings. Early work assigned the band crossings along -X to the and bands, as suggested by calculations for the parent high-spin fcc Fe Mankey1993 . A comparison with calculated band dispersions for the SS vectors obtained in the local spin density approximation (LSDA), however, does not give a satisfactory match with the data for = (2)(0,0,0.6). For = (2)(0.5,0,1.0), the calculated data are overlaid in Fig. 2(a) and (b) after shifting the energy by 0.4 eV toward Fermi edge. While the data show similarities with calculations, e.g., MDCs show band crossings matching the calculation for the X-W cut or for the crossing at 0.35 Å-1 along -X, there are clear discrepancies also observed: the intense band crossing at 1.05 Å-1 along -X and the band dispersions between 0.5 to 2 eV binding energies do not match well with calculations. Thus, while band dispersions and crossings can be clearly observed, the experimental results do not match the LSDA results for the SSs with = (2)(0,0,0.6) and = (2)(0.5,0,1.0).
We then embarked on a determination of the in-plane (-) and out-of-plane (-) FSs of the Fe films in order to trace the electronic structure associated with the SS. The in-plane (Fig. 3(a)) and out-of-plane (Fig. 3(b)) intensity maps at were obtained from polar angle scans, at = 430 eV and as a function of energy = 385–595 eV, respectively. The raw data was measured over more than one-quarter of the BZ (Fig. 3(a) and (b)) EPAPS . From peaks in MDCs, we have determined the FS crossings and symmetrized to obtain the experimental in-plane and out-of-plane FSs for full BZ (Fig. 3(c) and (d)). Since the fcc structure is equivalent along , and , the in-plane and out-of-plane FSs should be equivalent in the absence of electronic/magnetic instabilities along preferred directions. The results instead show remarkable differences in the in-plane and out-of-plane FSs. The in-plane FSs show a four-fold symmetry while the out-of-plane FSs show two-fold symmetry. While the in-plane FSs show no evidence for nesting, a clear nesting is observed in the out-of-plane FSs. This is directly seen in the MDC plot comparison for the , and cuts along -X (Fig. 3(e)). While the and cuts are very similar, the cut shows one additional peak between and X. Thus, the peak-to-peak separation for the symmetrized data, marked by arrows in Fig. 3(e), corresponds to (2)(0.86). The additional peaks in the MDCs are observed over an extended region in (red dashed lines in Fig. 3(d)), thus identifying the component of the nesting vector. The identification of the SS nesting vector in the out-of-plane FSs is based on a precise determination of reciprocal-space maps in successive BZs. In turn, this provides evidence for a subtle structural modification in real space, namely, a small but finite compressive strain of 1.50.5 % along the -axis EPAPS .
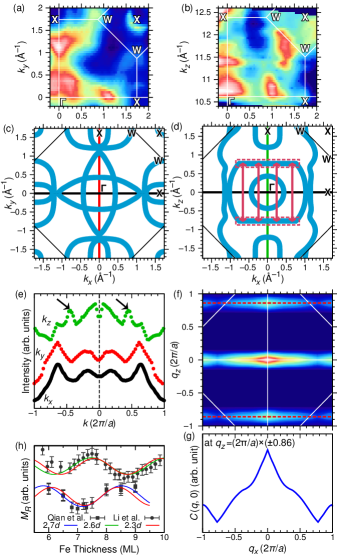
In order to determine the component of the SS vector, we carried out an autocorrelation analysis (ACA) Chatterjee2006 ; Shen2008 ; EPAPS . A full ACA over the BZ did not lead to a meaningful result, and hence we resorted to a restricted area ACA (red dashed lines in Fig. 3(d)) so as to extract the component. The results are shown in Fig. 3(f) and (g), indicating that = 0.0 has the maximum spectral weight. Thus, the experimental determination of FSs gives us a SS vector of = (2)(0,0,0.860.1). While the MOKE results only provide the component, since = 0.0 from the present results, it indicates consistency between the MOKE and FS measurements within error bars for the obtained SS vector (Fig. 3(h)).
For the epitaxial ultrathin Fe/Cu(001) films, all available band structure calculations are thus inconsistent with the experimental results, as they do not give nested regions. Also the magnitude of the SS does not match experiments. While theoretical studies show that the SS in Erbium is due to FS nesting, the SS in -Fe is not expected to be derived from a single FS nesting vector Wessely2009 . The above results indicate the requirement of an anisotropy between the - and -, which probably originates in the compressive strain along the -axis EPAPS . Additionally, given that electron-electron correlations are not negligible in Fe Hufner2000 , band structure calculations going beyond LSDA, e.g. LSDA + DMFT with SS order, are considered necessary to explain the observations. Finally, a recent theoretical study has shown that the SS in fcc Fe is a candidate for spin transfer torque (STT: a current induced transfer of vector spin between magnetic layers) Wessely2009 . STT was predicted for the incommensurate = (2)(0,0,0.6), but it was shown to be suppressed for = (2)(0.5,0,1.0) due to the antiferromagnetic coupling between layers. Our results indicate an incommensurate SS vector of = (2)(0,0,0.86), suggesting the epitaxial Fe/Cu(001) thin film is a candidate for STT. Since STT gives rise to fascinating properties: microwave oscillations in a nanomagnet, current induced spin waves Kiselev2003 ; Vlaminck2008 , etc. and is technologically important for high-speed/high-density memory and switching applications, it would be interesting to investigate the same in ultrathin epitaxial Fe/Cu(001) films. Furthermore, in-plane and out-of-plane FS mapping is expected to be important for studying strain control of properties in ultrathin films of elements, oxides, and their multilayers, heterostructures, interfaces, etc.
The present work has been performed under the approval of RIKEN (Proposal No. 20080050).
References
- (1) C. Herring, Magnetism (Academic Press, New York, 1966), Vol. IV.
- (2) C. S. Wang, B. M. Klein, and H. Krakauer, Phys. Rev. Lett. 54, 1852 (1985).
- (3) M. Uhl, L. M. Sandratskii, and J. Kübler, J. Magn. Magn. Mater. 103, 314 (1992).
- (4) M. Körling and J. Ergon, Phys. Rev. B 54, R8293 (1996).
- (5) S. Okatov et al., Phys. Rev. B 79, 094111 (2009).
- (6) K. Shimizu et al., Nature 412, 316 (2001).
- (7) L. Dubrovinsky et al., Science 281, 11a (1998).
- (8) Y. Tsunoda, J. Phys.-Condes. Matter 1, 10427 (1989).
- (9) Y. Tsunoda, Y. Nishioka, and R. M. Nicklow, J. Magn. Magn. Mater. 128, 133 (1993).
- (10) R. Ramesh and N. Spaldin, Nat. Mater. 6, 21 (2007).
- (11) J. Zhao et al., Nat. Mater. 7, 953 (2008).
- (12) M. T. Kief and W. F. Egelhoff, Phys. Rev. B 47, 10785 (1993).
- (13) R. D. Ellerbrock et al., Phys. Rev. Lett. 74, 3053 (1995).
- (14) T. Bernhard, M. Baron, M. Gruyters, and H. Winter, Phys. Rev. Lett. 95, 087601 (2005).
- (15) H. L. Meyerheim et al., Phys. Rev. B 71, 035409 (2005).
- (16) D. Q. Li et al., Phys. Rev. Lett. 72, 3112 (1994).
- (17) M. Donath, M. Pickel, A. Schmidt, and M. Weinelt, J. Phys.-Condes. Matter 21, 134004 (2009).
- (18) D. Qian et al., Phys. Rev. Lett. 87, 227204 (2001).
- (19) K. Amemiya et al., Appl. Phys. Lett. 84, 936 (2004).
- (20) D. Spišák and J. Hafner, Phys. Rev. B 66, 052417 (2002).
- (21) F. Venturini et al., Phys. Rev. B 77, 045126 (2008).
- (22) N. Kamakura et al., Phys. Rev. B 74, 045127 (2006).
- (23) R. H. Madjoe et al., J. Appl. Phys. 85, 6211 (1999).
- (24) L. Plucinski et al., Phys. Rev. B 78, 035108 (2008).
- (25) M. Månsson et al., Phys. Rev. Lett. 101, 226404 (2008).
- (26) See EPAPS document No. XXXXX for supplementary data.
- (27) H. Ohashi et al., AIP Proc. 879, 523 (2007).
- (28) Y. Takata et al., AIP Proc. 705, 1186 (2004).
- (29) R. Courths and S. Hüfner, Phys. Rep.-Rev. Sec. Phys. Lett. 112, 53 (1984).
- (30) G. J. Mankey, R. F. Willis, and F. J. Himpsel, Phys. Rev. B 48, 10284 (1993).
- (31) U. Chatterjee et al., Phys. Rev. Lett. 96, 107006 (2006).
- (32) D. Shen et al., Phys. Rev. Lett. 101, 226406 (2008).
- (33) O. Wessely, B. Skubic, and L. Nordström, Phys. Rev. B 79, 104433 (2009).
- (34) S. Hüfner et al., Phys. Rev. B 61, 12582 (2000).
- (35) S. Kiselev et al., Nature 425, 380 (2003).
- (36) V. Vlaminck and M. Bailleul, Science 322, 410 (2008).