Truncation of the Inner Accretion Disk around a Black Hole at Low Luminosity
Abstract
Most black hole binaries show large changes in X-ray luminosity caused primarily by variations in mass accretion rate. An important question for understanding black hole accretion and jet production is whether the inner edge of the accretion disk recedes at low accretion rate. Measurements of the location of the inner edge () can be made using iron emission lines that arise due to fluorescence of iron in the disk, and these indicate that is very close to the black hole at high and moderate luminosities (1% of the Eddington luminosity, ). Here, we report on X-ray observations of the black hole GX 339–4 in the hard state by Suzaku and the Rossi X-ray Timing Explorer (RXTE) that extend iron line studies to 0.14% and show that increases by a factor of 27 over the value found when GX 339–4 was bright. The exact value of depends on the inclination of the inner disk (), and we derive 90% confidence limits of at and at . This provides direct evidence that the inner portion of the disk is not present at low luminosity, allowing for the possibility that the inner disk is replaced by advection- or magnetically-dominated accretion flows.
Subject headings:
accretion, accretion disks — black hole physics — stars: individual (GX 339–4) — X-rays: stars — X-rays: general1. Introduction
Accreting black holes exhibit a variety of spectral states (McClintock & Remillard, 2006), most often showing strong thermal emission from an optically thick accretion disk (Shakura & Sunyaev, 1973) when they are at their brightest. As luminosities drop below a few percent of the Eddington value (), the level of thermal emission decreases, and the spectrum hardens, signaling a transition to the hard state (Kalemci et al., 2004). This state is also characterized by having a high level of X-ray variability and steady, self-absorbed compact jets, which are often observed in the radio band (Fender, 2001).
In theory, it is predicted that the cool gas from the accretion disk will evaporate as the mass accretion rate drops (Meyer, Liu & Meyer-Hofmeister, 2000). The implied increase in the inner radius of the optically thick disk, , is critical to the idea that a quasi-spherical advection-dominated accretion flow (ADAF) forms around the black hole (Narayan & Yi, 1994). This model requires that increases to 100–1000 (Esin, McClintock & Narayan, 1997), where the gravitational radius is , and are constants, and is the black hole mass.
Recently, observational efforts to test the truncated disk picture have used two techniques: Modeling the thermal emission from the disk and measuring the iron K emission line in the reflection component (Lightman & White, 1988). The former technique is challenging because of uncertainties arising from electron scattering, irradiation of the disk, and the torque boundary condition at the disk’s inner edge as well as the difficulty of modeling a soft X-ray component that is strongly affected by interstellar absorption. Modeling the disk’s thermal emission to estimate the inner radius () has led to mixed results with some in favor of an increase in (Gierliński, Done & Page, 2008; Cabanac et al., 2009) and others in disagreement (Rykoff et al., 2007; Reis, Miller & Fabian, 2009). The iron line provides a measurement of because it is Doppler-broadened due to relativistic motion of the accretion disk material and gravitationally redshifted due to the black hole’s gravitational field. Broad iron lines have been seen from both stellar mass and supermassive black holes (Tanaka et al., 1995; Fabian et al., 2009). One challenge to the relativistic interpretation in the case of stellar mass black holes is that the iron line shape may be affected by scattering in a wind (Laurent & Titarchuk, 2007; Titarchuk, Laurent & Shaposhnikov, 2009). However, arguments in favor of the relativistic interpretation are presented in Miller (2007).
For stellar mass black holes at high luminosities, the iron line profiles have been used extensively, and values of less than the radius of the innermost stable circular orbit for a non-rotating black hole, , have been measured for several systems (Miller et al., 2002, 2004, 2008), including GX 339–4. The broad iron line has, somewhat surprisingly, persisted into the hard state (Miller et al., 2006; Tomsick et al., 2008; Hiemstra et al., 2009). However, for GX 339–4, the previous detections of the iron line in the hard state were obtained at luminosities above 1% , and it remains to be seen if there is evolution in the iron line profile at lower luminosities.
GX 339–4 is one of the most active black hole transients known, with 4 major outbursts in the past 7 yr. The distance to GX 339–4 is 8 kpc (Hynes et al., 2004; Zdziarski et al., 2004), and the orbital period is 1.7 days (Hynes et al., 2003; Levine & Corbet, 2006). The lower limit on the black hole mass is 6 (Hynes et al., 2003; Muñoz-Darias, Casares & Martínez-Pais, 2008), and here, we adopt a value of 10, corresponding to ergs s-1. GX 339–4 has allowed for some of the most in-depth studies of compact jets (Corbel et al., 2000; Coriat et al., 2009). Here, we use Suzaku and RXTE observations of GX 339–4 to study the iron line profile at 0.14% .
2. Observations
We observed GX 339–4 in the X-ray band over a period of 2.2 days during 2008 September 24–27 with the Suzaku (Mitsuda et al., 2007) and RXTE (Bradt, Rothschild & Swank, 1993) satellites. The observation was made 1.6 yr after the peak of its 2007 outburst during a time when the source was active but faint (Russell et al., 2008; Kong, 2008). We analyzed the data using the HEASOFT v6.7 software, and the most recent instrument calibrations as of 2009 September 25 for Suzaku and 2009 August 19 for RXTE. Suzaku observed GX 339–4 continuously over the 2.2 day period (except for Earth occulations), and we accumulated 105,000 s of on-source time for the X-ray Imaging Spectrometer (XIS) and 106,800 s for the PIN layer of the Hard X-ray Detector (HXD). The Suzaku data are all contained in observation ID 403067010. RXTE made five shorter (2,300 to 3,500 s) observations during the same time period. The observation IDs are 93702-04-01-01, 93702-04-01-02, 93702-04-01-03, 93702-04-02-00, and 93702-04-02-01, and we obtained a total Proportional Counter Array (PCA) exposure time of 14,640 s and a total High-Energy X-ray Timing Experiment (HEXTE) exposure time of 4,625 s. We also observed GX 339–4 in the radio band at the Australia Telescope Compact Array (ATCA) on 2008 August 18 and September 28.
For observations of relatively faint sources close to the Galactic plane, an additional step is required for the PCA spectrum to subtract any other emission in its field-of-view (Jahoda et al., 2006). To do this, we obtained data from RXTE observations of GX 339–4 when the source was in quiescence (Gallo, Fender & Corbel, 2003). These observations occurred between 2001 March and 2002 February and also on 2003 September 29. The average quiescent count rate is 6% of that measured during the 2008 September observations. We subtracted the quiescent PCA spectrum for the spectral fits below.
3. Results
3.1. General Properties and Spectral State Identification
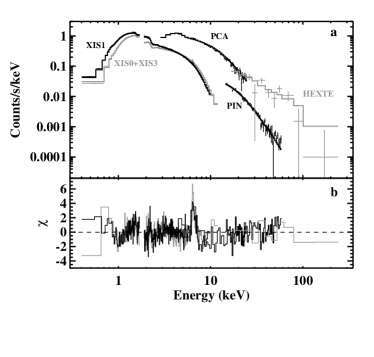
We first used the X-ray and radio properties to identify the spectral state. We produced the energy spectrum shown in Figure 1a, and fitted it with an absorbed power-law model. To model the absorption, we used elemental abundances that approximate interstellar values (Wilms, Allen & McCray, 2000) and atomic cross sections from Balucinska-Church & McCammon (1992). For the XIS spectra, we did not include the data in the 1.7–1.9 keV range due to uncertainties in the instrument calibration near the Silicon K-edge. The overall normalizations between instruments were left as free parameters in the model, and the fluxes given below are based on those measured by XIS0+XIS3. The measured model parameters are the interstellar column density, cm-2, the power-law photon index, , and the unabsorbed 0.4–12 keV flux of ergs cm-2 s-1 (90% confidence uncertainties, ). Although this model provides a good description of the continuum, the quality of the fit is not good () due to the presence of a strong iron K line near 6.4 keV.
To characterize the X-ray timing properties, we produced XIS light curves in the 0.4–2.5 keV and 2.5–12 keV energy bands with 8 s time resolution and PCA light curves in the 3–25 keV band with 16 s resolution. An inspection of the light curves shows that while they show strong variability and flaring, they are very similar in the different energy bands, indicating that the spectrum changes very little with flux. We also produced a PCA power spectrum at frequencies from 0.005 to 64 Hz. The power spectrum is well-described by a power-law with an index of , and a fractional rms value of 55% 2% (0.01–10 Hz).
The ATCA radio observations show flux densities of and mJy at frequencies () of 4.80 and 8.64 GHz, respectively, on August 18. For the same frequencies, the September 28 flux densities are and mJy. These measurements indicate spectral indices of and , where the flux density is given by . Self-absorption of the compact jets that are seen in the hard state causes flat or slightly inverted radio spectra (), and our measurements are consistent with this.
Thus, the hard energy spectrum, the high level of timing noise, and the evidence for the presence of a compact jet are all consistent with the source being in the hard state during our observation.
3.2. The Iron Emission Line and the Inner Radius of the Disk
The residuals shown in Figure 1b indicate the deviation of the data from a power-law, and the presence of an iron K emission line is clear. When we add a Gaussian to model the emission line, we measure a line energy of keV, consistent with neutral to moderately ionized iron, a line width of keV, and an equivalent width (EW) of eV. With the addition of the iron line, the quality of the fit improves dramatically to . The total 1–100 keV unabsorbed flux is ergs cm-2 s-1, which is a factor 9 lower than the lowest level at which an iron line was previously detected for GX 339–4 (Tomsick et al., 2008), and this flux corresponds to a luminosity of 0.14% .
Before discussing the implications of the presence of this narrow iron line, it is critical to determine if the iron line could be related either to poor background subtraction or to emission from other sources in the Galactic plane. For the XIS detectors, we examined the background spectrum from two rectangular regions on the detectors and verified that only internal background lines of the detector appear (see Koyama et al., 2007, for information about the XIS internal background) without any evidence for other background lines with strong emission in the iron K region.
Emission from the Galactic ridge includes iron K emission with the most prominent line being due to He-like iron at 6.7 keV (Koyama et al., 1986; Kaneda et al., 1997; Revnivtsev et al., 2009). Although the emission is very strong in the Galactic center region, it decreases for lines-of-sight away from the Galactic center and drops especially rapidly with Galactic latitude (). In the Scutum region, at a Galactic longitude of , a scale height of is estimated (Kaneda et al., 1997). Thus, at the position of GX 339–4 (, –), the Galactic ridge emission is expected to be weak, but possibly not negligible.
The fact that the XIS0+XIS3 background spectrum does not show an emission line at 6.7 keV suggests that we are not detecting Galactic ridge emission in our observation of GX 339–4. As an additional check, we produced a new GX 339–4 spectrum using a circular extraction region centered on the source with a radius of , which is five times smaller than the radius region used previously. This causes a reduction in the source count rate by a factor of 2.1 while reducing the background by a factor of 25. Thus, the strength of any background features will decrease by an order of magnitude. Fitting the new GX 339–4 XIS spectrum with an absorbed power-law model and inspecting the residuals still clearly shows an iron line at 6.4 keV. Adding a Gaussian to fit the iron line, we measure an EW of eV, which is consistent with no change from the EW of eV that we measure with XIS with the larger extraction region. Based on this and the background spectrum discussed above, we conclude that the iron line is from GX 339–4.
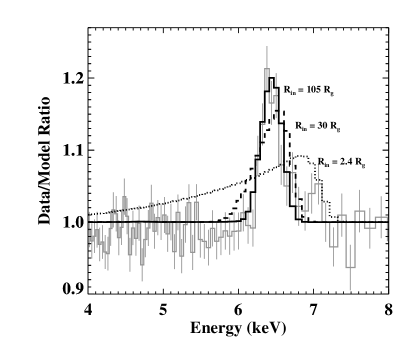
To use the shape of the iron line to constrain , we return to fitting the full spectrum shown in Figure 1, and we replaced the Gaussian component with the laor model (Laor, 1991), which accounts for the relativistic effects near a rotating black hole. The line energy and EW are keV and eV, respectively. The other model parameters are , the inclination of the inner disk, , and the emissivity index, , which is a power-law index that sets how the line-emissivity () of the disk changes with radius according to . Although a broad line allows for good constraints on all 3 parameters, this is not the case for a narrow line. Thus, we restricted the range of to be between 2, which corresponds to a value where the contribution to the iron line from large radii begins to diverge (Laor, 1991), and 3, which is consistent with the value obtained from previous measurements of the GX 339–4 iron line in the hard state (Miller et al., 2006, 2008; Tomsick et al., 2008; Reis et al., 2008). The inclination has been previously measured to be degrees (Miller et al., 2008). For , the spectral fits indicate 68% and 90% confidence lower limits of 84 and 65 , respectively, if . As a value of was obtained when the source was bright (Miller et al., 2008), our results indicate that the inner radius changes by a factor of 27. Figure 2 illustrates the huge difference between the profile that we measure and a profile with .
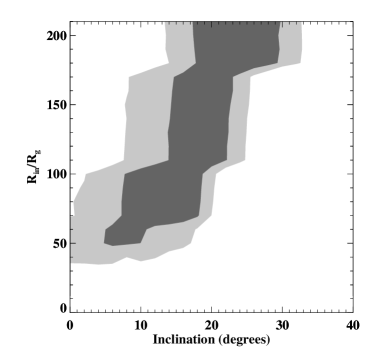
Fixing the disk inclination to is appropriate for constraining the ratio of inner radii at 0.14% and 12–15% since we do not expect the disk inclination to change significantly with luminosity, being set either by the binary inclination or the spin axis of the black hole. However, for obtaining a physical value of , we need to consider the inclination. We refitted the full spectrum with the power-law plus laor model, allowing to be a free parameter and to be free in the range 2–3. Then, we performed a grid search of inclinations covering to and values of covering 10 to 210 . Figure 3 shows the results in terms of the 68% and 90% confidence contours. The contours show that at lower inclinations, the constraint on becomes somewhat weaker, but even at , the results indicate a truncated disk with (90% confidence). On the other hand, at disk inclinations above , the inferred values of rise rapidly. For example, at , the limit is .
There are at least two reasons why our limits on are conservative in the sense that the disk may be even more truncated. First, Ross & Fabian (2005) show that, especially for the disks around stellar mass black holes, thermal motions of the disk material can lead to significant broadening of the iron line. If this is the case for GX 339–4, then less Doppler broadening from bulk motion in the accretion disk would be required. Second, it has been pointed out that if the disk inclination is really as low as and the disk inclination is the same as the binary inclination, then this would imply a black hole mass of 200 (Cabanac et al., 2009), which is probably unrealistically high. Thus, either the disk is warped or the inclination is significantly higher than .
4. Discussion
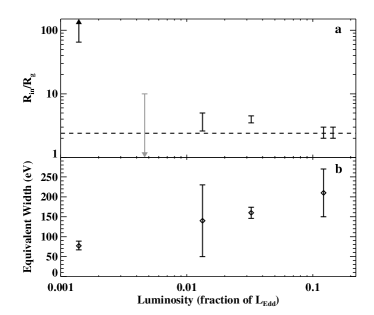
These results provide the most direct and quantitative evidence to date for the truncation of the accretion disk for stellar mass black holes in the hard state at low luminosities. Figure 4a compares our constraint on at 0.14% to previous measurements at higher luminosities. The data show that the inner edge of the disk moves sharply outward as the luminosity decreases from 1% to 0.1% . In addition, the drop in the iron line EW shown in Figure 4b is consistent with the increase in since one expects the line to become weaker if the disk is truncated. The EW evolution and the fact that the line is well-described by a single component provide support for the interpretation that the narrow line comes from the disk. Considering the broad lines seen in the brighter part of the hard state and the disk truncation that we see here, the overall evolution is very similar to the theoretical prediction that the disk evaporation will start in the middle of the disk and that the entire inner disk will evaporate when the luminosity reaches 0.1% (Taam et al., 2008).
While the study of stellar mass black holes, such as GX 339–4, provides a detailed look at the evolution of , there is iron line evidence for truncated disks around supermassive black holes in Active Galactic Nuclei (AGN). For NGC 4258, Reynolds et al. (2009) measure a narrow line with an EW of 45 eV at a luminosity of % and infer that . There is also evidence for a truncated disk in NGC 4593, and for this AGN, there is possible evidence for a change in over a period of 5 yr (Markowitz & Reeves, 2009).
Our finding for GX 339–4 is also important because a large increase in is required for the presence of an ADAF, and our result makes the ADAF model viable for the fainter part of the hard state. However, it is known that the ADAF model does not give a complete physical description of the system since it does not incorporate the compact jet. These jets have now been detected from GX 339–4 in the hard state both when the disk is truncated (this work) and when the disk is not truncated (Miller et al., 2006; Tomsick et al., 2008). The possibility that disk truncation occurs at a different mass accretion rate than the transition to the hard state and the turn-on of the compact jet has not been considered in most theoretical work. This finding strongly constrains models such as the magnetically-dominated accretion flow (MDAF) model (Meier, 2005) where jet production and properties depend on the accretion geometry.
References
- Balucinska-Church & McCammon (1992) Balucinska-Church, M., & McCammon, D., 1992, ApJ, 400, 699
- Bradt, Rothschild & Swank (1993) Bradt, H. V., Rothschild, R. E., & Swank, J. H., 1993, A&AS, 97, 355
- Cabanac et al. (2009) Cabanac, C., Fender, R. P., Dunn, R. J. H., & Körding, E. G., 2009, MNRAS, 396, 1415
- Corbel et al. (2000) Corbel, S., Fender, R. P., Tzioumis, A. K., Nowak, M., McIntyre, V., Durouchoux, P., & Sood, R., 2000, A&A, 359, 251
- Coriat et al. (2009) Coriat, M., Corbel, S., Buxton, M. M., Bailyn, C. D., Tomsick, J. A., Körding, E., & Kalemci, E., 2009, MNRAS, 1311
- Esin, McClintock & Narayan (1997) Esin, A. A., McClintock, J. E., & Narayan, R., 1997, ApJ, 489, 865
- Fabian et al. (2009) Fabian, A. C., et al., 2009, Nature, 459, 540
- Fender (2001) Fender, R. P., 2001, MNRAS, 322, 31
- Gallo, Fender & Corbel (2003) Gallo, E., Fender, R., & Corbel, S., 2003, The Astronomer’s Telegram, 196
- Gierliński, Done & Page (2008) Gierliński, M., Done, C., & Page, K., 2008, MNRAS, 388, 753
- Hiemstra et al. (2009) Hiemstra, B., Soleri, P., Méndez, M., Belloni, T., Mostafa, R., & Wijnands, R., 2009, MNRAS, 394, 2080
- Hynes et al. (2003) Hynes, R. I., Steeghs, D., Casares, J., Charles, P. A., & O’Brien, K., 2003, ApJ, 583, L95
- Hynes et al. (2004) Hynes, R. I., Steeghs, D., Casares, J., Charles, P. A., & O’Brien, K., 2004, ApJ, 609, 317
- Jahoda et al. (2006) Jahoda, K., Markwardt, C. B., Radeva, Y., Rots, A. H., Stark, M. J., Swank, J. H., Strohmayer, T. E., & Zhang, W., 2006, ApJS, 163, 401
- Kalemci et al. (2004) Kalemci, E., Tomsick, J. A., Rothschild, R. E., Pottschmidt, K., & Kaaret, P., 2004, ApJ, 603, 231
- Kaneda et al. (1997) Kaneda, H., Makishima, K., Yamauchi, S., Koyama, K., Matsuzaki, K., & Yamasaki, N. Y., 1997, ApJ, 491, 638
- Kong (2008) Kong, A. K. H., 2008, The Astronomer’s Telegram, 1588
- Koyama et al. (1986) Koyama, K., Makishima, K., Tanaka, Y., & Tsunemi, H., 1986, PASJ, 38, 121
- Koyama et al. (2007) Koyama, K., et al., 2007, PASJ, 59, 23
- Laor (1991) Laor, A., 1991, ApJ, 376, 90
- Laurent & Titarchuk (2007) Laurent, P., & Titarchuk, L., 2007, ApJ, 656, 1056
- Levine & Corbet (2006) Levine, A. M., & Corbet, R., 2006, The Astronomer’s Telegram, 940
- Lightman & White (1988) Lightman, A. P., & White, T. R., 1988, ApJ, 335, 57
- Markowitz & Reeves (2009) Markowitz, A. G., & Reeves, J. N., 2009, ApJ, 705, 496
- McClintock & Remillard (2006) McClintock, J. E., & Remillard, R. A., 2006, Black hole binaries, Compact stellar X-ray sources. Edited by Walter Lewin & Michiel van der Klis: Cambridge University Press, 157–213
- Meier (2005) Meier, D. L., 2005, Ap&SS, 300, 55
- Meyer, Liu & Meyer-Hofmeister (2000) Meyer, F., Liu, B. F., & Meyer-Hofmeister, E., 2000, A&A, 361, 175
- Miller (2007) Miller, J. M., 2007, ARA&A, 45, 441
- Miller et al. (2004) Miller, J. M., et al., 2004, ApJ, 606, L131
- Miller et al. (2002) Miller, J. M., et al., 2002, ApJ, 570, L69
- Miller et al. (2006) Miller, J. M., Homan, J., Steeghs, D., Rupen, M., Hunstead, R. W., Wijnands, R., Charles, P. A., & Fabian, A. C., 2006, ApJ, 653, 525
- Miller et al. (2008) Miller, J. M., et al., 2008, ApJ, 679, L113
- Mitsuda et al. (2007) Mitsuda, K., et al., 2007, PASJ, 59, 1
- Muñoz-Darias, Casares & Martínez-Pais (2008) Muñoz-Darias, T., Casares, J., & Martínez-Pais, I. G., 2008, MNRAS, 385, 2205
- Narayan & Yi (1994) Narayan, R., & Yi, I., 1994, ApJ, 428, L13
- Reis et al. (2008) Reis, R. C., Fabian, A. C., Ross, R. R., Miniutti, G., Miller, J. M., & Reynolds, C., 2008, MNRAS, 387, 1489
- Reis, Miller & Fabian (2009) Reis, R. C., Miller, J. M., & Fabian, A. C., 2009, MNRAS, 395, L52
- Revnivtsev et al. (2009) Revnivtsev, M., Sazonov, S., Churazov, E., Forman, W., Vikhlinin, A., & Sunyaev, R., 2009, Nature, 458, 1142
- Reynolds et al. (2009) Reynolds, C. S., Nowak, M. A., Markoff, S., Tueller, J., Wilms, J., & Young, A. J., 2009, ApJ, 691, 1159
- Ross & Fabian (2005) Ross, R. R., & Fabian, A. C., 2005, MNRAS, 358, 211
- Russell et al. (2008) Russell, D. M., Altamirano, D., Lewis, F., Roche, P., Markwardt, C. B., & Fender, R. P., 2008, The Astronomer’s Telegram, 1586
- Rykoff et al. (2007) Rykoff, E. S., Miller, J. M., Steeghs, D., & Torres, M. A. P., 2007, ApJ, 666, 1129
- Shakura & Sunyaev (1973) Shakura, N. I., & Sunyaev, R. A., 1973, A&A, 24, 337
- Taam et al. (2008) Taam, R. E., Liu, B. F., Meyer, F., & Meyer-Hofmeister, E., 2008, ApJ, 688, 527
- Tanaka et al. (1995) Tanaka, Y., et al., 1995, Nature, 375, 659
- Titarchuk, Laurent & Shaposhnikov (2009) Titarchuk, L., Laurent, P., & Shaposhnikov, N., 2009, ApJ, 700, 1831
- Tomsick et al. (2008) Tomsick, J. A., et al., 2008, ApJ, 680, 593
- Wilms, Allen & McCray (2000) Wilms, J., Allen, A., & McCray, R., 2000, ApJ, 542, 914
- Zdziarski et al. (2004) Zdziarski, A. A., Gierliński, M., Mikołajewska, J., Wardziński, G., Smith, D. M., Harmon, B. A., & Kitamoto, S., 2004, MNRAS, 351, 791