Identification and properties of the photospheric emission in GRB090902B
Abstract
The Fermi Gamma-ray Space Telescope observed the bright and long GRB090902B, lying at a redshift of . Together the Large Area Telescope (LAT) and the Gamma-ray Burst Monitor (GBM) cover the spectral range from 8 keV to 300 GeV. Here we show that the prompt burst spectrum is consistent with emission from the jet photosphere combined with nonthermal emission described by a single powerlaw with photon index -1.9. The photosphere gives rise to a strong quasi-blackbody spectrum which is somewhat broader than a single Planck function and has a characteristic temperature of keV. We model the photospheric emission with a multicolor blackbody and its shape indicates that the photospheric radius increases at higher latitudes. We derive the averaged photospheric radius and the bulk Lorentz factor of the flow, which is found to vary by a factor of two and has a maximal value of . Here is the ratio between the total fireball energy and the energy emitted in the gamma-rays. We find that during the first quarter of the prompt phase the photospheric emission dominates, which explains the delayed onset of the observed flux in the LAT compared to the GBM. We interpret the broad band emission as synchrotron emission at cm. Our analysis emphasize the importance of having high temporal resolution when performing spectral analysis on GRBs, since there is strong spectral evolution.
Subject headings:
gamma rays: bursts – gamma rays: observations – gamma rays: theory – radiation mechanism: thermal1. Introduction
The mechanism giving rise to prompt emission in gamma-ray bursts (GRBs) has long been a puzzle. The emission typically peaks in the 100-1000 keV range and is modeled with the empirical Band function, which consists of two exponentially joined power-laws (Band et al., 1993). In general the narrow spectral ranges available during observations of GRBs have made it difficult to unambiguously determine the emission mechanism. This has been remedied by the launch of the Fermi Gamma-ray Space Telescope which regularly observes GRBs with its two instruments, the Large Area Telescope (LAT, nominal energy range 20 MeV–300 GeV; Atwood et al., 2009) and the Gamma-ray Burst Monitor (GBM, 8 keV–40 MeV; Meegan et al., 2009), thus covering an unprecedented spectral range.
The bright, long GRB090902B was detected by Fermi and was one of the brightest observed to date by the LAT (Abdo et al., 2009). Over 200 photons were detected at energies above 100 MeV, including 39 photons with energy above 1 GeV (de Palma et al., 2009). The LAT also detected a photon with energy GeV, the highest seen in any GRB so far. The burst lies at a redshift of (Cucchiara et al., 2009), which yields an isotropic energy of ergs, and the afterglow emission was seen at X-ray, optical, NIR and radio wavelengths.
The prompt spectrum of GRB090902B over the energy range 8 keV-33 GeV shows clear deviation from the generally expected Band function (Abdo et al., 2009). The time-integrated spectrum is best fitted by the addition of a separate power-law component (photon index of ) to the Band function. The power-law is detected at both lower and higher energies around the Band component. During the first half of the prompt emission phase, the Band power-law index at energies below the spectral peak significantly violates the optically thin synchrotron limit; photon index of (Preece et al., 1998, 2002).
Ryde (2005) suggested that GRB spectra are a superposition of two spectral components: photospheric blackbody emission and an accompanying nonthermal component. Over the limited energy range of 20-2000 keV (using data from BATSE on CGRO) studied, an adequate model consists of a single Planck function and a power-law. However, the nonthermal component, which is modelled by the power-law, is not well characterized, since the burst spectral shape is in general dominated by the thermal component (see further Ryde (2008); Ryde & Pe’er (2009)). The Fermi data now allow an improved characterization of the two components due to the increased energy range. In this paper, we investigate in more detail whether the observed two components in the broadband spectrum of GRB090902B could be attributed to such a photospheric model.
2. Time-resolved spectral analysis
Abdo et al. (2009) analysed time-resolved spectra of GRB090902B with time bins of typical duration of 6 s. In particular, they studied the behavior of the power-law component in the spectrum. In this work, we investigate the peaked component of the spectrum, i.e. the “Band” component, at a higher time resolution in order to study the spectral evolution in greater detail. A consequence of this is that any model will be less constrained at LAT energies (cp. Abdo et al. (2009)). Of particular interest is the first half of the prompt phase ( s), during which the Band component is very hard and narrow, which challenges optically-thin emission mechanisms as its origin. The Band component has a low-energy power-law and a high-energy power-law . We therefore focus our study on epochs a, b, and c in Abdo et al. (2009), and only briefly comment on the later behavior.
The time binning was chosen by requiring a signal-to-noise ratio of 40 in the most strongly illuminated GBM detector, NaI 1 (see Table 1). We also include data from NaI detector 0, BGO 0 and 1, and from the LAT in our fits. The LAT “transient” class data contain front and back events which are considered separately (Atwood et al., 2009). The NaI data are fit from 8 keV to 1 MeV and the BGO from 250 keV to 40 MeV using the Time Tagged Event (TTE) data type. The LAT data are fit from 100 MeV. An effective area correction factor of 0.9 is applied to the BGO with respect to the NaI detectors and LAT. The fits were performed with the spectral analysis software package RMFIT (version 3.0).
The first result we find is that the -value gets larger, i.e. the sub-peak spectrum gets harder when narrower time intervals are used for the Band+powerlaw model. For the time intervals used in Abdo et al. (2009) ; with the narrower time bins adopted here, we obtain an average value of (see Table 1). Several spectra have , which are among the hardest GRB spectra ever measured (Ryde, 2004; Kaneko et al., 2006). We therefore attempt to interpret this hard and narrow spectral component as stemming from the photosphere. First we model it with a single Planck function, which is used in addition to the powerlaw (BB+pl). The average value of (reduced ). We note however that the distribution of the residuals between the model and data shows trends that are not expected from stochastic variations, and thus indicate that the peak is slightly broader than a single Planck function.
Indeed, from a theoretical point of view the photospheric emission is not expected to be a pure Planck function. A broadening of the thermal component is expected due to contributions from different regions in space. Goodman (1986) discussed the emerging spectrum from an optically thick, fully ionized relativistic flow and showed that the emerging spectrum has a peak that is broader and a slope below the peak that is slightly shallower compared to the Planck function. Several effects needs to be taken into account. The observed blackbody temperature depends on the latitude angle due to the angle dependence of the Doppler shift. Likewise, the optical depth is angle dependent, which results in the photospheric radius increasing with angle (Pe’er 2008). Angle dependent density profiles of the outflow will have a similar effect. Therefore, the photospheric component is better represented by a multicolor blackbody instead of a single Planck function. The broad energy range now available through the Fermi observations, allows us to model the spectrum of the photospheric emission in greater detail than previously since the accompanying nonthermal component can now better be constrained. We thus fit the photospheric component with a phenomenological multicolor blackbody (mBB), which is given by
| (1) |
The spectrum thus consists of a superposition of Planck functions in the temperature range to ; is a free parameter ( and therefore cannot be determined). The spectrally integrated flux for each Planck function is given by , where is the normalization. Phenomenologically, we introduce the index , relating the flux and the temperature of the individual Planck functions
| (2) |
where . This full thermal + nonthermal model has 5 free parameters; power-law index, powerlaw normalization, , , and finally .
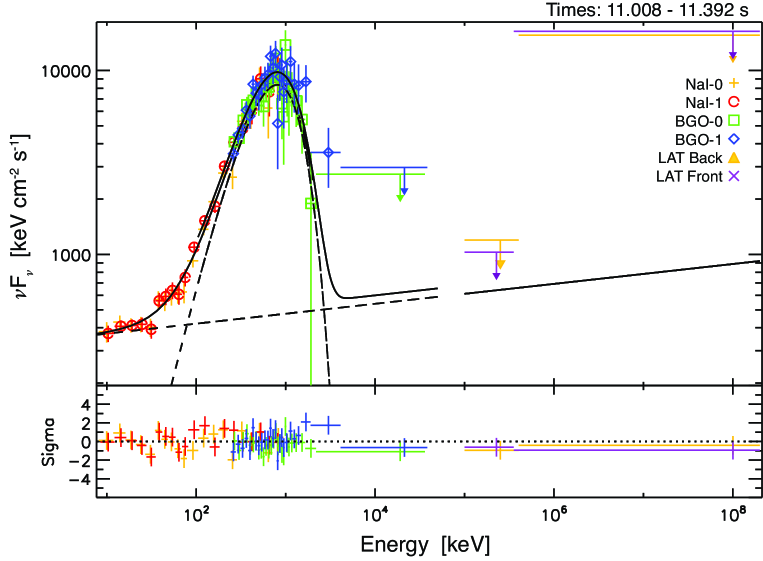
Figure 1 shows the time-resolved spectrum from one of the time intervals (11.008–11.392 s after the GBM trigger). The mBB function captures the sharp spectral peak emerging above the nonthermal component, being a factor of above it. Such a strong thermal component is rarely seen in GRB spectra (Ryde, 2004). For this time-bin keV, and (Pe’er et al., 2007). The power-law index of the nonthermal component is and the -parameter . The fit has a . The quality of the fits improve compared to the BB+pl model. Over all time bins the averaged , which is an improvement of C-stat with 69 for 598 dof. Moreover, the residuals do not have any marked trends.
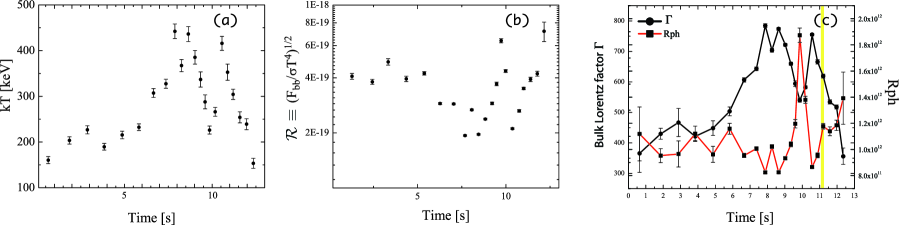
In Fig. 2 the evolution of the characteristic temperature is shown. Due to the brightness of the burst and the relative strength of the thermal component, the temperature is determined with unprecedented accuracy. Since the burst consists of heavily overlapping pulses the characteristic cooling behavior over a single pulse (Ryde & Pe’er, 2009) is not clearly detected. The middle panel in Fig. 2 shows the dimensionless parameter . For the studied interval in GRB090902B it is fairly constant, varying only by a factor of 2. Typically, varies by an order of magnitude (Ryde & Pe’er, 2009). Finally, the -parameter does not vary much during the analyzed interval and has an averaged value with a standard deviation of .
An alternative interpretation for the broadening of the thermal component is the effects of scattering and Comptonization, as worked out in Pe’er et al. (2005, 2006). Moreover, heating of thermal electrons by Coulomb collisions with protons will give rise to a broadened photospheric component (Beloborodov, 2009). We therefore also fit the photospheric component with a spectrum taking these effects into account. This is approximated by a Band function with and . The averaged , is similar to the mBB model and the residuals do not have any marked trends.
The nonthermal component is adequately fitted by a single power-law and a curvature in the spectrum is not statistically required. The photon index is constant, , with a standard deviation of 0.05. This value is largely independent of the width of the time bins as well as of model used for the thermal component (Abdo et al., 2009).
The fraction of energy flux in the thermal emission relative to the total flux in the observed energy band is on average . During the first 6 s the average is (the spectrum is dominated by the thermal component), after which it settles to an averaged value of . Abdo et al. (2009) noted that there is a delayed onset of the LAT light curve compared to the GBM light curve. This can be naturally explained by the dominance of the photospheric component during the first 6 s of the burst. To investigate this further we reduced the signal to noise ratio to 10, increasing the number of time intervals. The -parameter was frozen to (the average value) and the data were fit with the photospheric component, with only two free parameters, the temperature and the normalization. The resulting, averaged reduced has an acceptable value of 1.02 for s. Thereafter the reduced -value increases dramatically to , indicating that an extra component is needed, i.e. the power-law component. This is thus a natural explanation for the observed lack of photons in the LAT and in the NaI below 14 keV at the beginning of the pulse. We note that a similar behavior was observed by BATSE in GRB 970111 (Fig.13 in Ryde (2004),Ghirlanda et al. (2004)).
Finally, we calculated the cross correlation function between the thermal and nonthermal light curves, which are found by integrating the mBB and power-law functions over the observed energy band for every time bin. We find a lag of s (thermal emission leading) and a correlation maximum of , indicating a strong correlation.
Beyond the time interval studied here, we showed in Abdo et al. (2009) that the Band component becomes broader and softer. We find that the photospheric model (mBB) can adequately fit these spectra as well, however the value of the parameter is markedly lower, lying between 1 and 1.5: the properties of the photosphere changes. Further theoretical study of the interpretation and reason for this is underway.
We thus conclude that by resolving the light curve on a sub-second timescale one can identify a photospheric component in the spectrum, combined with a single power-law component. The photospheric component can be modelled by a hard and narrow Band function. A physical interpretation is given by a multicolor blackbody, which has one parameter less to be fit. Using wider time bins, as done in (Abdo et al., 2009), will increase the SNR but the variations in temperature and flux will broaden the spectrum, weakening the thermal signature. Our results thus emphasize the importance of having the highest possible temporal resolution when performing spectral analysis on GRBs.
2.1. Properties of the photosphere
The identification of the emission from the photosphere allows us to determine physical properties of the relativistic outflow, such as the bulk Lorentz factor , the photospheric radius and the initial size of the flow , as we showed in Pe’er et al. (2007). The photospheric radius is given by , where is the total fireball luminosity, and and are the Thomson cross section and proton mass respectively. The values of and can be determined by combining this expression with the measurement of the dimensionless parameter , which is related to the effective transverse size of the photosphere
| (3) |
where is a geometrical factor of order unity, and is the luminosity distance. Furthermore, we can estimate the radius above which the relativistic acceleration begins, . This is done by combining classical, nondissipative fireball dynamics with the fact that the total fireball luminosity , where is the ratio between the total fireball energy and the energy emitted in the gamma-rays, where .
The discussion in Pe’er et al. (2007) assumed a single Planck spectrum. However the discussion can be generalized to slightly distorted photospheric spectra, as in the ones discussed above. For instance, the -value we find here () indicates that at a certain observer time the photospheric radius increases with latitude angle, so for every time bin we therefore estimate an average photospheric radius. The values found below are similar to the ones found by approximating the spectrum with a single Planck function and applying the theory directly.
All the parameters evolve with time. In particular we find that the bulk Lorentz factor starts off at a value of close to for the first 6 s. Thereafter it rises sharply to a maximal value of (cf. Abdo et al., 2009). The time-averaged value (with standard deviation) for the bulk Lorentz factor is , while the time-averaged photospheric radius is found to be , see the right panel in Figure 2. The photospheric radius is remarkably stable compared to the variations in temperature and flux. Furthermore, since is most strongly dependent on the temperature, the evolution of these quantities track each other. We also estimate the radius at which the jet is launched to , and consequently the saturation radius . Here we assume nondissipative fireball dynamics. However, we note that the dynamics depends on the magnetization (Giannios & Spitkovsky, 2009) and on the presence of subphotospheric heating, such as tangential collimation shocks (Rees & Mészáros, 2005; Lazzati et al., 2009), and Coulomb heating (Beloborodov, 2009).
3. Discussion
The presence of a strong photospheric component in GRB spectra has been discussed by several authors (e.g. Goodman, 1986; Mészáros et al., 2002; Rees & Mészáros, 2005)111see also e.g. Paczynski (1986); Mészáros & Rees (2000); Lyutikov & Usov (2000); Daigne & Mochkovitch (2002); Drenkhahn & Spruit (2002); Ramirez-Ruiz (2005); Giannios & Spruit (2007); Pe’er et al. (2006); Ruffini et al. (2008). Here we have identified a strong photospheric component in GRB090902B, which is modelled by a multicolor blackbody. It dominates over the nonthermal component, being nearly 100% at early times.
Varying energy injection at the central engine, or variations caused by interaction with the progenitor material can cause the observed variability in the light curve. The flow is advected through the photosphere, where the thermal emission escapes. A fraction of the kinetic energy stored in the flow is later dissipated and emitted as nonthermal emission, e.g. synchrotron radiation. It is therefore expected that both the thermal and nonthermal emission reflect the properties and original energy injection at the central engine and thus are correlated with each other. This is consistent with the high correlation observed, with a time lag of approximately 0.5 s. Such a lag corresponds to a shock radius at which the optical depth ensuring an optically thin-emission site.
Abdo et al. (2009) estimated a lower limit on the bulk flow Lorentz factor by combining the energy of the 11.16 GeV photon, observed at 11 s after the GBM trigger, with the variability timescale in the LAT data which was determined to be s: The gamma-ray opacity for pair production should be less than unity in order to allow the photons to escape without attenuation from the flow. This Lorentz factor is slightly higher than the value we determined above for the flow advected through the photosphere. However, the estimations of based on opacity arguments are sensitive to uncertainties in determining the variability time (Zhang & Pe’er, 2009). Indeed, assuming that the variability timescale in the nonthermal component is set by the angular timescale at the shock radius, we have s. This value is consistent with the fact that there is not much variability strength on timescales shorter than 1 s, as measured by the power density spectrum of the LAT data. A variability timescale of 0.5 s yields , which is close the value we estimate. Finally, we note that the observed variability timescale in the GBM data should reflect the angular timescale of the photosphere. The determined value ms (Abdo et al., 2009) is larger than s, which is to be expected as shown by Pe’er (2008).
As shown above, the photospheric emission allowed us to estimate assuming nondissipative acceleration: . This is larger than the physical size around a solar mass black hole, typically assumed to be at the centre of the GRB engine, with a Schwarzschild radius of (Paczynski, 1986). This might be an indication of that the fireball dynamics includes significant dissipation during the acceleration phase and/or subphotospheric heating, which would lower the estimated value of . Alternatively, the larger size we find might correspond to the radius of the stellar core, at which the jet is launched. Thompson et al. (2007) argue that internal dissipation within the star prevents the Lorentz factor from significantly rising until the jet escapes the core of the progenitor star, such as a Wolf-Rayet star. However, Lazzati et al. (2009)) showed that the dissipative shocks in the jet continue far beyond the stellar radius, thereby influencing the jet dynamics.
Some bursts have no strong evidence of a narrow thermal component. For cases like GRB080916C which has a standard Band spectrum covering 6-7 orders of magnitude, the lack of a thermal component can be taken as an argument for a Poynting flux dominated flow (Zhang & Pe’er, 2009). For other cases that show a standard Band spectrum in a narrower energy range, like during the second half of the prompt phase in 090902b, it is possible that a modified photosphere spectrum with subphotospheric heating can account for the data (Pe’er et al., 2007; Beloborodov, 2009; Lazzati et al., 2009). Broadband observations of more GRB prompt emission spectra are desirable to more definitely diagnose the composition of GRB jets.
Acknowledgments
The LAT Collaboration acknowledges support for development and operation of the LAT, and scientific data analysis from NASA and DOE (USA) , CEA/Irfu, IN2P3/CNRS, and CNES (France), ASI, INFN, and INAF (Italy), MEXT, KEK, and JAXA (Japan), and the K.A.W. Foundation, VR and SNSB (Sweden). We thank Drs. Beloborodov and Lazzati for useful discussions. AP is supported by the Riccardo Giacconi fellowship at STScI and AJvdH by the NASA/MSFC Postdoc-program.
References
- Abdo et al. (2009) Abdo et al. 2009, ApJL, 706,138
- Atwood et al. (2009) Atwood, W. B., et al. 2009, ApJ, 697, 1071
- Band et al. (1993) Band, D., Matteson, J., Ford, L., et al. 1993, ApJL, 413, 281
- Beloborodov (2009) Beloborodov, A. M., 2009, ArXiv preprint 0907.0732
- Cucchiara et al. (2009) Cucchiara, A., Fox, D. B., Tanvir, N., & Berger, E. 2009, GCN, 9873
- Daigne & Mochkovitch (2002) Daigne, F., Mochkovitch, R. 2002, MNRAS, 336, 1271
- de Palma et al. (2009) de Palma, F., Breegon, J., & Tajima, H. 2009, GCN, 9867
- Drenkhahn & Spruit (2002) Drenkhahn, G., & Spruit, H. C. 2002, A&A, 391, 1141
- Ghirlanda et al. (2004) Ghirlanda, G., et al. 2004, ApJ,
- Ghirlanda et al. (2009) Ghirlanda, G., Ghisellini, G. & Nava, L. 2009, ArXiv preprint 0909.0016
- Giannios & Spitkovsky (2009) Giannios, D. & Spitkovsky, A. 2009, ArXiv preprint 0905.1970
- Giannios & Spruit (2007) Giannios, D. & Spruit, H. 2007, A&A, 469, 1
- Goodman (1986) Goodman, J., 1986, ApJ, 308, L47
- Kaneko et al. (2006) Kaneko, Y., Preece, R. D., Briggs, M. S. et al. 2006, 166, 298
- Kumar & Narayan (2009) Kumar, P. & Narayan, R. 2009, MNRAS, 395, 472
- Lazzati et al. (2009) Lazzati, D., Morsony, B. J. & Begelman, M. C. 2009, ApJL, 700, L47
- Lazzati et al. (2009) Lazzati, D., et al. 2009, in prep.
- Lyutikov & Usov (2000) Lyutikov, M., & Usov, V. V. 2000, ApJ, 543, L129
- Meegan et al. (2009) Meegan, C., Lichti, G., Bhat, N., et al. 2009, ApJ, in press
- Mészáros & Rees (2000) Mészáros, P. and Rees, M. J., 2000, ApJ, 530, 292
- Mészáros et al. (2002) Mészáros, P., Ramirez-Ruiz, E., Rees, M., Zhang, B. 2002, ApJ, 578, 812
- Paczynski (1986) Paczynski, B., 1986, ApJL, 308, L43
- Pe’er et al. (2005) Pe’er, A., Mészáros, P. & Rees, M. J., 2005, ApJ, 635, 476
- Pe’er et al. (2006) Pe’er, A., Mészáros, P. & Rees, M. J., 2006, ApJ, 642, 995
- Pe’er et al. (2007) Pe’er, A., Ryde, F., Wijers, R. A. M. J. et al. 2007, ApJL, 664, L1
- Pe’er (2008) Pe’er, A. 2008, ApJ, 682, 463
- Preece et al. (1998) Preece, R.D., Briggs, M.S., Mallozzi, R.S., et al. 1998, ApJ, 506, 23
- Preece et al. (2002) Preece, R.D., Briggs, M.S., Giblin, T.W., et al. 2002, ApJ, 581, 1248
- Razzaque et al. (2009) Razzaque, S., Dermer, C. D., & Finke, J. D. 2009, ArXiv preprint 0908.0513
- Rees & Mészáros (2005) Rees, M. J., & Mészáros, P. 2005, ApJ, 628, 847
- Ramirez-Ruiz (2005) Ramirez-Ruiz, E. 2005, MNRAS, 363, 61
- Ruffini et al. (2008) Ruffini, R., et al. 2008, arXiv:0804.2837
- Ryde (2004) Ryde, F. 2004, ApJ, 614, 827
- Ryde (2005) Ryde, F. 2005, ApJL, 625, L95
- Ryde et al. (2006) Ryde, F., Björnsson, C.-I., Kaneko, Y. et al. 2006, ApJ, 652, 1400
- Ryde (2008) Ryde, F. 2008, RSPTA, 366, 4405
- Ryde & Pe’er (2009) Ryde, F. & Pe’er, A. 2009, ApJ, 702, 1211
- Thompson et al. (2007) Thompson, C., Mészáros, P. & Rees, M. J., 2007, ApJ, 666, 1012
- Zhang & Pe’er (2009) Zhang, B. & Pe’er, A. 2009, ApJL, 700, L65
| Time | Model | PL Index | / | kTmax/ | C-stat | Red. C-stat | |
|---|---|---|---|---|---|---|---|
| (s) | (keV) | /DoF | |||||
| 0.00–1.28 | mBB+PL | 500/598 | 0.84 | ||||
| Band+PL | 497/597 | 0.83 | |||||
| 1.28–2.43 | mBB+PL | 555/598 | 0.93 | ||||
| Band+PL | 556/597 | 0.93 | |||||
| 2.43–3.33 | mBB+PL | 573/598 | 0.96 | ||||
| Band+PL | 561/597 | 0.94 | |||||
| 3.33–4.35 | mBB+PL | 535/598 | 0.89 | ||||
| Band+PL | 531/597 | 0.89 | |||||
| 4.35–5.38 | mBB+PL | 723/598 | 1.21 | ||||
| Band+PL | 722/597 | 1.21 | |||||
| 5.38–6.27 | mBB+PL | 668/598 | 1.12 | ||||
| Band+PL | 669/597 | 1.12 | |||||
| 6.27–7.04 | mBB+PL | 570/598 | 0.95 | ||||
| Band+PL | 564/597 | 0.94 | |||||
| 7.04–7.68 | mBB+PL | 564/598 | 0.94 | ||||
| Band+PL | 524/597 | 0.88 | |||||
| 7.68–8.06 | mBB+PL | 502/598 | 0.84 | ||||
| Band+PL | 493/597 | 0.86 | |||||
| 8.06–8.45 | mBB+PL | 486/598 | 0.81 | ||||
| Band+PL | 493/598 | 0.82 | |||||
| 8.45–8.83 | mBB+PL | 560/598 | 0.94 | ||||
| Band+PL | 557/597 | 0.93 | |||||
| 8.83–9.22 | mBB+PL | 600/598 | 1.00 | ||||
| Band+PL | 598/597 | 1.00 | |||||
| 9.22–9.47 | mBB+PL | 511/598 | 0.85 | ||||
| Band+PL | 499/597 | 0.84 | |||||
| 9.47–9.73 | mBB+PL | 484/598 | 0.81 | ||||
| Band+PL | 486/597 | 0.81 | |||||
| 9.73–9.98 | mBB+PL | 511/598 | 0.86 | ||||
| Band+PL | 511/598 | 0.85 | |||||
| 9.98–10.37 | mBB+PL | 532/598 | 0.89 | ||||
| Band+PL | 530/598 | 0.89 | |||||
| 10.37–10.75 | mBB+PL | 588/598 | 0.98 | ||||
| Band+PL | 582/597 | 0.97 | |||||
| 10.75–11.01 | mBB+PL | 522/598 | 0.87 | ||||
| Band+PL | 521/597 | 0.87 | |||||
| 11.01–11.39 | mBB+PL | 516/598 | 0.86 | ||||
| Band+PL | 673/597 | 1.13 | |||||
| 11.39–11.78 | mBB+PL | 541/598 | 0.91 | ||||
| Band+PL | 540/597 | 0.90 | |||||
| 11.78–12.16 | mBB+PL | 669/598 | 1.12 | ||||
| Band+PL | 508/597 | 0.85 | |||||
| 12.16–12.54 | mBB+PL | 537/598 | 0.90 | ||||
| Band+PL | 522/597 | 0.87 |
fix, unconstrained