Virtual Observatory: Science capabilities and scientific results
Abstract
The virtual observatory (VO) is a collection of interoperable data archives, tools and applications that together form an environment in which original astronomical research can be carried out. The VO is opening up new ways of exploiting the huge amount of data provided by the ever-growing number of ground-based and space facilities, as well as by computer simulations. This presentation summarises a variety of scientific results spanning various fields of astronomy, obtained thanks to the VO, after highlighting its structure, infrastructure and various capabilities.
European Southern Observatory, Karl-Schwarzschild-Str. 2, Garching bei München, Germany
1. Introduction
A Virtual Observatory (VO) is a collection of inter-operating data archives and software tools which utilize the Internet to form an environment in which original research can be conducted. The VO is an international astronomical community-based initiative, whose main goal is to allow transparent and distributed access to data available worldwide. This is achieved by developing and applying common standards and by ensuring the interoperability between the various data collections, tools and services. This allows scientists to discover, access, analyze, and combine observational and model data from heterogeneous data collections in a coherent and user-friendly manner.
2. The VO concept in modern Astronomy
The Virtual Observatory is a concept that arose from the need of modern-day astronomy to exploit the wealth of multi-instrument multi-wavelength datasets already available or to come very soon, in a quest to answer primordial questions such as that of the origin of the Universe, the formation and evolution of galaxies, the formation of stars and planets.
Even though single observations provide instantanés of smaller or larger parts of the Universe at a given wavelength regime and/or at a corresponding look-back time, a more in depth understanding of the Universe, its history and future requires sampling the whole electromagnetic spectrum and studying the different epochs. And this need generates the problem of accessing increasingly large amounts of data in combination of the huge volumes accumulated over the years and their subsequent exploitation.
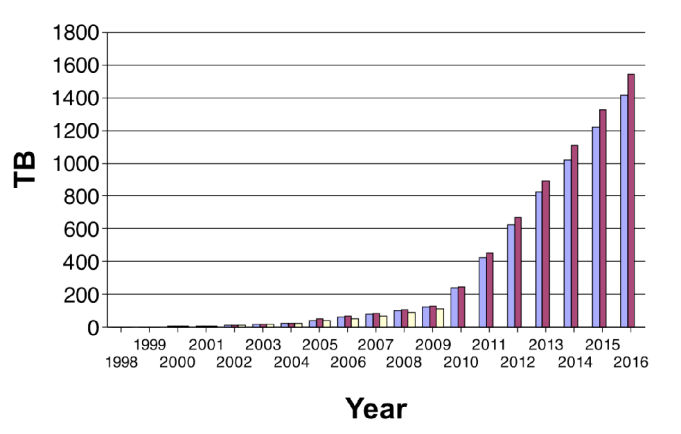
Modern observational astronomy is dominated by large multi-wavelength surveys producing TBs of data every night. As an example of exploding data rates, Fig. 1 shows the past and projected data volume in the ESO archive (in TBs) as a function of time. These new data as well as the older data are stored in different archives all over the world, in different ways and formats, can be queried from different archive interfaces using different access methods and can be analysed with different tools and techniques.
In this framework, the VO is simply an organised effort to provide the science users a centralised and uniform access to all these data without having them worrying about different formats and access mechanisms, while simultaneously providing all the necessary information, in the form of metadata, for a scientific usage of these data collections.
The VO, however, is not a centralised database of all the astronomical data. It does not store the data - it merely provides access to them. And it does not play the role of data police. The quality of the stored data is a responsibility of the data providers and it is up to them to make sure that their quality and accompanying metadata are sufficient to ensure high-quality scientific research based on their usage. Last but not least, the VO is not a monolithic software system and there is no such thing as a “killer application”. There is not (and there will never be) a unique tool dealing with all the aspects of imaging, spectral and tabulated data discovery, retrieval and subsequent analysis. Instead, it provides a suite of multi-purpose tools and services and it is up to the users to select those that suit them best, based on their needs.
In its current status, the VO is in a transitional phase, going from development to operations. The amount of reduced data offered via VO services increases by the day, the tools, applications and services become more and more mature and VO-enabled science is now taking place in parallel with development, indicating the most urgent needs in term of data availability, functionalities and standards.
3. The various VO entities
3.1. The International Virtual Observatory Alliance (IVOA)
In order to insure the world-wide interoperability of applications and the development and adoption of common standards, the International Virtual Observatory Alliance (IVOA) was formed in June 2002. The IVOA now comprises 17 VO projects from Armenia, Australia, Brazil, Canada, China, the European VO (EURO-VO), France, Germany, Hungary, India, Italy, Japan, Russia, South Korea, Spain, the United Kingdom, and the United States.
The IVOA is structured in Working and Interest Groups, each one responsible of a given area where key interoperability standards have to be defined and agreed upon. An IVOA standard could be described as a set of guidelines and rules for data providers or software developers who want their products (data or tools) to be VO compliant and interoperable. It describes the information necessary for a service or dataset to be VO compliant, both in terms of mandatory metadata and implementation. IVOA standards are only relevant to data providers and software developers and are meant to be completely transparent to the scientific user.
3.2. The European Virtual Observatory (EURO-VO)
The European Virtual Observatory (EURO-VO) project aims at deploying an operational VO in Europe. The EURO-VO is active in the areas of IVOA standards definition, tools development, as well as dissemination for scientific usage. Its internal structure consists of three bodies, namely the Data Centre Alliance, the Technology Centre and the Facility Centre.
-
•
the Data Centre Alliance, an alliance of European data centres, that provides the physical storage and publishes data, metadata and services to the EURO-VO using VO technologies;
-
•
the Technology Centre is a distributed organisation that coordinates a set of technological projects related to standards, systems and tools;
-
•
the Facility Centre, is the interface between the EURO-VO and the astronomical community. Its immediate aims are to introduce the VO capabilities to the European astronomers by means of workshops, Schools and tutorials and to support research carried out using the VO infrastructure.
3.3. Other national VO initiatives
Around the world, various national VO initiative are carrying out activities in support of data publishing and scientific usage of the VO. The US-VO111http://www.us-vo.org/, for instance, offers a centralised portal where users can look for data in the VO as well as exploit them with VO tools. The German VO (GAVO)222http://www.g-vo.org/ offers, among other things, access to theoretical data (e.g. Millenium simulation) through VO protocols.
4. VO tools and services
There is already a large variety of available VO-compatible applications for their immediate use to do science. Their level of maturity depends on a high degree on the level of maturity of the corresponding IVOA protocols and standards. As a consequence of the flexibility of the standards, as well as for historical reasons (i.e. many VO tools have evolved from existing pre-VO era applications) several of the applications might overlap in functionality.
Broadly speaking, VO tools can be classified in two main categories, namely data discovery and data analysis, with most tools, however, suitable for both categories. A major advance towards interoperability, was the development of SAMP, the Simple Application Messaging Protocol, that allows applications to communicate with each other, building thus a complete VO environment put together by various smaller pieces. For an up-to-date list of VO tools, applications and services listed either alphabetically or by functionality, see the section Software in the EURO-VO pages333http://www.euro-vo.org/software.html.
4.1. Data discovery
There is a variety of VO tools and services allowing for imaging, spectra and catalogue discovery, such as Aladin444http://aladin.u-strasbg.fr/aladin.gml developed by the CDS in France, Datascope555http://heasarc.gsfc.nasa.gov/cgi-bin/vo/datascope/init.pl provided by the US-VO, or VODesktop666http://www.astrogrid.org/wiki/Home/AboutAGDesktop developed by AstroGrid, to name a few. They allow the user to look for all the reduced data available in all the VO-compliant archives and data repositories (or registries) for a source, browse through them, select those of interest and visualise in various forms. Most of the tools, in their current state and in interactive (i.e. non scripting) mode allow either for single-object multi-resource query or for a multi-object single-resource query.
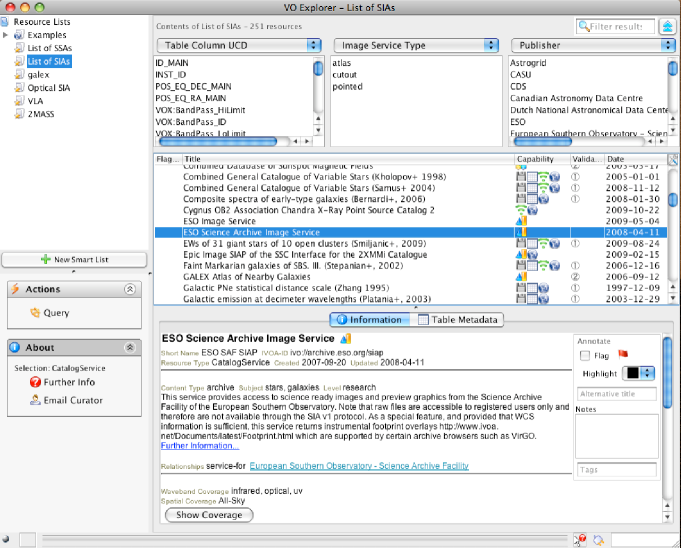
Fig. 2 shows the VODesktop interface. In the top left the list of resources grouped by user-defined criteria are shown. Each list consists of a variety of resources, shown in the right part of the window. For a selected resource, a detailed description is available at the bottom. The services provided by each resource are listed at the right of the resource name (e.g. cone search is marked by a green cone, a globe indicates a link to the web interface etc). The actions allowed for each selected resource are listed at the bottom left of the window. Filtering the resources is possible in a variety of ways, e.g. by service type, data Publisher, column and many more.
Already existing tools are being adapted to exploit the VO world. An interesting case is VirGO777http://archive.eso.org/cms/virgo/ (Hatziminaoglou & Chéreau 2009), the new ESO Archive Browser. Since its latest release (September 2009) VirGO comes with a collection of pre-configured VO data resources (from ESO and external data centers like HST, CADC, ESA etc). A new configuration panel gives the possibility to add new ones in a quick and straight-forward way. And like every other VO tool, VirGO now “speaks” SAMP, allowing for communication with other VO applications.
4.2. Data analysis
Imaging data analysis
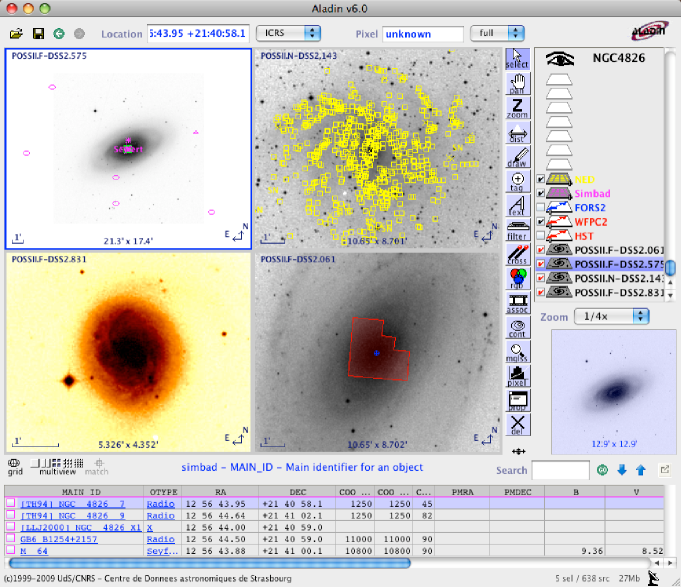
The most advanced imaging analysis VO tool to date is Aladin. It is an interactive sky atlas that allows the user to search, browse through and visualise images retrieved from VO resources, perform astrometric and photometric calibration on them, superpose catalogues and instruments fields of view, create colour-composite images and many more. It also includes a scripting capability for multi-object (by target name or coordinates) multi-resource search. Fig. 3 shows an Aladin main window, showing in a multi-view mode from right to left and top to bottom the following: NGC4826 Simbad objects in the field superposed; NGC6946 with all NED objects in the field; NGC1068 with a modified colour map; and M81 with the WFPC2 footprint on it.
Spectral analysis
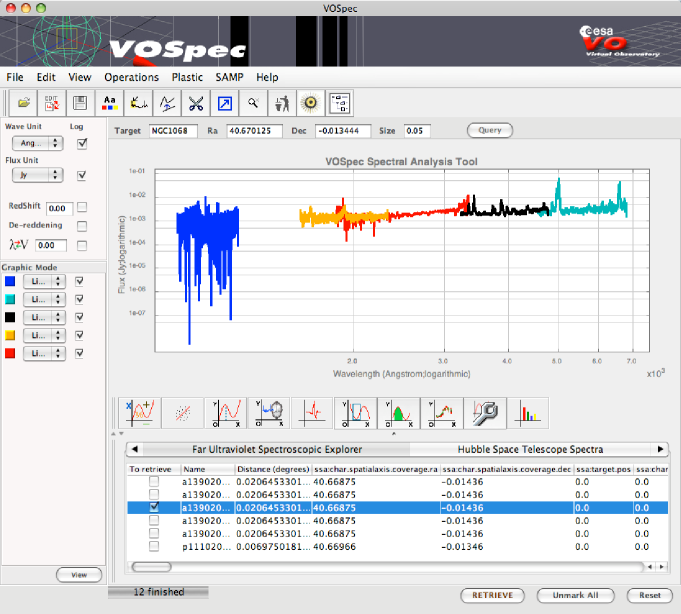
Today the VO has three spectral analysis tools to offer, all three of them very similar in functionalities, namely (in alphabetical order) Specview888http://www.stsci.edu/resources/software_hardware/specview/ provided by the US-VO, SPLAT-VO999http://star-www.dur.ac.uk/pdraper/splat/splat-vo/, provided by AstroGrid, and VOSpec101010http://www.sciops.esa.int/index.php?project=ESAVO&page=vospec, developed by ESA-VO.
All three tools allow the user to directly query all the available registries that contain ground-based and space spectral data and/or load local files. Other than the display capabilities, the tools provide various high level analysis modules such as line measurement and fitting, line identification etc. Fig. 4 shows a spectral energy distribution (SED) for NGC1068 built using FUSE, HST and ISO spectra, constructed with VOSpec.
Handling of tabular data
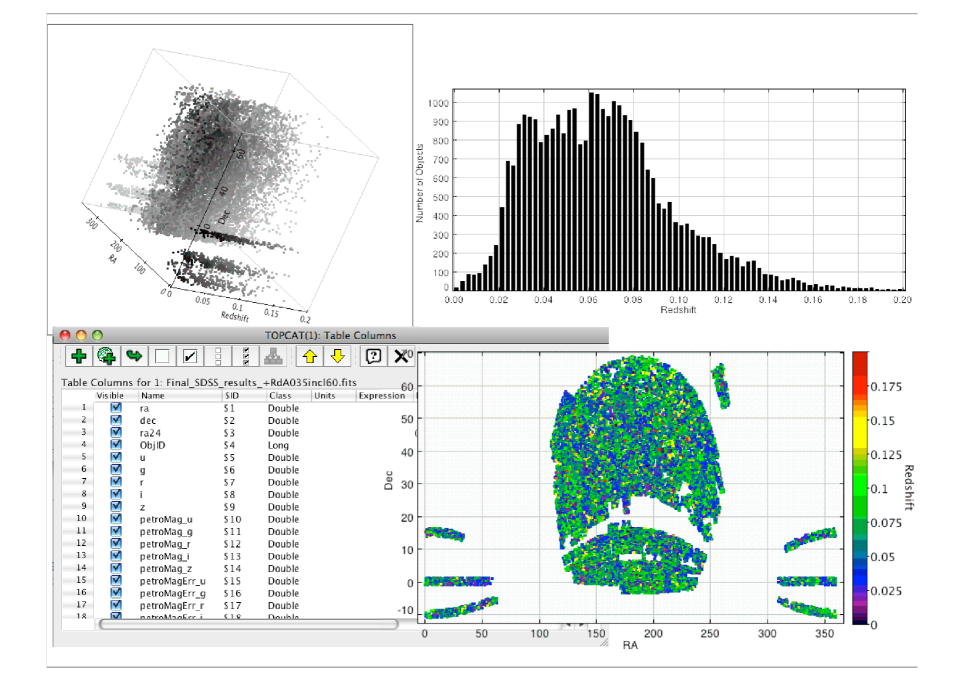
A nice example of a tabular data handling tool is TOPCAT111111http://www.star.bris.ac.uk/mbt/topcat/, distributed as part of the AstroGrid tool suite. TOPCAT offers a wide variety of data visualisation functionalities, such as histogrammes, scatter plots, 3D and density plots; table and column metadata visualisation and editing (e.g. operation among columns, coordinate transformations); table format conversions (supported formats include ascii, fits, VOTable, tsv and csv [tap- and coma-separated values tables, respectively], latex and more); cross-correlation capabilities of up to four tables simultaneously using various cross-correlation algorithms and many more. It also uses VO standards in order to query the VO-compliant resources and therefore allows the user to combine data residing on a local disk with data available through the VO. Thanks to the implementation of SAMP, TOPCAT can also communicate with all other VO tools and applications. Fig. 5 shows a collection of screenshots of the above-mentioned capabilities.
For tables larger than a few tens of thousands of rows, STILTS121212http://www.star.bris.ac.uk/mbt/stilts/, the STIL Tool Set, a command-line tool is recommended. STILTS performs pretty much the same operations TOPCAT does but in a non-interactive, scriptable way. It is also recommended in case of operations having to be repeated several times.
VOPlot131313http://vo.iucaa.ernet.in/voi/voplot.htm is an alternative to TOPCAT, developed by VO-India, capable of operating on tables in VOTable format. Aladin has also some table querying and handling capabilities. It allows to query the VO registry for all available tabular datasets based on coordinates or target names, and allows for cross-correlations. Cross-correlations of up to three tables simultaneously and up to 5000 objects at a time can also be performed using Open SkyQuery141414http://www.openskyquery.net/Sky/skysite/OSQform/default.aspx developed by the US-VO.
5. Recent scientific results
The number of VO-enabled publications is now rising and the research carried out is covering all aspects on modern astronomy, from solar and stellar physics to extragalactic astronomy and cosmology. The main goal of the VO has been to allow for a seamless data access across archives; and even though VO tools and infrastructure are mostly used as a platform for data mining, other types of usage such as using VO tools for combined data visualisation, has been seen in the recent literature.
Ever since the first, fully VO-enabled discovery of 31 type 2 QSO candidates in the GOODS fields (Padovani et al. 2004), many new discoveries were made with the help of VO applications and services. An exploitation of the IPHAS catalogue (Gonzáles-Solares et al. 2008) in combination with 2MASS in an area of 1600 square degrees recently revealed 23 accreting young, low-mass stars and brown dwarfs far from known star-forming regions (Valdivielso et al. 2009), suggesting the existence of hundreds of such objects in the area covered by IPHAS. Similarly, a high proper motion L sub-dwarf was recently identified in the SDSS catalogue combining SDSS and 2MASS spectrophotometric information (Sivarani et al. 2009). Taking advantage of the wide field of view of HRI/ROSAT and the availability of public data through VO tools, Caballero et al. (2009) investigated the daily X-ray variability of 23 stars in the young Orionis cluster. They detected unusual flares with durations of about six days, duration considerably larger than the 24 hours usually observed in active stars residing in very young star forming regions. This last work is actually part of an ongoing investigation of the Orionis region that also revealed large numbers of previously unknown brown dwarf candidates by pasting together various large photometric catalogues (Caballero 2008; Caballero & Solano 2008).
A major contribution of the VO to astronomy is the possibility it offers for retrieving, exploiting and visualising large datasets. These capabilities have been extensively used lately to produce new results. In Fathi et al. (2009) for instance, a sample of 55000 Sa-Sd SDSS galaxies was selected, cross-correlated with HyperLeda151515http://leda.univ-lyon1.fr/ in order to extract the morphological information and then u, g, r, i, z, J, H and K band images for each one of them were retrieved from SDSS and 2MASS using various VO services, with the aim of studying the scale length of disk galaxies as a function of redshift and morphology. Large catalogues of legacy value constructed with the help of the VO infrastructure have also been published recently. One example is the Large Quasar Astrometric Catalogue (LQAC; Souchay et al. 2009) that contains 113666 quasars with photometry in u, b, v, g, r, i, z, J, K as well as redshift and radio fluxes at 1.4, 2.3, 5.0, 8.4 and 24 GHz, when available. This catalogue is the results of the combination of the 12 largest quasar catalogues available in the literature.
The volume of datasets available through VO protocols is increasing exponentially, thanks to many large projects and surveys providing their data through VO-compliant interfaces but also thanks to the smaller projects that make the extra effort of adding a “VO-layer” to their data and publishing them using VO protocols. Recently, the Hubble Legacy Archive (HLA) made available through VO interfaces all HLA NICMOS G141 grism spectra (Freudling et al. 2008), enabling thus flexible querying of the 2470 available spectra. An example of feedback from the community to the VO was the effort off putting together a catalogue of quasar candidates selected from their photometry extracted from the SDSS DR7, presented in D’Abrusco et al. (2009). The two methods used for the quasar candidates selection, namely the probabilistic principal surfaces and the negative entropy clustering, were subsequently implemented into the AstroGrid VO platform.
Smaller and larger projects are also using the VO tools for their visualisation capabilities. Such an example is Exo-Dat, the information system created to support CoRoT (Deleuil et al. 2009). Exo-Dat has implemented various IVOA protocols and output formats and allow for a direct interfacing with VO tools such as Aladin and TOPCAT, avoiding thus having to develop its own visualisation tools that would overlap in functionality with that of the existing VO applications.
6. Conclusions
The scientific usage of the VO tools and infrastructure is now taking up, and this is reflected by the increasing number of refereed and other publications making use of the VO capabilities. The EURO-VO and other national VO initiative are here to help interested groups to carry out VO-enabled research and provide support for projects that want to publish their data in the VO. Dedicated initiatives such a workshops and Schools are organised world-wide in order to make astronomers aware of the grand potential of the VO and the scientific possibilities it offers.
References
- Budavári et al. (2009) Budavári T. et al., 2009, ApJ, 694, 1281
- Caballero et al. (2009) Caballero J.A., López-Santiago J., de Castro E., Conride M., 2009, AJ, 123, 5012
- Caballero (2008) Caballero J.A., 2008, A&A, 478, 667
- Caballero & Solano (2008) Caballero J.A. & Solano E., 2008, A&A, 485, 931
- D’Abrusco et al. (2009) D’Abrusco R., Longo G., Walton N.A., 2009, MNRAS, 396, 223
- Deleuil et al. (2009) Deleuil et al., 2009, AJ, 138, 694
- Eglitis & Suchar (2009) Eglitis P. & Suchar D., 2009, PV2009 Conference, ESAC, Villafranca del Castillo, Spain, 1-3 December, 2009
- Fathi et al. (2009) Fathi K. et al., Scale Length of Disk Galaxies, Proceedings of the EURO-VO Workshop, ESAC, Villafranca del Castillo, Spain, 1-3 December, 2008, Eds.: D. Baines and P. Osuna, Published by the European Space Agency, p.39
- Freudling et al. (2008) Freudling W. et al., 2008, A&A, 490, 1165
- Gonzáles-Solares et al. (2008) González-Solares E. et al., 2008, MNRAS, 388, 89
- Hatziminaoglou & Chéreau (2009) Hatziminaoglou E. & Chéreau F., VirGO: A Visual Browser for the ESO Science Archive Facility, The Messenger, 135, 46
- Padovani et al. (2004) Padovani P., Allen M., Rosati P., Walton N., 2004, A&A, 424, 545
- Sivarani et al. (2009) Sivarani T., Lépine S., Kembhavi A., Gupchup J., 2009, ApJ, 694, 140
- Souchay et al. (2009) Souchay J. et al., 2009, A&A, 494, 799
- Valdivielso et al. (2009) Valdivielso et al., 2009, A&A, 497, 973