Third moments of conserved charges in QCD phase diagram
Abstract:
We point out that the third moments of conserved charges, the baryon and electric charge numbers, and energy, as well as their mixed moments, change their signs around the QCD phase boundary in the temperature and baryon chemical potential plane. These signs can be measured in relativistic heavy ion collisions, and will give clear information on the phase structure of QCD and the state of the system in the early stage of relativistic heavy ion collisions. The behaviors of these moments on the temperature axis and at small quark chemical potential can be analyzed in lattice QCD simulations. We emphasize that the third moments obtained on the lattice, together with the experimental results, will provide a deep understanding about the QCD phase diagram and the location of the state created in heavy ion collisions.
1 Introduction
It is believed that the phase diagram of Quantum chromodynamics (QCD) in the temperature () and baryon chemical potential () plane has a critical point where the first order phase transition at low and high terminates [1]. It is one of the most challenging subject to confirm the existence of the QCD critical point experimentally using the relativisitc heavy ion collisions. A method suggested for this purpose is to exploit fluctuation observables. The singularity at the critical point, at which the transition is of second order, can cause enhancements of fluctuations if fireballs created by heavy ion collisions pass near the critical point during the time evolution [2, 3]. If such enhancements are sufficiently large and if the fluctuations can survive until the freezeout, enhancements of fluctuations will be observed by event-by-event analysis in heavy ion collisions. Because of finite size effects and critical slowing down, however, such singularities are blurred and its experimental confirmation would be quite difficult [4, 5]. In fact, so far no clear evidence for the critical point has been detected [6].
Other proposed way to exploit fluctuation observables to analyze the phase structure of QCD are those to use fluctuations of conserved charges [7, 8]. Since some fluctuations of conserved charges behave differently between the hadronic and quark-gluon phases, these fluctuations may be used as an indicator of the realization of the phase transition. Approaches to use higher order moments for this purpose have been also suggested recently [9] and experimental attempts to measure those higher order moments were reported, for example, in Ref. [10].
2 Third moments of conserved charges
Almost all previous studies focus on the absolute value, especially the enhancement, of each observable around the phase boundary. In the present talk, we propose to employ signs of third moments of conserved charges around the averages, which we call, for simplicity, the third moments in the following, to infer the states created by heavy ion collisions [11]. In particular, we consider third moments of conserved quantities, the net baryon and electric charge numbers, and the energy,
| (1) |
where with represent the net baryon and electric charge numbers in a subvolume , respectively, denotes the total energy in , , and . We also make use of the mixed moments defined as follows:
| (2) |
To understand the behaviors of these moments around the QCD phase boundary, we first notice that the moments Eqs. (1) and (2) are related to derivatives of the thermodynamic potential per unit volume, , up to third order with respect to the corresponding chemical potentials and . The simplest example is , which is given by
| (3) |
where the baryon number susceptibility, , is defined as
| (4) |
The baryon number susceptibility diverges at the critical point and has a peak structure around there [2, 12, 13]. Since is given by the derivative of as in Eq. (3), the existence of the peak in means that changes its sign there. Although the precise size and shape of the critical region are not known, various models predict that the peak structure of well survives far along the crossover line [12, 1] (See, the left panel of Fig. 1 as a demonstration of this feature in a simple effective model; the details will be explained later). This means that the near (hadron) and far (quark-gluon) sides of the QCD phase boundary can be distinguished by the sign of over a rather wide range around the critical point. As we shall see later, all third moments presented in Eqs. (1) and (2) can be expressed in terms of derivatives of corresponding susceptibilities, which diverge at the QCD critical point and hence change their signs there.
The third moments can be measured in heavy ion collisions by the event-by-event analysis similarly to fluctuations, provided that and/or in a given rapidity range, , in fireballs created by collisions is determined in each event. The measurement of is difficult because of the difficulty in identifying neutrons. On the other hand, and can be measured with the existing experimental techniques. Four out of the seven third moments in Eqs. (1) and (2) composed of and thus can be determined experimentally.
All quantities we are considering here, and , are conserved charges and the variation of their local densities requires diffusion. In Ref. [7], it was shown that the effect of diffusion is small enough for the fluctuations of the baryon and electric charges if the rapidity range is taken to be . In the estimate, the one dimensional Bjorken expansion and straight particle trajectories were assumed. If the contraction of hadron phase due to the transverse expansion and the short mean free paths are taken into account, the above estimate will be more relaxed.
Once the negativeness of third moments is established experimentally, it is direct evidence of two facts: (1) the existence of a peak structure of corresponding susceptibility in the phase diagram of QCD, and (2) the realization of hot matter beyond the peak, i.e. the quark-gluon plasma, in heavy ion collisions. We emphasize that this statement using the signs of third moments does not depend on any specific models. The experimental measurements of signs of moments also have an advantage compared to their absolute values: it is usually essential to normalize experimentally obtained values by extensive observables, such as the total charged particle number , in order to compare the experimental results with theoretical predictions [7, 8]. In the measurement of signs, however, normalization is not necessary. It is this feature that our proposal is less subject to experimental and theoretical ambiguities and more robust than previously proposed ones.
3 Analogy to mountain climbing
The advantage of using signs of third moments, instead of enhancements of absolute values, would be nicely explained in an analogy to mountain climbing. Now, we theoretically expect the existence of “mountains” of susceptibilities (See, the left panel of Fig. 1) in the QCD phase diagram. Experimentalists try to confirm the existence of the peak in heavy ion collisions, in other words, by directly climbing the mountains. During this expedition, in order to confirm the existence of the peak previous strategy using fluctuation observables tried to measure the altitude, i.e. the value of susceptibility itself. On the other hand, our proposal to use the third moments would be compared to the measurement of the derivative of trails. If one has experiences of climbing mountains, one knows that the measurements of altitude is difficult, but it is quite easy to recognize whether one is going up or down, namely to recognize just the sign of the derivative of the slope, at each moment of mountain climbing. In particular, if one has ever arrived at the edge of the mountains, one knows that it is the most impressive moment during the mountain climbing; derivative of the trail changes positive to negative there, and completely different scenary suddenly manifests itself in front of you. Such a moment is so unique that one can clearly realize that he/she arrives at the edge. To confirm the existence of the moutanins, therefore, the altimeter is not necessary. Measuring the derivative of trail is a much easy and robust way for this purpose.
In terms of the third moments of conserved chages, experimental confirmation of the sign should be easier than that of the absolute value. Furthermore, once the negativeness of third moments is established experimentally, it is quite strong evidence of the existence of peak structure of corresponding susceptibility; no model dependences enter this statement. Of course, measuring the negative third moments in experiments depends on whether the fireballs can remember the impressive moment until the freezeout, or not. Exploiting the moments of conserved chages plays a crucial role for this discussion, as argued above. As the experience of arriving at the edge would be so impressive, why don’t we anticipate that the we can remember the moment even after you come back home?
4 Other third moments
Let us now consider the behavior of third moments other than around the critical point. First, the third moment of the net electric charge is calculated to be
| (5) |
where represents the chemical potential associated with , i.e. , and the isospin chemical potential is defined as with being the chemical potentials of the up and down quarks, respectively. In relativistic heavy ion collisions, the effect of isospin symmetry breaking is small. Assuming the isospin symmetry, the second and last terms in Eq. (5) vanish and one obtains
| (6) |
with the isospin susceptibility . Under the isospin symmetry, does not diverge at the critical point because the critical fluctuation does not couple to the isospin density [3]. The critical behavior of the term in the parenthesis in Eq. (6) in the vicinity of the critical point is thus solely governed by . Since is a derivative of this term, a similar behavior as is expected.
Next, it can be shown that mixed moments including a single E are concisely given by
| (7) |
with , Q, where is the electric charge susceptibility. The derivative in Eq. (7) is taken along the radial direction from the origin with fixed , i.e. . Since diverges at the critical point, Eq. (7) again leads to a similar behavior of as the above-mentioned moments.
To argue the behaviors of remaining third moments including two or three E’s, it is convenient to first define . The third moments are then given by
| (8) |
Since is the second derivative of along a radial direction, it diverges at the critical point which belongs to the same universality class as that of the 3D Ising model. Therefore, , , and , all change their signs at the critical point.
5 Region with negative third moments and possible lattice analysis
While the above arguments, based on the divergence of second derivative of , guarantee the appearance of the region with negative third moments in the vicinity of the critical point, they do not tell us anything about the size of these regions in the - plane. In fact, all third moments considered here become positive at sufficiently high and , where the system approaches a free quark and gluon system. The regions are thus limited more or less near the critical point.
The information about the behavior of the third moments at small can be extracted from the numerical results in lattice QCD. For example, with the Taylor expansion method the thermodynamic potential is calculated to be , and one can read off the behavior of at small as . Lattice simulations indicate that is positive definite, while becomes negative in the high temperature phase [15]. From this result one sees that is positive for small , while the negative suggests that the sign of eventually changes at sufficiently large . Other moments for small can also be evaluated in the Taylor expansion method by expanding with respect to and . If the contour lines of vanishing third moments are close enough to the -axis, the lattice simulations may be able to determine these lines. Since the region with a negative third moment should depend on channels, combined information of signs of different third moments, and the comparison of the third moments obtained by experiments and lattice simulations, will provide a deep understanding about the state of the system in the early stage of relativistic heavy ion collisions and the QCD phase diagram.
6 Analysis in a toy model
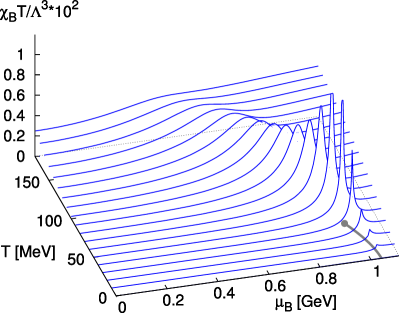
The range of where lattice simulations are successfully applied is, however, limited to small with the present algorithms. In particular, thermodynamics around the critical point cannot be analyzed with the Taylor expansion method. In order to evaluate the qualitative behavior of the third moments in such a region, one has to resort to effective models of QCD. To make such an estimate, here we employ the two-flavor Nambu-Jona-Lasinio model [16] with the standard interaction , where denotes the quark field. For the isospin symmetric matter, this model gives a first order phase transition at large , as shown on the bottom surface of the left panel of Fig. 1 by the bold line.
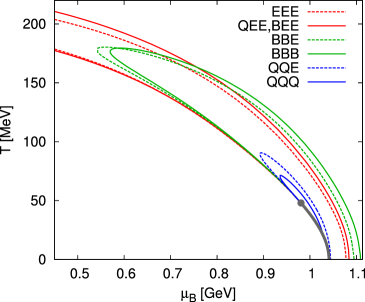
In the left panel of Fig. 1, we also show the and dependence of calculated in the mean-field approximation. One observes that diverges at the critical point, and the peak structure well survives along the crossover line up to higher temperatures [12]. The region where each moment becomes negative in the - plane is shown in the right panel of Fig. 1. The figure shows that areas with and extend to much lower and much higher than the critical point. This suggests that even if the critical point is located at high the negative third moments can be observed by heavy ion collision experiments. The figure also shows that the areas have considerable thicknesses along the radial direction. Since the system stays near the phase transition line considerably long regardless of the order of the phase transition, first order or crossover, once the state on the far side is created, negative third moments are very likely to be formed and observed. The wide regions of negative moments also indicate that they are hardly affected by critical slowing down during the dynamical evolution of fireballs.
The right panel of Fig. 1 also shows that areas with negative , , and are much larger than those of the other moments in the - plane; although not shown in the figure, these areas extend even to the -axis. The behaviors of and near the -axis can be checked directly by the lattice simulations. If the range of satisfying is sufficiently wide at , it is possible that the negative third moments are measured even at the RHIC and LHC energies. Whether the negative moments survive or not in this case depends on the diffusion time of the energy density, in other words the heat conductivity. One can thus use the signs of and to estimate the diffusion time of the charges and energy. The third moments and , on the other hand, become negative only in a small region near the critical point. These behaviors come from the large contribution of in Eq. (6).
7 Summary
In this talk, we have pointed out that the third moments of conserved charges, the net baryon and electric charge numbers and the energy, change signs at the phase boundary corresponding to the existence of the peaks of susceptibilities. If the negative third moments grow at early stage of the time evolution of fireball created in the collisions and if the diffusion of charges is slow enough, then the negative third moments will be measured experimentally through event-by-event analyses. Once such signals are measured, they serve as direct evidence that the peak structure of corresponding susceptibility exists in the phase diagram of QCD, and that the matter on the far side of the phase transition, i.e. the quark-gluon plasma is created. The combination of the third moments of different channels, and their comparison with the numerical results in lattice QCD will reveal various issues on the phase structure and initial states created in heavy ion collisions at different energies.
References
- [1] M. A. Stephanov, PoS LAT2006, 024 (2006).
- [2] M. A. Stephanov, K. Rajagopal, and E. V. Shuryak, Phys. Rev. Lett. 81, 4816 (1998); Phys. Rev. D 60, 114028 (1999).
- [3] Y. Hatta and M. A. Stephanov, Phys. Rev. Lett. 91, 102003 (2003) [Erratum-ibid. 91, 129901 (2003)].
- [4] B. Berdnikov and K. Rajagopal, Phys. Rev. D 61, 105017 (2000).
- [5] C. Nonaka and M. Asakawa, Phys. Rev. C 71, 044904 (2005).
- [6] I. Arsene et al. [BRAHMS Collaboration], Nucl. Phys. A 757, 1 (2005); B. B. Back et al. [PHOBOS Collaboration], Nucl. Phys. A 757, 28 (2005); J. Adams et al. [STAR Collaboration], Nucl. Phys. A 757, 102 (2005); K. Adcox et al. [PHENIX Collaboration], Nucl. Phys. A 757, 184 (2005).
- [7] M. Asakawa, U. W. Heinz, and B. Muller, Phys. Rev. Lett. 85, 2072 (2000).
- [8] S. Jeon and V. Koch, Phys. Rev. Lett. 85, 2076 (2000).
- [9] S. Ejiri, F. Karsch, and K. Redlich, Phys. Lett. B 633, 275 (2006); M. A. Stephanov, Phys. Rev. Lett. 102, 032301 (2009); M. Cheng et al., arXiv:0811.1006 [hep-lat].
- [10] T. K. Nayak [STAR Collaboration], arXiv:0907.4542 [nucl-ex].
- [11] M. Asakawa, S. Ejiri and M. Kitazawa, arXiv:0904.2089 [nucl-th].
- [12] Y. Hatta and T. Ikeda, Phys. Rev. D 67, 014028 (2003).
- [13] H. Fujii, Phys. Rev. D 67, 094018 (2003).
- [14] C. Nonaka, B. Muller, S. A. Bass, and M. Asakawa, Phys. Rev. C 71, 051901 (2005).
- [15] C. R. Allton et al., Phys. Rev. D 71, 054508 (2005).
- [16] T. Hatsuda and T. Kunihiro, Phys. Rept. 247, 221 (1994).