RR Lyrae Variables in the Local Group Dwarf Galaxy NGC 147
Abstract
We investigate the RR Lyrae population in NGC 147, a dwarf satellite galaxy of M31 (Andromeda). We used both Thuan-Gunn -band ground-based photometry from the literature and Hubble Space Telescope Wide Field Planetary Camera 2 archival data in the F555W and F814W passbands to investigate the pulsation properties of RR Lyrae variable candidates in NGC 147. These datasets represent the two extreme cases often found in RR Lyrae studies with respect to the phase coverage of the observations and the quality of the photometric measurements. Extensive artificial variable star tests for both cases were performed. We conclude that neither dataset is sufficient to confidently determine the pulsation properties of the NGC 147 RR Lyraes. Thus, while we can assert that NGC 147 contains RR Lyrae variables, and therefore a population older than 10 Gyr, it is not possible at this time to use the pulsation properties of these RR Lyraes to study other aspects of this old population. Our results provide a good reference for gauging the completeness of RR Lyrae variable detection in future studies.
1 Introduction
Local Group dwarf galaxies exhibit diversity in their star formation histories (Da Costa & Mould 1998; Grebel 1999). Most of these galaxies show some evidence for intermediate age stars and some have even younger populations along with a significant amount of gas and dust. The broad red giant branch (RGB) morphology shown in their color-magnitude diagrams (CMDs) reflects a wide range of metallicities and/or ages, implying that these galaxies have experienced complex star formation histories. Despite their different and complex star formation histories, RR Lyrae variables are believed to exist in most if not all dwarf galaxies in the Local Group. The existence of RR Lyrae (RRL) populations in a given stellar system indicates that the system is older that 10 Gyr. Furthermore, their pulsation properties and absolute magnitudes are correlated with their metallicities (Bono et al. 2003; Bono et al. 2007; Kunder & Chaboyer 2009). Therefore, detailed investigations of the physical properties of RRL variable stars are crucial to improve our understanding of the early stages of star formation in Local Group dwarf galaxies.
NGC 147 is one of the dwarf spheroidal (dSph) satellites of the Andromeda galaxy (M31). In terms of its morphology, NGC 147 is a typical dwarf elliptical or spheroidal galaxy. However, it is distinct from other dwarf galaxies in the Local Group, with the possible exception of Tucana (Fraternali et al. 2009), because NGC 147 is dominated by an old stellar population (Hodge 1989). There is a slight indication of intermediate age stars (e.g. extended asymptotic giant branch stars) concentrated in the central regions (Han et al. 1997), but their signature is weaker than the intermediate age stellar populations found in other Local Group dwarf galaxies. Furthermore, NGC 147 appears to show a complete deficit of gas and dust.
The presence of an RR Lyrae population in NGC 147 was reported by Saha et al. (1990, hereafter S90). They used Thuan-Gunn -band ground based photometry obtained from the Hale 5m telescope equipped with the 4-shooter CCD system to identify RR Lyrae variables in this galaxy. They found 32 RR Lyrae candidates and determined the distance modulus of NGC 147 to be = 23.92 based on their mean apparent -band magnitudes. Their periods and amplitudes were estimated by using a prototype of the phase dispersion minimization method developed by Lafler & Kinman (1965), the so-called L-K method. Saha et al. (1990) did not present a comparison of the pulsation properties of these RR Lyrae candidates with those in other Local Group galaxies. One reason for this may be that the large photometric errors ( 0.15 mag) at the level of the horizontal branch (HB) of NGC 147 produced significant errors in the period determinations - especially for the shorter period RR Lyraes (P 0.4 d). However, the effect of the photometric errors on the period determination was not addressed because the L-K method ignores the photometric errors in the process of identifying the optimal period.
Saha et al’s (1990) paper appears to be the only previous study of the RR Lyrae population in NGC 147. We are motivated to revisit the properties of these stars for two reasons. First, we have had good success in using a light curve template-fitting algorithm (Layden & Sarajedini 2000) to determine the properties of RR Lyraes such as periods, amplitudes, and mean magnitudes. This method includes the photometric errors in the analysis and has been streamlined and redesigned to be more user-friendly by Mancone & Sarajedini (2008). This will allow us to refine the determination of the RRL periods and place better constraints on the total number of such variables in NGC 147. Second, there are archival imaging data from the Hubble Space Telescope (HST) Wide Field Planetary Camera 2 (WFPC2) for NGC 147 that may allow us to update the list of RR Lyraes published by S90. Although the WFPC2 data provide accurate photometry at the level of the HB in NGC 147, they exhibit poor phase coverage with a time baseline of 0.4 day. However, it is still useful because it could help to identify the shorter period, lower amplitude RR Lyrae stars that may not have been detected by S90.
The next section describes the observational datasets that we will analyze. Sections 2 and 3 make it clear that neither the S90 data nor the WFPC2 data are ideal for the purpose of studying the RR Lyraes in NGC 147, but they do complement each other nicely. As discussed in Section 4, it is important to carry out simulations to fully understand the biases and caveats inherent in the results obtained from each of the datasets. The conclusions are presented in Section 5 as well as the case for future work to better characeterize the variable stars in NGC 147 and its M31 dwarf satellite cousin NGC 185.
2 Observations and Data Reduction
2.1 Ground Based Data
The -band (Thuan & Gunn 1976) photometry of NGC 147 is available in data tables provided by S90. The target field, located northwest of the galaxy’s center along the semi-major axis, was observed 15 times with 20 min exposures in 1986, and 8 times with 30 min exposures in 1987, both using the Hale 5m telescope with the 4-shooter CCD. The 30 min exposures were obtained during four consecutive nights. The limiting magnitude of their photometry is , which is about 1.25 magnitude fainter than the HB magnitude of NGC 147. The photometric completeness of the HB stars (at 25.5) is 62 in the crowded regions and 72 in those that are less crowded. The photometric errors for the HB stars are mag, which is comparable to the amplitude of c-type or low amplitude ab-type RR Lyrae variables. Bailey ab-type stars are fundamental mode pulsators which have a sawtooth-like, asymmetrical light curve shape, while first-overtone c-type pulsators have sinusoidal light curves. RRL with ab-type (RRab) have longer periods (0.5 P 1.2 days) than the c-types (RRc) stars (0.2 P 0.5 days; Smith 1995)
2.2 Hubble Space Telescope Data
Observations taken with HST/WFPC2 of the outer regions of NGC 147 are available in the HST archive (Han et al, 1997, program ID : GO-6233). The target field, located at 4′ south of the galaxy’s center, was imaged 7 times in F555W (V) and 6 times in F814W (I), with exposure times from 1300s to 2800s as detailed in Table 2. The time baseline of the dataset spans 0.4 days. The observations were primarily intended to study the characteristics of the (nonvariable) stellar populations of NGC 147.
All of the WFPC2 images were photometered by using the HSTphot package (Dolphin 2000), which is designed for use on WFPC2 data. First, any image defects, such as bad pixels, cosmic rays, and hot pixels were removed by using the utility software included within HSTphot. Then, the photometric measurements were made on each image by running HSTphot in “PSF fitting” mode. HSTphot uses a library of point spread functions (PSFs) for WFPC2 images. The aperture corrections, defined by the average difference between aperture photometry with a 0.5” radius and the PSF photometry, were also applied by HSTphot. A minimum threshold for object detection was set 3 above the background signal. We selected stars with high-quality photometry (i.e. stellar profiles with mag) from the output of HSTphot for further analysis.
Figure 1 shows the VI CMD of NGC 147 from the HST/WFPC2 data. The photometric limit reaches V 28.2 mag. The broad red giant branch (RGB) of NGC 147 primarily indicates a wide range of metallicity among the stellar populations in this galaxy. This figure also shows a blue horizontal branch (BHB) and a distinct instability strip gap which is the well known location of RR Lyrae variable stars. We performed completness tests of our photometry using HSTphot’s artificial star feature. This module creates a comparable number of artificial stars for each color-magnitude bin from the observed CMD and randomly distributes these in each of the original WFPC2 image. The artificial stars are photometered in exactly the same manner as the actual stars. Figure 2 illustrates the result of these completeness tests. At the magnitude of the HB (V 25.5 mag), the completeness level is about 95%. Therefore, we do not expect photometric incompletness to adversely affect the detection of RR Lyrae candidates identified in the WFPC2 data.
3 RR Lyrae Period Determination
The previous study (Saha et al 1990) used the Lafler-Kinman (L-K) algorithm (Lafler & Kinman 1965), a prototype of the phase dispersion minimization method (PDM) for period determination. The L-K algorithm defines a test parameter, , the sum of the squares of the differences between two adjacent magnitudes rearranged in the ascending order of phases for each trial period. The algorithm then searches for the period that minimize the test parameter. Since the L-K method uses only one free parameter (period) for the period optimization, the calculation is relatively simple, straightforward, and faster than other period finding routines. However, it does not take into account some important factors, such as the amount of photometric error. Large photometric errors can effectively mask intrinsic variability present in the data making subsequent period solutions highly suspect. As a result, as Lafler & Kinman stressed in their original paper, the L-K algorithm may have difficulty in obtaining reliable periods for variables with relatively small amplitudes ( 0.75 mag) when the data set has a limited number of observations and moderate photometric accuracy. Because the majority of RR Lyrae variables have amplitudes that fall below this threshold, it is important to be cautious in interpreting periods and amplitudes derived from the L-K method especially when the photometric errors are significant.
We have analyzed both the HST WFPC2 and the -band photometric datasets (Saha et al. 1990) using our own light curve template-fitting software dubbed ‘FITLC’ (Layden 1998; Mancone & Sarajedini 2008). It uses an algorithm known as ‘Pikaia’ (Charbonneau 1995), which is a robust optimization routine that computes the best combination of period and amplitude in order to minimize the values between the observed data points and 10 different light curve templates taken from the work of Layden (1998).
The advantages of using template fitting for the determination of RR Lyrae periods are twofold. First, based on extensive tests we have performed, the template-fitting routine generally works better for small numbers (N 30) of observations than the L-K method. The power of the template-fitting method for the determination of light curve properties from relatively small numbers of points is well presented in the literature (Mackey & Gilmore 2003; Sarajedini et al 2006; Mancone & Sarajedini 2008).
Secondly, the template fitting method provides an assessment of the variable star classification based on the shape of the phased light curve. Whether the RRL is an ab-type or c-type naturally follows from the results of the method based on which template provides the best fit to the observational data.
3.1 Reanalysis of the Saha et al. Data
Given the advantages of template light curve fitting over the L-K algorithm for cases where the number of observations is small, we have reanalyzed the -band photometry of 32 RR Lyrae candidates in NGC 147 from S90 using the FITLC routine. Figures 3 through 11 show the best fitting light curves for the RR Lyrae candidates from FITLC as compared with the results from S90. The actual periods determined by the two methods are compared in Fig. 12 and listed in Table 3, which also shows the classification of each variable star and the mean magnitude. Overall, the resulting periods from the L-K and FITLC methods applied to the S90 -band data bear little resemblance to each other. We found only 6 cases (C1-V9, C1-V10, C1-V11,C3-V8, C3-V12, and C4-V9) out of 32 RR Lyraes where L-K and FITLC agree reasonably well in both period and classification. However, we found that L-K periods tend to be longer than FITLC periods, especially in the short period (P 0.6 days) and lower amplitude ranges (Amplitude 0.75).
In order to further investigate the differences we see between the L-K method and FITLC, we have performed the following set of simulations. We generated eighth-order Fourier decompositions of the template light curves of Layden (1998), 6 ab-types and 2 c-types, and calculated their Fourier parameters. With the functional forms of these 8 light curves, we created synthetic RR Lyrae light curves with known periods and amplitudes that mimic the -band observations of S90. We sampled each light curve at 23 different epochs (the maximum number in the S90 analysis) with measurement errors given by the mean value taken from the actual -band data. Periods and amplitudes were randomly assigned to each synthetic RR Lyrae from reasonable period-amplitude ranges for typical RR Lyrae variables ( 0.2 P 1.2 days, 0.2 Amp 1.5 mag). In this way, the artificial RR Lyrae variables properly represent important observational conditions that can affect the period determination such as the time baseline, the number of observations, and the photometric errors. We then applied the L-K and FITLC methods to the synthetic light curves in exactly the same manner as our original period finding routines and compared the derived periods with the input ones.
Figures 13 (L-K method) and 14 (FITLC) illustrate the results of our simulations for the -band observations of S90. They show that FITLC works better than the L-K method in finding periods using the S90 photometry; however some systematic errors still remain in the FITLC results. The FITLC routine recovered 59% of the input periods from the synthetic RR Lyraes with a period error of 0.1 days, while the L-K method only recovered 15% of the input periods with the same period error. Indeed, even though the -band photometry of NGC147 from S90 covered a significant observational baseline (4 to 5 days) and provided a reasonable number of observations (23 epochs), the period finding results are largely unreliable because of the relatively large errors in the photometry. If we reduce the errors by a factor of 2, then the recovery efficiency of the input periods from the FITLC routine is enhanced up to 72% but remains unchanged for the L-K method. We should note that the average photometric error of the -band photometry at the level of the HB is 0.2 mag. Even if we reduce the magnitude error by a factor of 2, most of the photometric data still exhibit errors of 0.1 mag, which is still too large to facilitate accurate period determination. Thus, the properties of the RR Lyrae candidates derived from the -band photometry must be interpreted with extreme caution.
3.2 Analysis of HST/WFPC2 Archival Data
As shown in section 2.2, the HST WFPC2 data of NGC 147 are deep enough to provide accurate V magnitudes for RR Lyrae candidates. The average photometric error in the V band at the HB magnitude level (V25.5) is 0.05 mag. Therefore, unlike the -band photometry of S90, period determination from the WFPC2 data should not be adversely affected by the photometric errors. However, the WFPC2 archival data for NGC 147 have a short observational baseline (0.4 days) with a small number of available epochs. The c-type RR Lyraes, which have periods of 0.2 - 0.4 days with relatively small amplitudes ( 0.3 mag ), might be less affected by this short observational baseline.
Given these limitations of the data, we proceeded with caution in defining our set of candidate RR Lyraes. First, we selected stars with a color-magnitude range (, and ), shown as a rectangular box in Figure 1. Then, we calculated the reduced of the observed V and I magnitudes of each star as a variability index defined by the following formula
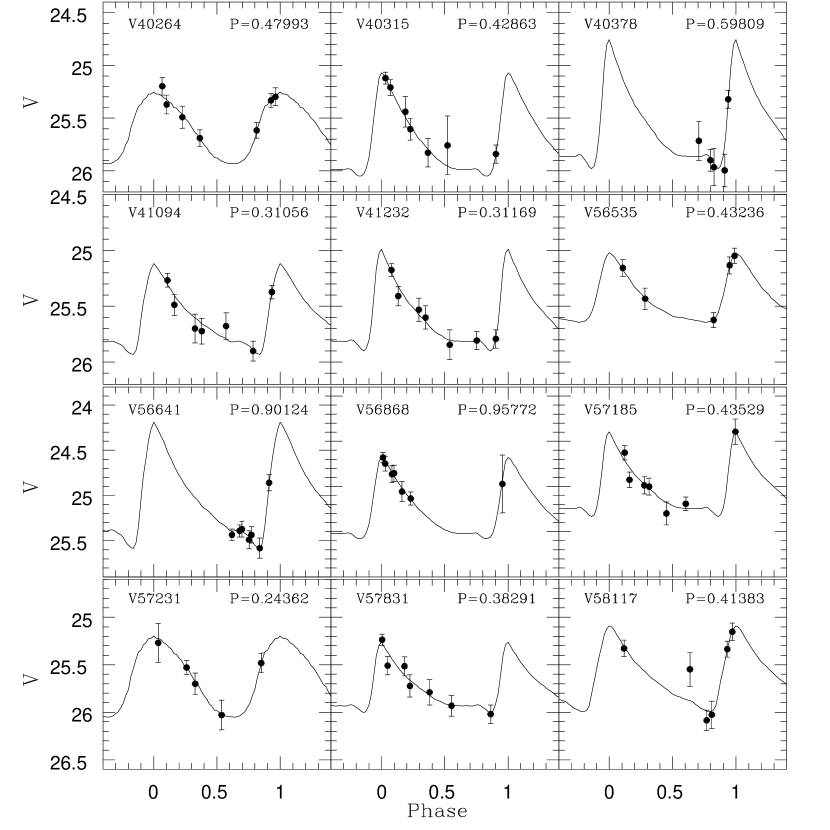
This diagnostic is distinct from the variability index of Welch & Stetson (1993) because the latter uses correlations in variability between different filter passbands. Stars with values greater than 2.0 were considered as variable candidates. Based on this criterion, 931 stars were selected. We applied the FITLC template light curve fitting routine to the - and -band observations of these variable candidates in order to find the best combination of period and amplitude. Of these, 36 RR Lyraes (32 ab-type and 4 c-type) have colors and magnitudes that place them along the HB where we would expect RR Lyraes to be located. Figure 15, 16, and 17 show the best fitting light curves for these RR Lyrae candidates and Fig. 18 illustrates their location in the NGC 147 CMD. Table 4 gives their positions as measured from the world coordinate system information in the image headers as well as their individual mean magnitudes and colors. The mean V magnitude of all of the RR Lyrae candidates is . Given the mean metallicity derived by Nowotny et al. (2003) and the RR Lyrae luminosity-metallicity relation from Chaboyer (1999), , we find a distance modulus of by applying a reddening of E(B–V) = 0.18 from Schlegel et al (1998). This value is in reasonable agreement with the distance quoted in Table 1 from Sharina et al. (2006) and the value of from Han et al. (1997); our distance places NGC 147 approximately 100 kpc in front of M31.
In order to assess the effects of the observing window on the FITLC periods derived from the WFPC2 photometry, we carried out synthetic light curve simulations as we did on the ground-based data of Saha et al. (1990). Hundreds of artificial RR Lyraes were created using template light curves with known periods and amplitudes. The number of epochs, magnitudes and photometric errors were carefully assigned to mimic the WFPC2 data. Then, we applied the FITLC algorithm to this simulated dataset. The simulation results are presented in Figure 19. They show that the WFPC2 time-series data of NGC 147 are better suited for the investigation of RR Lyrae periods than the ground-based -band photometry from Saha et al. (1990). However, that being said, for the entire range of test periods (0.2 d P 1.2 d), only 39 % of the output periods are in agreement with the input periods of the artificial RR Lyraes within 0.1 days. The situation is markedly improved for the short period variables (P 0.40 d), which tend to be the c-type RR Lyraes. They exhibit overall better period recovery ( 84 %) within the given period errors.
Generally speaking however, our investigation of both the band ground-based photometry and the VI HST/WFPC2 archival data leads us to the conclusion that our current knowledge of the periods and amplitudes of RR Lyrae stars in NGC 147 is highly uncertain. We need better observational data with high accuracy photometry, sufficient coverage of the observational baseline, and many available epochs, in order to fully understand the characteristics of the RR Lyrae population of NGC 147.
4 Summary and Conclusions
In this study, we present an investigation of the RR Lyrae population in the local group dwarf galaxy, NGC 147 using available time-series photometry from both the ground and HST. Based on our period finding analysis and artificial variable star tests, we draw the following conclusions:
1. The -band photometry from the work of Saha et al. (1990) likely possesses an adequate observational baseline and available epochs. However, our simulations showed that the photometric errors at the level of the horizontal branch significantly hinder the accurate determination of the pulsation periods of the RR Lyrae candidates in NGC 147.
2. Our template light curve fitting technique (FITLC) detected 36 probable RR Lyrae candidates from HST/WFPC2 archival data. However, our simulations reveal that the short observational baseline and small number of observations severely affect the accurate characterization of RR Lyrae periods longer than 0.4 days, which are essentially the ab-type RR Lyraes.
3. The -band photometry and the WFPC2 archival data analyzed herein present two extreme cases often found in period finding studies - good phase coverage but with large photometric errors, and high quality photometry with poor phase coverage. Our investigation of these two extreme cases not only provides a good reference for interpreting the pulsation properties of RR Lyrae variables in other similar situations, but also calls attention to a strong need for new high quality time-series observations of NGC 147. Thus, while we can confidently assert that NGC 147 contains RR Lyrae variables, and therefore a population older than 10 Gyr, it is not possible at this time to use the pulsation properties of these RR Lyraes to study other aspects of this old population.
References
- Bender et al (1991) Bender, R., Paquet, A., & Nieto, J.-L. 1991, A&A, 246, 349
- (2) Bono, G., Caputo, F., Castellani, V., Marconi, M., Storm, J. & Degl’Innocenti, S. 2003, MNRAS, 344, 1097
- (3) Bono, G., Caputo, F., Di Criscienzo, M. 2007, A&A, 476, 779
- Brown et al. (1978) Brown, T. M. et al. 2004, AJ, 127, 2738
- Chaboyer (1999) Chaboyer, B. 1999, ASSL, 237,111
- (6) Kunder, A. & Chaboyer, B. 2009, AJ, 138, 1284
- Charbonneau, P. (1995) Charbonneau, P. 1995, ApJS, 101, 309
- Clement, C. M. (2000) Clement, C. M. 2000 in IAU Colloq. 176, 266
- Da Costa & Mould (1988) Da Costa, G. S., & Mould, J. R. 1998, ApJ, 334, 159
- Dolphin (2000) Dolphin, A. E. 2000, PASP, 112, 1383
- (11) Fraternali, F. Tolstoy, E., Irwin, M. J., & Cole, A. A. 2009, A&A, 499, 121
- Grebel (1999) Grebel, E. K. 1999, in IAU Symp. 192, 17
- Han et al (1997) Han et al. 1997, AJ, 113, 1001
- Hodge (1989) Hodge, P. 1989, ARAA, 27, 139
- Lafler & Kinman (1965) Lafler, J., & Kinman, T. D. 1965, ApJS, 11, 216
- Layden (1998) Layden, A. 1998, AJ, 115, 193
- Layden & Sarajedini (2000) Layden, A., & Sarajedini, A. 2000, 119, 1760
- Mackey & Gilmore (2003) Mackey, A. D., & Gilmore, G. F. 2003, MNRAS, 343, 747
- Mancone & Sarajedini (2008) Mancone, C., & Sarajedini, A. 2008, AJ, 136, 1913
- Nowotny et al (2003) Nowotny, W.,Kerschbaum, F.,Olofsson, H., & Schwarz, H. E. 2003, A&A,403,93
- Saha et al (1990) Saha, A., Hoessel, J. G., & Mossman, A. E. 1990, AJ, 100, 108
- Sarajedini et al (2006) Sarajedini, A., Barker, M. K., Geisler, D., Harding, P., & Schommer, R. 2006, AJ, 132, 1361
- Schlegel et al (1998) Schlegel, D. J., Finkbeiner, D. P., & Davis, M. 1998, ApJ, 500, 525
- Sharina et al (2006) Sharina, M. E., Afanasiev, V. L., & Puzia, T. H. 2006, MNRAS, 372, 1259
- (25) Smith, H. A. 1995, RR Lyrae Stars, Cambridge Astrophysics Series, ICambridge University Press; Cambridge)
- Thuan & Gunn (1976) Thuan, T. X., & Gunn, J. E. 1976, PASP, 88, 543
- van den Bergh (1998) van den Bergh 1998, ApJ, 116, 1688
- (28) Welch, D. & Stetson, P. B. 1993, AJ, 105, 1813
- Young & Lo (1997) Young, L. M., & Lo, K. Y. 1998, ApJ, 476, 127
| Property | Value | Reference |
|---|---|---|
| RA | 00h 33m 11.9s | |
| Dec | +48∘ 30′ 24.8 | |
| (, ) | 119.82∘, -14.25∘ | |
| Vr | -1933 | Bender et al 1991 |
| (m-M)0 | 23.95 | Sharina et al 2006 |
| MV,0 | -15.1 | ” |
| E(B-V) | 0.180.03 | Schlegel et al 1998 |
| AV | 0.580 | ” |
| -1.110.01 | Nowotny el al 2003 | |
| -2.20.42 | Da Costa & Mould 1988 |
| Dataset | Filter | Exp time | 2 450 000 – HJD |
|---|---|---|---|
| u2ob0101t | F555W | 2400s | 9890.01465 |
| u2ob0102t | F555W | 1300s | 9890.06934 |
| u2ob0103t | F555W | 1300s | 9890.08594 |
| u2ob0104t | F555W | 1300s | 9890.13672 |
| u2ob0105t | F555W | 1300s | 9890.15332 |
| u2ob0106t | F555W | 2800s | 9890.21289 |
| u2ob0107t | F555W | 2800s | 9890.27930 |
| u2ob0108t | F814W | 1300s | 9890.33789 |
| u2ob0109t | F814W | 1300s | 9890.35449 |
| u2ob010at | F814W | 1300s | 9890.40527 |
| u2ob010bt | F814W | 1300s | 9890.42188 |
| u2ob010ct | F814W | 1300s | 9890.47168 |
| u2ob010dt | F814W | 1300s | 9890.48828 |
| Object | P(LK) | (LK) | Type(LK)11ab = ab-type RR Lyrae, c = c-type RR Lyrae, EB = eclipsing binary, AC = anomalous cepheid | P(FITLC) | (FITLC) | Type(FITLC)11ab = ab-type RR Lyrae, c = c-type RR Lyrae, EB = eclipsing binary, AC = anomalous cepheid |
|---|---|---|---|---|---|---|
| C1-V1 | 0.58543 | 24.65 | ab | 0.21990 | 24.60 | EB |
| C1-V2 | 0.49480 | 24.71 | ab | 0.98318 | 24.69 | EB |
| C1-V3 | 0.42978 | 25.05 | ab | 0.28723 | 24.95 | EB |
| C1-V4 | 0.72259 | 25.06 | ab | 0.30274 | 24.86 | c |
| C1-V5 | 0.38861 | 24.62 | c? | 0.37888 | 25.20 | ab |
| C1-V6 | 0.28260 | 24.46 | c? | 0.64538 | 24.20 | c |
| C1-V7 | 0.34835 | 24.55 | c? | 0.41998 | 24.58 | c |
| C1-V8 | 0.81660 | 24.95 | ab | 0.84910 | 24.88 | c |
| C1-V9 | 0.53655 | 25.04 | ab | 0.53753 | 25.08 | ab |
| C1-V10 | 0.86053 | 24.68 | ab | 0.85044 | 24.86 | ab |
| C1-V11 | 0.43104 | 24.80 | ab | 0.43352 | 24.79 | ab |
| C1-V12 | 0.27895 | 24.81 | c | 0.55790 | 24.91 | EB |
| C1-V13 | 0.71724 | 24.99 | ab | 0.41037 | 24.95 | ab |
| C1-V14 | 0.27355 | 25.11 | c | 0.21888 | 25.04 | EB |
| C3-V1 | 0.52933 | 25.44 | ab | 0.51879 | 25.21 | c |
| C3-V2 | 0.86729 | 25.25 | ab | 0.85738 | 25.18 | c |
| C3-V3 | 0.74508 | 24.54 | ab | 0.68766 | 24.56 | ab |
| C3-V4 | 0.60875 | 24.77 | ? | 0.30546 | 24.80 | c |
| C3-V5 | 0.54649 | 25.18 | ab | 0.36870 | 25.37 | ab |
| C3-V6 | 1.22297 | 24.84 | AC | 0.76788 | 24.88 | ab |
| C3-V7 | 1.23533 | 24.53 | AC | 0.55284 | 24.57 | ab |
| C3-V8 | 0.54194 | 24.54 | ab | 0.53806 | 24.53 | ab |
| C3-V9 | 0.69967 | 25.01 | ab | 0.34991 | 24.88 | c |
| C3-V10 | 0.67132 | 25.17 | ab | 0.33587 | 25.36 | ab |
| C3-V11 | 0.57346 | 24.69 | ab | 0.45515 | 24.70 | ab |
| C3-V12 | 0.71666 | 25.00 | ab | 0.75819 | 24.96 | ab |
| C3-V13 | 0.75816 | 24.70 | EB? | 0.70529 | 24.65 | c |
| C4-V1 | 0.77865 | 24.76 | ab | 0.57333 | 24.68 | ab |
| C4-V2 | 0.75304 | 25.58 | ab | 0.59890 | 25.38 | c |
| C4-V3 | 0.76366 | 25.38 | ab | 0.40267 | 25.59 | ab |
| C4-V4 | 0.46348 | 24.96 | ab | 0.82539 | 25.02 | c |
| C4-V5 | 0.77979 | 25.28 | ab | 0.60954 | 25.02 | c |
| C4-V6 | 0.64373 | 25.21 | ab | 0.67994 | 25.30 | c |
| C4-V7 | 0.57137 | 25.43 | ab | 0.34560 | 25.52 | ab |
| C4-V8 | 0.29731 | 25.22 | c | 0.36375 | 25.08 | EB |
| C4-V9 | 0.60459 | 25.35 | ab | 0.55696 | 25.31 | ab |
| Object | RA(J2000.0) | Dec(J2000.0) | ||
|---|---|---|---|---|
| V18120 | 0 33 13.41 | 48 28 50.22 | 25.137 | 0.537 |
| V15719 | 0 33 11.18 | 48 28 06.05 | 25.072 | 0.753 |
| V16803 | 0 33 12.61 | 48 27 51.49 | 25.079 | 0.740 |
| V17600 | 0 33 13.28 | 48 28 23.10 | 25.224 | 0.529 |
| V18304 | 0 33 09.60 | 48 28 10.86 | 25.169 | 0.331 |
| V20325 | 0 33 09.83 | 48 28 11.68 | 25.293 | 0.278 |
| V20731 | 0 33 09.20 | 48 28 21.55 | 25.459 | 0.435 |
| V20834 | 0 33 11.69 | 48 28 50.55 | 25.309 | 0.588 |
| V22046 | 0 33 14.32 | 48 28 27.68 | 25.389 | 0.447 |
| V22251 | 0 33 13.13 | 48 27 45.58 | 25.431 | 0.204 |
| V22308 | 0 33 13.43 | 48 27 44.47 | 25.484 | 0.099 |
| V22660 | 0 33 13.26 | 48 28 37.32 | 25.392 | 0.155 |
| V23104 | 0 33 11.66 | 48 28 47.19 | 25.632 | 0.682 |
| V23505 | 0 33 14.28 | 48 28 22.03 | 25.588 | 0.519 |
| V24080 | 0 33 12.82 | 48 28 56.96 | 25.657 | 0.219 |
| V37537 | 0 33 14.89 | 48 27 32.23 | 25.161 | 0.636 |
| V38170 | 0 33 16.90 | 48 27 08.75 | 25.234 | 0.684 |
| V38302 | 0 33 19.96 | 48 27 53.65 | 25.300 | 0.727 |
| V38757 | 0 33 22.22 | 48 27 43.15 | 25.317 | 0.170 |
| V38944 | 0 33 15.98 | 48 27 20.24 | 25.303 | 0.538 |
| V39451 | 0 33 23.75 | 48 27 40.43 | 25.338 | 0.508 |
| V39591 | 0 33 17.03 | 48 28 01.65 | 25.368 | 0.596 |
| V39668 | 0 33 19.29 | 48 27 46.54 | 25.440 | 0.792 |
| V39906 | 0 33 21.73 | 48 27 35.56 | 25.435 | 0.420 |
| V40264 | 0 33 20.47 | 48 27 52.46 | 25.471 | 0.600 |
| V40315 | 0 33 20.74 | 48 27 36.23 | 25.510 | 0.596 |
| V40378 | 0 33 18.59 | 48 27 36.31 | 25.513 | 0.418 |
| V41094 | 0 33 18.34 | 48 27 10.21 | 25.568 | 0.412 |
| V41232 | 0 33 18.79 | 48 27 21.51 | 25.600 | 0.434 |
| V56535 | 0 33 14.15 | 48 26 39.45 | 25.395 | 0.516 |
| V56641 | 0 33 11.18 | 48 26 17.77 | 25.406 | 0.409 |
| V56868 | 0 33 14.99 | 48 25 42.19 | 25.399 | 0.329 |
| V57185 | 0 33 13.88 | 48 26 36.28 | 25.519 | 0.714 |
| V57231 | 0 33 14.95 | 48 25 51.15 | 25.498 | 0.650 |
| V57831 | 0 33 16.45 | 48 25 56.11 | 25.684 | 0.721 |
| V58117 | 0 33 14.23 | 48 26 14.76 | 25.639 | 0.310 |