The long rapid decay phase of the extended emission from the short GRB 080503.
Abstract
The gamma-ray burst (GRB) 080503 was classified as a short GRB with extended emission (Perley et al. 2009). The origin of such extended emission (found in about a quarter of Swift short GRBs) is still unclear and may provide some clues to the identity of the elusive progenitors of short GRBs. The extended emission from GRB 080503 is followed by a rapid decay phase (RDP) that is detected over an unusually large dynamical range (one decade in time and decades in flux), making it ideal for studying the nature of the extended emission from short GRBs. We model the broad envelope of extended emission and the subsequent RDP using a physical model for the prompt GRB emission and its high latitude emission tail (Genet & Granot 2009), in which the prompt emission (and its tail) is the sum of its individual pulses (and their tails). For GRB 080503, a single pulse fit is found to be unacceptable, even when ignoring short timescale variability. The RDP displays very strong spectral evolution and shows some evidence for the presence of two spectral components with different temporal behaviour, likely arising from distinct physical regions. A two pulse fit (a first pulse accounting for the gamma-ray extended emission and decay phase, and the second pulse accounting mostly for the X-ray decay phase) provides a much better (though not perfect) fit to the data. The shallow gamma-ray and steep hard X-ray decays are hard to account for simultaneously, and require the second pulse to deviate from the simplest version of the model we use. Therefore, while high latitude emission is a viable explanation for the RDP in GRB 080503, it does not pass our tests with flying colors, and it is quite plausible that another mechanism is at work here. Finally, we note that the properties of the RDP following the extended emission of short GRBs (keeping in mind the very small number of well studied cases so far) appear to have different properties than that following the prompt emission of long GRBs. However, a larger sample of short GRBs with extended emission is required before any strong conclusion can be drawn.
keywords:
Gamma-rays: bursts – radiation mechanisms: non-thermal.1 Introduction
GRB080503 was detected by the Swift Burst Alert Telescope (BAT) on 2008 may 3 (Perley et al., 2009). Its prompt gamma-ray emission presents a short (s) intense initial spike followed by an extended emission lasting several minutes, for a total duration of s. The first short spike duration in the keV band is s and its peak flux is erg cms-1. The count rate hardness ratio between the keV and the keV of the initial spike is , consistent with other short Swift bursts, but also with some long bursts. The fluence of the extended emission (measured between s and s) in the keV band is erg cm-2, about thirty times that of the initial spike, higher than for any other short Swift bursts, but within the range of such ratio measured for BATSE short bursts. Perley et al. (2009) found a spectral lag between the keV and the keV bands consistent with zero. All this led them to associate GRB080503 with the “short” (Kouveliotou et al., 1993) class.
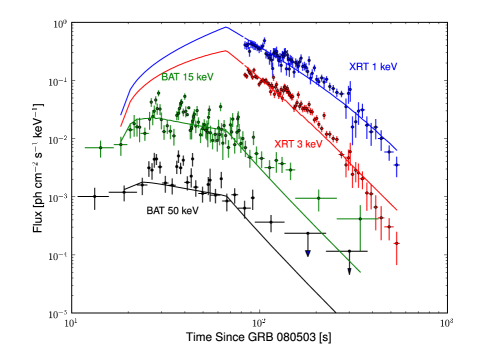
The Swift X-Ray Telescope (XRT) started observing GRB080503 about s after the burst, detecting a bright early afterglow that rapidly decayed ( with ) to below the detection threshold during the first orbit, which makes a record overall decline of decades, with a steep decay clearly observed for decades (see figure 6 of Perley et al. 2009). Chandra detections at days after the GRB indicate the presence of a separate X-ray afterglow component times fainter than the peak emission from the X-ray tail of the prompt extended emission. The gamma-ray lightcurve of the extended emission (which can be found with the X-ray light-curve of the extended emission in figure 1) presents two relatively well defined spikes at s and s, followed by some less defined variability with several narrow spikes (see also figure 1 of Perley et al. 2009). The X-ray RDP lightcurves present a first break at s seen in both soft and hard bands; later on, the hard X-ray band clearly shows a steepening (to a temporal slope of about ) that is only marginally seen in the soft X-rays. The simultaneous gamma-ray decay is much shallower, with a temporal slope only about .
The rapid decay phase (RDP) of GRB080503 is a smooth temporal and spectral continuation of the extended emission in the gamma-rays (Perley et al., 2009). This suggests that it is the tail of the prompt emission (O’Brien et al., 2006; Butler & Kocevski, 2007). The most popular model to explain the RDP following the prompt emission of long GRBs is High Latitude Emission (HLE; Kumar and Panaitescu 2000). In this model, after the prompt emission stops, photons from increasingly larger angles relative to the line of sight still reach the observer, due to the curvature of the (assumed to be quasi-spherical) emitting surface. The blueshift of such photons decreases with the angle from the line of sight, and therefore with their arrival time. This results in a simple relation between the temporal and spectral indexes of the flux, , where , that holds at late times (when , where is the onset time of the pulse and its width) for each pulse of the prompt emission.
The RDP following the extended emission of the short GRB 080503, however, shows strong spectral evolution that is different than that typically seen in the RDP following the prompt emission of long GRBs. Whereas in the latter case the RDP usually shows a monotonic softening of the spectrum with time (see Zhang, Liang & Zhang 2007 and references therein), the RDP in GRB 080503 shows a similar softening in the XRT energy range together with a hardening in the spectral slope between the XRT and BAT energy ranges. This behavior suggests the presence of two distinct spectral components.
Such extended emission is observed in about a quarter of Swift short bursts (Norris and Gehrels 2009; Norris et al. 2009). It usually lasts tens of seconds, and has been shown to be always softer than the initial short spike, however showing negligible lags as the initial spike (Norris and Bonnel, 2006). The same authors also found that the extended emission is softer than the initial spike, making it closer to long bursts, which are softer than short bursts. However, the initial spike of short burst with and without EE show similar properties (Norris and Gehrels, 2009). Many authors recently turned to environmental constraints to explain differences between short GRBs with and without EE, but with results at best uncertain, sometime contradictory (Rhoads 2008; Troja et al. 2008; Fong, Berger & Fox 2009; Sakamoto & Gehrels 2009; Nysewander, Fruchter & Pe’er 2009). There is as of now no strong explanation for the mechanism behind extended emission. It is therefore very important to test whether HLE can indeed explain the RDP of GRB080503, as this would allow some comparison with results for the RDP following the prompt emission without extended emission (Willingale et al., 2009). This will stress similarities and differences between the extended emission and the prompt emission itself, ultimately leading to a better understanding of the origin of extended emission.
Genet & Granot (2009; hereafter GG09) have developed a simple yet physical and self-consistent model for the prompt and high latitude emission. The very large dynamical range over which the RDP of GRB080503 is observed allows us to test its behaviour at late times, which is rarely possible in other Swift bursts. In order to test whether the extended emission is coming from a mechanism similar to the prompt emission itself, we apply the GG09 model to GRB080503 data by folding it through the response matrices generated from the four energy bands of data (0.3-1.3 keV and 1.3-10.0 keV for the XRT, 15-50 keV and 50-150 keV for the BAT). Section § 2 summarizes the theoretical model used to fit the burst lightcurves. Section § 3 describes how the data are reduced and fitted and the results of our fits, and in section § 4 we discuss the implications of these results.
2 The theoretical model
The prompt and extended emissions and their tail (the RDP) are taken to be the sum of its pulses and their tails, as described in GG09. Each pulse represents a single emission episode, assumed to come from an ultra-relativistic () thin spherical expanding shell, turns on at radius and turns abruptly off at radius where is the width of the emission region. The emission is assumed to be uniform over the emitting shell and isotropic in its rest frame. The observed flux is calculated by integrating over the surface of equal arrival time of photons to the observer (following Granot 2005 and Granot et al. 2008). The characteristic observed times of a pulse are the ejection time of the emitting shell (), the radial time at () and at (); is also essentially the temporal width of the pulse. For a few, the peak of the pulse is observed at . We consider that the peak luminosity of the shell evolves as . In the case of emission by synchrotron mechanism from electrons accelerated in internal shocks and cooling fast, , but in the following it will be kept free as fixing its value does not simplify calculations and it allows to check for deviations from these assumptions. In this framework we also have the peak frequency of the spectrum evolving as . The emission spectrum is assumed to be the phenomenological Band function (Band et al., 1993). The number of photons per unit photon energy , area and observed normalized time of a single emission episode is then (where we also define ):
where is kept free to vary as fixing its value does not simplify calculations and
is the Band function with a normalization constant , with high and low energy photon indexes of and respectively, where and . One can remark that the observed spectrum is a Band function spectrum, as the emitted one, but with its peak energy sweeping through the observed bands: the peak of is (where ), which decreases linearly with the normalized time . At times is observed the high latitude emission of the shell. In this part of the lightcurve of the pulse, the spectral slope will evolve from (where is the observed photon energy) to if . This creates a break in the lightcurve, which becomes very smooth if the observations are done in an energy band of finite width.
3 Data Reduction and Fitting
We download the raw, unfiltered Swift BAT and XRT data for GRB 080503 from the Swift Archive111ftp://legacy.gsfc.nasa.gov/swift/data. Our reduction of these data to science quality light curves and spectra are detailed in Perley et al. (2009). Here, we subdivide the X-ray and -ray light curves into much finer time bins to study the spectral evolution. We begin with the BAT 15-350 keV and XRT 0.3-10.0 keV lightcurves, with each bin containing sufficient counts to reach a signal-to-noise ratio () of 3 or greater. We then generate response matrices for each time bin, using the tools summarized in Perley et al. (2009). Our reduction accounts for the spacecraft slew for BAT as well as photon pileup for the XRT, among other effects.
Next, we further subdivide the BAT and XRT data each into soft and hard energy channels: 15-50 keV and 50-150 keV for BAT, 0.3-1.3 keV and 1.3-10.0 keV for the XRT. We rebin the data (and group the response matrices accordingly) so that each hard and soft channel still has . The soft and hard channel light curves are shown in Figure 1. To fit the temporal/spectral model of GG09 to the 2-energy-channel BAT and XRT data as a function of time, we fold the model through the response matrices at each time bin and minimize the total . Fitting is accomplished using Markov Chain Monte Carlo (MCMC) through the python PyMC package222http://code.google.com/p/pymc.
| one component model | |
|---|---|
| parameter | value |
| [s] | |
| [s] | |
| [cm-2] | |
| (BAT and XRT) | |
| two component model | ||
|---|---|---|
| parameter | pulse | pulse |
| (fixed) | ||
| [s] | ||
| [s] | ||
| [cm-2] | ||
| -1.63 0.10 | ||
At the beginning of the RDP the flux is expected to be dominated by the last pulse. However, at later times other pulses are expected to become dominant, and the contribution of each pulse to the flux at late times () scales as when is constant among the pulses: higher (with a larger ) or wider (with a larger ) pulses will dominate. The width of the pulse having a larger power ( for ) in the relative contribution to the flux, it will be the most important parameter to find the dominant pulse. This is not true if the high energy spectral slope is varying among pulses, but we assume that such variations are small enough so that the contribution at late times of narrow pulses are still small compared to larger ones. Given the shape of the BAT lightcurve of GRB080503, it thus seems most natural to explain it by one or two broad pulse(s) superimposed by narrower ones that would account for the smaller timescale variability observed (such as the spikes at s and s), but whose contribution to the RDP would be negligible: the ratio of their width being of the order of , the ratio of their contribution to the tail of the prompt emission would be about or less. The results presented here will describe only the broad(s) pulse(s) fitting and results, as in it lay the most important physics.
3.1 Single Pulse Model
We begin by fitting a single pulse BAT emission model to study the expected late-time emission in the XRT bands. Initial temporal parameters (rise time and peak time ) are chosen to crudely reproduce an envelope of emission containing the BAT light curve. We then allow these and the other model parameters to vary (Table 1).
We find that a single pulse model tends to yield a mediocre fit to the data. The fit requires a systematic error term (in addition to the measured error) of 30% in order to yield . This error is not driven by the BAT time-variability alone (although this contributes). There is clear difficulty in fitting the smooth light curve break in the X-ray bands and also potentially in fitting the high flux in the BAT after s. However, we note that the error bars on the late-time BAT flux are large. The limits plotted in Figure 1 (top) for the BAT hard channel are at the level.
3.2 Double Pulse Model
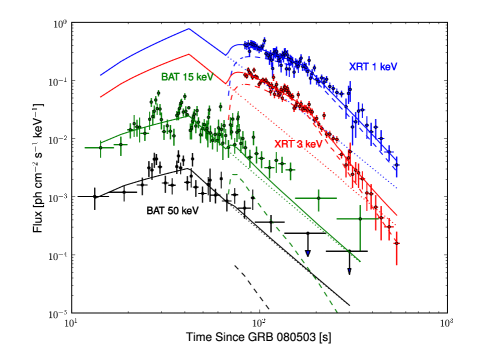
Because the single pulse model has difficulty reconstructing the slow BAT decline as well as the rapid X-ray break, we attempt fitting a model with two pulses. As displayed in Figure 1 (bottom), the data are considerably better fit with two pulses, the parameters for which are given in Table 2. In the fitting, we tie several of the parameters from pulse B to those from pulse A. We also fix the low energy Band model index , which is typical for GRBs. A large value for that index from the single pulse model may further suggest the inapropriateness of that model.
The data are fit by a soft early pulse (peaking at s with keV) and a softer later pulse (peaking at s with keV). The BAT emission is dominated by the early pulse, whereas the late pulse provides the temporal break observed in the XRT bands around s, which in this case is the beginning of the high latitude decay of the second pulse.
We have attempted fits of 3 or more pulses to the data as well. These do not appear to significantly improve the fit, which even for the two pulse model requires a 20% systematic uncertainty. Apart from the possible slow BAT decay at s, this extra uncertainty appears to be needed to account for light curve variability, which is not treated in the model.
4 Discussion
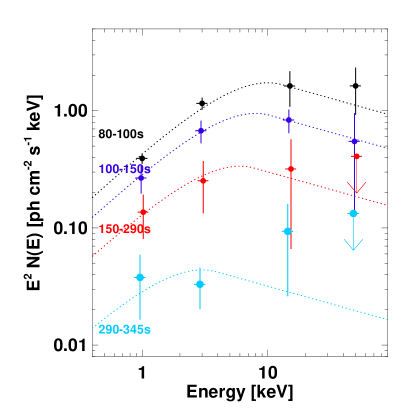
The main problem in fitting the data with a single pulse is the very steep decay of the hard X-ray band combined with the relatively shallow decay of the BAT bands. In order to find a reason for such a behaviour, we extracted spectra at different time intervals (s, s, s and s) along the RDP lightcurve (when data in the four BAT and XRT bands are available) to probe the spectral evolution (see figure 2, where from earliest to latest spectra the colors are black, dark blue, red and cyan). Although the data are marginally consistent with a Band function with constant slopes and decreasing , there is evidence for a departure from a Band spectrum to a spectrum with a concave shape beginning at s. Such spectral evolution would strongly suggest that at times s a second component contributes to the flux; this would naturally explain the distinct X-ray and gamma-ray behaviours of the RDP, accounting for the rapid X-ray decline and slow gamma-ray decay.
The fit with two pulses gives much better results - as expected since two physical components seem to contribute to the flux. In this two pulse modelling, the first part of the emission (s) is accounted for by a first pulse, and the second part, including the whole RDP, by the second component. The X-ray break at s is the start of the high latitude decay of the second pulse, and the smooth break along the rest of the RDP is due to the sweeping up of the peak energy of the spectrum across the observed energy bands (as explained in § 2). Due to the reappearance at late time (s) of the first component above the second one, the steep decay in the hard X-ray band is still not very well accounted for. However, when looking at the 4-points spectra, one can see that the high and low energy slopes seem to change (on top of the appearance of a second component): from the earliest to the latest spectrum, the low energy slope seems to decrease with time (the low energy slope of the spectrum becomes shallower with time), and the high energy slope also seems to steepen. This may explain why the introduction of a second component alone (with fixed Band function parameters) cannot reproduce both the steep hard X-ray and the slow gamma-ray decline, even with a very steep high energy photon index (): evolution of the Band function slopes seem required.
The slow gamma-ray decay could alternatively be due to a series of spikes that are reasonably narrow (with ), unresolved (due to the wide late time BAT time bins) and hard (dominating at soft gamma-rays but with a small X-ray flux), so that we see only their smooth envelope, while their tail would hardly contribute to the observed X-ray decay. We do not directly model this, however, since it would introduce far too many new free parameter, and thus not provide a very stringent test for such a model.
| Equipartiton field | ||
|---|---|---|
| Advected field | ||
We had kept as a free parameter since it did not complicate the modeling and could test for deviations from its simplest form. Indeed, none of the values obtained for the fits are perfectly consistent with . Considering only the two pulse fit (the one pulse fit not being good enough to have any physical significance), the values of for the first and second pulses (pulse number indicated by a subscript number) are and . Since the value was obtained under the assumptions of electrons cooling fast by synchrotron emission in a coasting outflow, this means that at least one of the above assumptions is not true in the case of GRB080503. The most natural assumption to relax is that the strength of the shocks in the outflow is constant. Assuming that it varies with radius, namely parametrizing the relative uptstream to downstream four-velocity as (while the Lorentz factor of the emitting shocked region remains constant), then and where and . The dependence of and on are summarized in table 3, where we have considered two options for the magnetic field in the emitting region: (i) a field strongly amplified at the shock that holds a constant fraction of the internal energy (equipartition), and (ii) a pre-existing magnetic field advected from the central source (scaling as upstream) and merely compressed at the shock (advected field). The values of the parameters and corresponding to the value of the second pulse are given as well (since the value of for the first pulse is close to its fiducial value ). One can note that the value of inferred form the fit implies a value of , meaning that rises with radius at least linearly, which is very different from the basic model where . We stress, however, that the parameters and affect mainly the rising parts of the pulses and hardly affect the decaying parts. Since we do not have strong constraints on the time variation of the peak frequency during the rising parts of the pulses, parameter values similar to the ones we infer may be able to reasonably fit the data.
5 Conclusion
We have explored the extended emission and very long RDP of GRB080503 in the light of the realistic physically motivated model for the prompt and latitude emission from Genet and Granot (2009). Neglecting narrow pulses that do not affect the high latitude emission, we fitted the broad underlying envelope of the extended emission and its RDP, expecting a simple HLE behavior, motivated by the results of Perley et al. (2009). The first attempt, using a single pulse, failed to account for both the slow gamma-ray and very rapid hard X-ray declines. A close look at the spectral evolution during the RDP (at times s) showed evidence of a strong spectral evolution: the emergence of a second spectral component dominating the high energies is spotted, as well as evolution of the spectral slopes of the (assumed) Band function spectrum. This led us to fit the data with two pulses, the first one accounting for the gamma-ray envelope and decay phase, the second one accounting for the X-ray decay phase. The fit thus obtained is far better - even if not perfect, since we are still not accounting for the smaller variability. Adding a third pulse does not improve the fit, which suggests two pulses are enough to account for the data (as suggested by the spectral evolution). However, the fit we obtained is still far from perfect (the hard X-ray decay is still too steep at the latest times), the model being unable to account for the evolution of spectral slopes, and the fitting results showing discrepancies with its simplest form. This points out that the simplest form of GG09 model for HLE is not detailed enough to account for the complex RDP of GRB 080503. The mechanism at work here may thus still be HLE, but since this model has some difficulties and requires many degrees of freedom in order to produce a reasonable fit, this may suggest that another mechanism might be at the origin of the RDP in GRB 080503.
A previous attempt at fitting GG09 model to a short pulse with extended emission was done on GRB050724 by Willingale et al. (2009). They also could not obtain a good fit of the extended emission in both BAT and XRT band, the model not being able to account for a slow BAT decay and a steep XRT decay during the RDP - similarly to what is observed with GRB080503. Such feature may thus be a characteristic of RDP from extended emission, but more bursts should be studied before any conclusion can be drawn. Willingale et al. (2009) argue that HLE is a valid explanation for the RDP of GRBs without extended emission. If there is indeed a difference in the RDP of bursts with and without extended emission, then the properties of extended emission would be different from the prompt emission, which might suggest they have a different physical origin. GRB080503 may thus be the first stone paving the way to a better understanding of extended emissions in Gamma-ray bursts by studying their RDP. However, one should keep in mind that, on top of having been studied more carefully than other bursts, the RDP of GRB080503 is uncommonly long, meaning that maybe the range on which rapid decay is usually observed is not large enough to show deviations from the high latitude decay. In this case this should be taken as a caveat for drawing conclusions from model fitting to the rapid decay phase of GRBs.
Aknowledgement
NRB is supported through the GLAST Fellowship Program (NASA Cooperative Agreement: NNG06DO90A). J.G. gratefully acknowledges a Royal Society Wolfson Research Merit Award.
References
- Band et al. (1993) Band D., et al., 1993, ApJ , 281
- Butler & Kocevski (2007) Butler N.R. & Kocevski D., 2007, ApJ , 400
- Fong et al. (2009) Fong W., Berger E. & Fox D.B., 2009, ApJ submitted (arXiv/0909.1804)
- Genet and Granot (2009) Genet F. & Granot J., 2009, MNRAS , 1328
- Granot (2005) Granot J., 2005, ApJ , 1022
- Granot et al. (2008) Granot J., Cohen-Tanugi J. & do Couto e Silva E., 2008, ApJ , 92
- Kouveliotou et al. (1993) Kouveliotou C., Meegan C.A., Fishman G.J., Bhat N.P., Briggs M.S., Koshut T.M., Paciesas W.S. and Pendleton G.N., 1993, ApJ , L101
- Kumar and Panaitescu (2000) Kumar P. & Panaitescu A., 2000, ApJL , L51
- Norris et al. (2009) Norris J.P., Gehrels N. & Scargle J.D., 2009, ApJ submitted
- Norris and Bonnel (2006) Norris J.T. & Bonnell J.T., 2006, ApJ , 266
- Norris and Gehrels (2009) Norris J.P. & Gehrels N., 2008, GRBs 2007: Proceedings of the Santa Fe Conference, AIP , 280
- Nysewander et al. (2009) Nysewander M., Fruchter A.S. & Pe’er, A., 2009, ApJ, , 824
- O’Brien et al. (2006) O’Brien P.T., et al., 2006, ApJ , 1213
- Perley et al. (2009) Perley D.A., et al., 2009, ApJ , 1871
- Rhoads (2008) Rhoads J.E., 2008, ApJ submitted (arXiv/0807.2642)
- Sakamoto & Gehrels (2009) Sakamoto T. & Gehrels N. 2009, Gamma-Ray Bursts: Sixth Huntsville Symposium, AIP , 112
- Troja et al. (2008) Troja E., King A.R., O’Brien P.T., Lyons N., & Cusumono G., 2008, MNRAS, , L10
- Willingale et al. (2009) Willingale R., Genet F., Granot J & O’Brien P., MNRAS submitted
- Zhang et al. (2007) Zhang B.B, Liang E.W. & Zhang B., 2007, ApJ , 1002