On the Dynamical Evolution of the Arches Cluster
Abstract
We study the dynamical evolution of the young star cluster Arches and its dependence on the assumed initial stellar mass function (IMF). We perform many direct -body simulations with various initial conditions and two different choices of IMFs. One is a standard Kroupa IMF without any mass segregation. The other is a radially dependent IMF, as presently observed in the Arches. We find that it is unlikely for the Arches to have attained the observed degree of mass segregation at its current age starting from a standard non-segregated Kroupa IMF. We also study the possibility of a collisional runaway developing in the first of dynamical evolution. We find that the evolution of this cluster is dramatically different depending on the choice of IMF: if a primordially mass segregated IMF is chosen, a collisional runaway should always occur between for a broad range of initial concentrations. In contrast, for a standard Kroupa IMF no collisional runaway is predicted. We argue that if Arches was created with a mass segregated IMF similar to what is observed today then at the current cluster age a very unusual, high-mass star should be created. However, whether a collisional runaway leads to the formation of an intermediate-mass black hole (IMBH) depends strongly on the mass loss rate via winds from massive stars. Growth of stellar mass through collisions can be quenched by strong wind mass loss. In that case, the inter-cluster as well as intra-cluster medium are expected to have a significant Helium enrichment which may be observed via Helium recombination lines. The excess amount of gas lost in winds may also be observed via X-ray observations as diffused X-ray sources.
Subject headings:
methods: N-body simulations, methods: numerical, globular clusters: individual (Arches), stellar dynamics1. Introduction
One of the biggest uncertainties in star cluster evolution studies lies in determining the true initial stellar mass function (IMF). Traditionally all studies focusing on the dynamical evolution of star clusters assume an initially fully formed cluster with a given number of single and binary stars, all at zero age main sequence (ZAMS) at and no gas. It is also often assumed that the IMF is a standard power-law (or power-laws with different indices in different mass ranges) with no primordial radial variation in the cluster (e.g., Salpeter, 1959; Miller & Scalo, 1979; Kroupa, 2001). However, star formation simulations indicate that neither of the above simplifications may be valid. For example, star formation takes place over a time-period and the formation timescale depends on many different physical processes including the Jeans mass of the protostellar clouds, radiative feedback and turbulence (e.g., Tan et al., 2006). Moreover, depending on these detailed physical processes stars of different mass ranges may form over different timescales (e.g., Dib et al., 2007a; Krumholz et al., 2009). In addition, deviations from the standard MFs are observed in many clusters both at the high mass and the low mass ends (e.g., Elmegreen, 2004). In particular at the high mass end observed MFs are generally top-heavy compared to standard power-laws in dense cluster cores like the Arches cluster and starburst regions (Stolte et al., 2002; Kim et al., 2006; Dabringhausen et al., 2009). Mass segregation is also observed in old globular clusters (e.g., Subramaniam et al., 1993; Hillenbrand & Hartmann, 1998; Baumgardt et al., 2008). Whether the observed mass segregation is imprinted from the star formation epoch or it is attained via dynamical evolution of the cluster at a later time is still an open question. Although a conclusive general answer to this question does not exist, it has been shown in the case of the very young Trapezium cluster in the Orion nebula that the observed degree of mass segregation cannot be explained simply via dynamical mass segregation and a preferential formation of high-mass stars near the center is necessary to explain the observations (Bonnell & Davies, 1998).
In order to bypass the above mentioned assumptions a detailed model for the star formation processes during the formation of the cluster is needed. Interstellar clouds contract and fragment due to density perturbations to form pre-stellar cores (PSC) that collapse on timescales that depend on their Jeans masses to form stars (e.g., Nakano, 1966). Depending on the compactness of the assortment of these PSCs they can merge with other PSCs and grow before they collapse to form stars (e.g., Silk & Takahashi, 1979; Elmegreen & Shadmehri, 2003; Dib et al., 2007b). Using this simple model Dib et al. (2007a) have attempted to eliminate the above-mentioned assumptions regarding cluster IMFs by building an IMF from a distribution of PSCs in a molecular cloud. In their simplified model they assume that each PSC collapses to form a single star of mass proportional to the parent PSC. Comparing the collision timescale between the PSCs with the collapse timescale of the PSCs they show that near the central regions of a dense cluster the PSCs collide and grow in mass before they can collapse to form a star. Thus, near the core where the number density of the PSCs is significantly higher than that in the halo, it is more likely to form stars that are heavier than stars formed from PSCs in the halo. Using the Arches cluster as a particular example they show that their semi-analytical model naturally results in a mass segregated cluster similar to the Arches cluster and the observed top-heaviness near the center is thus explained as imprinted from the star formation epoch.
The effects of primordial mass segregation on the global dynamical evolution of clusters have been explored previously in a parametric way showing interesting differences in the global properties of those clusters and their dynamical evolution (e.g., Baumgardt et al., 2008; Gürkan et al., 2004). The observed top-heavy MF in the central regions of the Arches cluster (e.g., Kim et al., 2006, 2007) thus makes it an interesting candidate for such studies. If the observed radially dependent top-heaviness in Arches MF is indeed primordial, then this is a direct measurement of the degree of mass segregation at formation of this cluster, thus it eliminates the necessity for parameterization.
The Arches cluster is also unique for the following reasons. The cluster has a projected distance of from the Galactic center (Nagata et al., 1995; Portegies Zwart et al., 2002; Kim et al., 2006, 2007). Estimates from detailed proper motion observations with a baseline of indicate that the real Galactocentric distance of the Arches cluster is (Stolte et al., 2008). Thus the Arches is the closest massive cluster from the Galactic center. The proximity of the cluster from the Galactic center necessitates this cluster to be compact to be saved in the face of possible early tidal disruption. Serabyn et al. (1998) a decade ago found O stars within of the cluster, indicating Arches to be the densest young cluster in the Galaxy. The high estimated total cluster mass (), and the high luminosity thus make this young cluster a power house cluster for Galactic standards (e.g., Serabyn et al., 1998). The central stellar density of the Arches cluster is (e.g., Serabyn et al., 1998; Portegies Zwart et al., 2007), which is typical only for some old Galactic globular clusters. The core radius () of the Arches cluster is (e.g., Figer et al., 1999; Stolte et al., 2002; Stolte, 2006). The high central density and the high mass thus makes the Arches cluster a very good candidate to study for possibility of collisional runaway. The Arches cluster is also very young, the cluster age () is only (e.g., Stolte et al., 2008). The timescale for a successful collisional runaway is only since past that age, the cluster is depleted of its high-mass stars due to Supernova explosions (e.g., Freitag et al., 2006a, 2007). Hence, if conducive for a collisional runaway, the Arches cluster may be undergoing that process at the present time.
Two main scenarios to create the observed top-heavy radially dependent MF have been suggested in previous studies: 1. The observed MF is primordial, as mentioned earlier (e.g., Dib et al., 2007a). 2. The observed MF is a result of dynamical evolution starting from a standard IMF with no primordial radial variation (e.g., Portegies Zwart et al., 2007). Using numerous numerical simulations we study the dynamical evolution of the Arches cluster assuming the observed MF was indeed primordial. We compare the results from these simulations with the results from another set of simulations where the initial cluster properties are kept unchanged but a standard IMF with no radial variation is used instead. We investigate whether it is possible to attain the observed degree of mass segregation starting from an unsegregated cluster. We verify that the MFs and cluster parameters of the simulated clusters at are consistent with observations. We then investigate the differences in the dynamical evolution of the simulated Arches-like clusters with the two above-mentioned choices of IMFs focusing on the possibilities of a collisional runaway. Furthermore, we study the final fate and discuss the possible observational signatures of a collisional runaway depending on the stellar wind prescription. The arrangement of this paper is as follows. In §2 we describe our simulations. In §3 we summarize our key results. This is followed by §4 where we discuss the key observable signatures of a collisional runaway. We summarize and conclude in §5.
2. Initial Conditions
We simulate clusters consisting initially of stars with positions and velocities chosen according to a King profile (King, 1966) with dimensionless central potential in the range from to . The initial virial radius () of the cluster is set to , which results in simulated clusters that have characteristic radii, e.g., and tidal radius () at close to the observed values for the Arches cluster (Table 1, see also §1 for observed values). Our simulated clusters are initially Roche lobe filling. Numerical simulations by Gieles & Baumgardt (2008) show that dynamical evolution and tidal truncation makes initially underfilled and overfilled clusters Roche lobe filling and Roche lobe limited at timescales of the order of their half-mass relaxation time (). Since the typical initial for our simulated Arches-like clusters is much lower () than the current age of Arches, the above assumption is justified.
All the simulated clusters are assumed to be in a circular orbit around the Galactic center. Although the cluster orbit may be eccentric, the variations of its distance to the Galactic center are not expected to be significant for this study (Stolte et al., 2008). We simulate all clusters at a fixed Galacto-centric distance since given the present day mass and Galactic location of the Arches cluster, inspiral timescale from a larger distance is more than an order of magnitude longer than its estimated age (Gürkan & Rasio, 2005; Stolte et al., 2008). One may argue however, that Arches initially was a lot more massive (needs to be , Kim & Morris, 2003) and has lost most of its mass during its evolution and inspiral and is now observed at its current position just before complete disruption. We find in our simulations that the total mass loss from escaping stars through the tidal boundary and from stellar evolution typically is only of the initial cluster mass during the first . Since, at the current position of Arches the tidal effects of the Galaxy is the maximum if inspiral scenario is to be believed, this mass loss rate is an upper limit. Thus it is unlikely that Arches was initially more massive than .
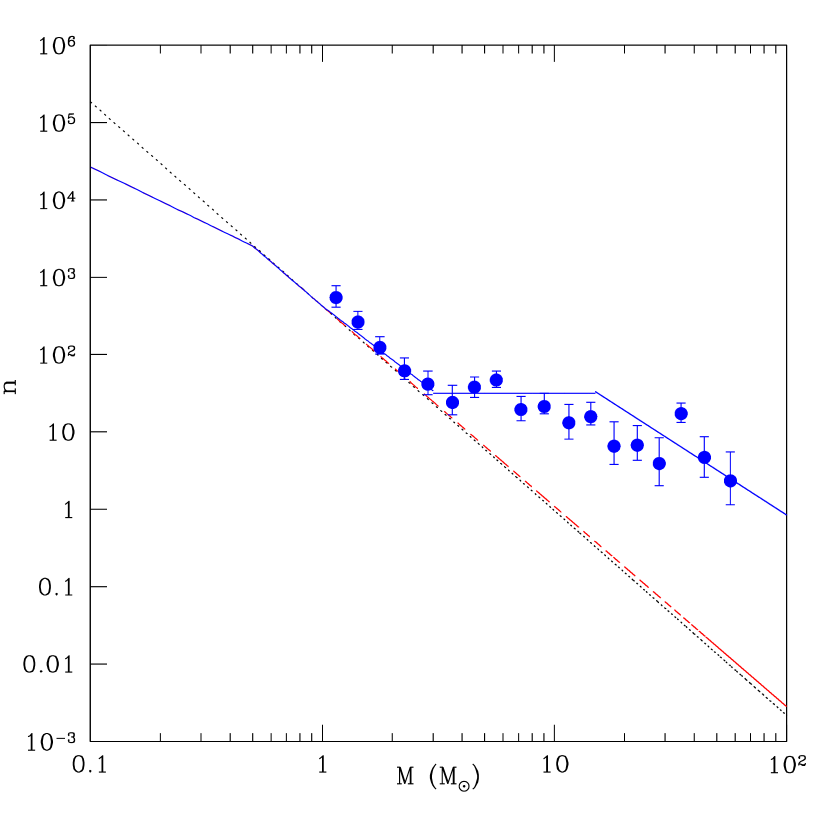
For each cluster profile we perform two sets of simulations using different IMFs to assign masses to stars. For the set of simulations with initially non-segregated clusters we use the IMF in Kroupa (2001) for the whole cluster (henceforth, Nseg). For the second set we choose a radially dependent IMF (henceforth, Seg), with a central top-heavy mass function for , very similar to the observed one of Kim et al. (2006, Figure 1) and a standard Kroupa (2001) IMF outside.
Initial cluster properties and key results are summarized in Table 1. In order to make sure that our results are robust against statistical fluctuations we repeat each simulation times varying the random seed for generating the positions and velocities for each cluster with the same IMF and initial . In order to advance the clusters in time we use the direct -body code NBODY4 (Aarseth, 2003) which includes the tidal effects of the Galaxy, the evolution of stars using the integrated SSE/BSE package (Hurley et al., 2000, 2002), and makes use of the GRAPE6 hardware to speed-up the computation of the gravitational forces between stars. The evolution of each cluster is followed for , which is longer than the approximate time when the first supernova explosions occur, turning the most massive stars into black holes and consequently ending any possible runaway-growth (Freitag & Benz, 2002; Freitag et al., 2006b, a). We do not have primordial binaries in our simulated clusters, although binaries created via three-body interactions are automatically included. The initial evolution of a star cluster is dominated by stellar evolution mass loss and two-body relaxation. Strong interaction mediated by binaries become a more important factor only at later times so far as the global evolution of the cluster is concerned. Including binaries, however, may decrease the mass segregation timescale and increase collision rate to some degree. Nevertheless, since the binary fraction in Arches is not known observationally, we choose not to consider primordial binaries rather than making a wild guess; the additional benefit is a significant reduction in computational cost.
| Name | )aaBound mass at the age () of the simulated cluster. | King | IMFccThe range in mass is | ddat | ()eeHighest mass reached for the two most massive stars in the simulation. | #Coll | ||||
|---|---|---|---|---|---|---|---|---|---|---|
| bbKing profile (King, 1966) | ||||||||||
| SW9-1 | ffAll quoted errors are error-bars from statistical fluctuations between the snapshots over which the cluster properties are averaged for the the simulated clusters. | , | ||||||||
| SW9-2 | , -ggMass does not grow above within | |||||||||
| SW8-1 | , | |||||||||
| SW8-2 | , | |||||||||
| SW7-1 | Seg | , | ||||||||
| SW7-2 | , | |||||||||
| SW6-1 | , | |||||||||
| SW6-2 | , | |||||||||
| SW5-1 | , | |||||||||
| SW5-2 | , | |||||||||
| NSW9-1 | , - | |||||||||
| NSW9-2 | , | |||||||||
| NSW8-1 | , | |||||||||
| NSW8-2 | , - | |||||||||
| NSW7-1 | NSeg | -, - | ||||||||
| NSW7-2 | , - | |||||||||
| NSW6-1 | , - | |||||||||
| NSW6-2 | -, - | |||||||||
| NSW5-1 | , | |||||||||
| NSW5-2 | , | |||||||||
3. Results
In this section we present the results from our numerical simulations. We show in detail the results for clusters with and we summarize more briefly the results for all other runs.
3.1. Evolution of the Mass Function and Observational Constraints
Here we show, how well the initially segregated (Seg) and unsegregated (NSeg) cluster models can reproduce the observed level of mass segregation at the current age () of the Arches cluster. As a condition for consistency, the simulated clusters should have a present day MF consistent with the observed MF at the age of the Arches cluster. We compare the MF from the simulated clusters with (Seg) and without (NSeg) mass segregation at with the observed MF.
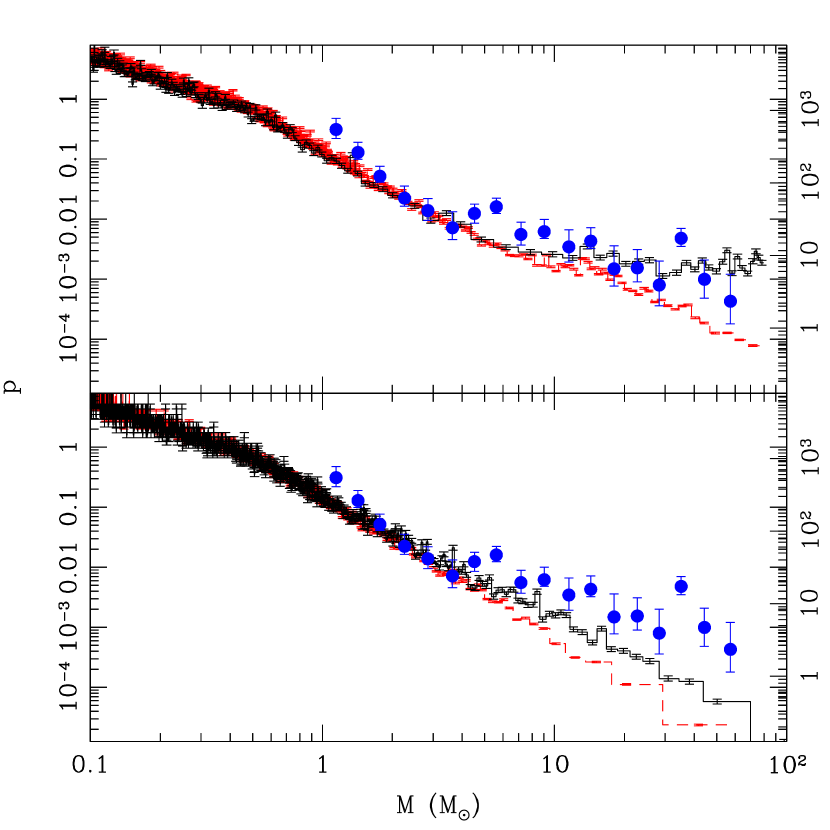
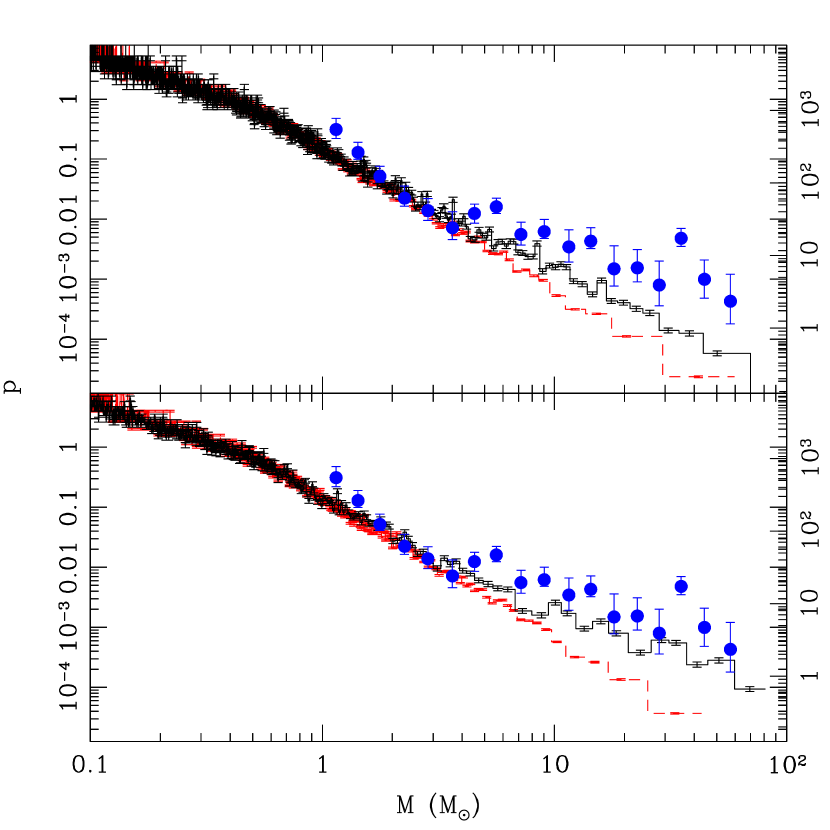
Figure 2 shows the MF within for runs SW8-1 and NSW8-1 at . Each mass bin contains stars so that the Poisson error is equal in each bin, and the MF is normalized such that its integral is unity. As it can be seen, while the evolved MF in the inner region of the Seg cluster is in good agreement with observations, this is not the case for the NSeg cluster. For the NSeg cluster the slope at the high mass end increases only marginally (from to ). While for the Seg cluster the MF becomes flatter, but remains still compatible with observations. Same results are obtained when the MFs are compared at . This indicates that the degree of mass segregation observed in the Arches cluster is not likely to result simply from the cluster’s dynamical evolution during its lifetime without any primordial mass segregation. It also indicates that, the MF at for the simulated cluster is consistent if the observed MF of the Arches cluster truly is imprinted from its star formation epoch as suggested by Dib (2007).
We should note that for the NSeg IMF, a much higher degree of mass segregation can be achieved if stellar evolution is not included in the simulations. We find that if we turn off stellar evolution, the degree of flattening in the MF of the simulated cluster at increases significantly compared to that with stellar evolution (Figure 3). Although the wind mass loss from the high-mass stars due to stellar evolution is negligible () compared to the total cluster mass in these simulations during the first , this mass is lost from the most massive stars in the cluster, which in turn reside near the center due to mass segregation. Thus this mass is lost from the deepest part of the cluster potential and can have a perceptible effect on the global properties of the cluster. From our results we conclude that the mass loss via stellar evolution from the massive stars can inhibit mass segregation to a certain extent and simulations done without taking that physical effect into account will overestimate the amount of mass segregation. Since this effect is only predominant for the most massive stars at a given time in the cluster, the quantitative effect will depend on the number of high-mass stars present in the cluster. Despite a lower total number of initial stars ( and ), simulations in Portegies Zwart et al. (2007) had more massive stars than our NSeg clusters because of the truncated IMF they used. Thus, if stellar evolution is included, mass segregation should have been even more strongly suppressed in their simulations compared to our simulations with the NSeg clusters (Figure 3). This further supports the notion that the level of observed mass segregation in the Arches cluster cannot have a fully dynamical origin.
3.2. Choice of IMF and Implications for Collisional Runaway
In general we find that for the clusters with primordial mass-segregation (set Seg) the number of collisions is always significantly larger compared to the clusters with a standard Kroupa IMF without any primordial mass segregation (set NSeg; see Table 1), for example, in the case by more than a factor of two ( for run SW8-1 and for run NSW8-1) within the first . This is mainly due to the top-heavyness of the Arches IMF within (§2) and the larger overall mass of our clusters with primordial mass segregation, resulting in a larger number of massive stars with large collision cross sections. Consequently, the runaway growth of a massive star is much more likely to take place in clusters from set Seg.
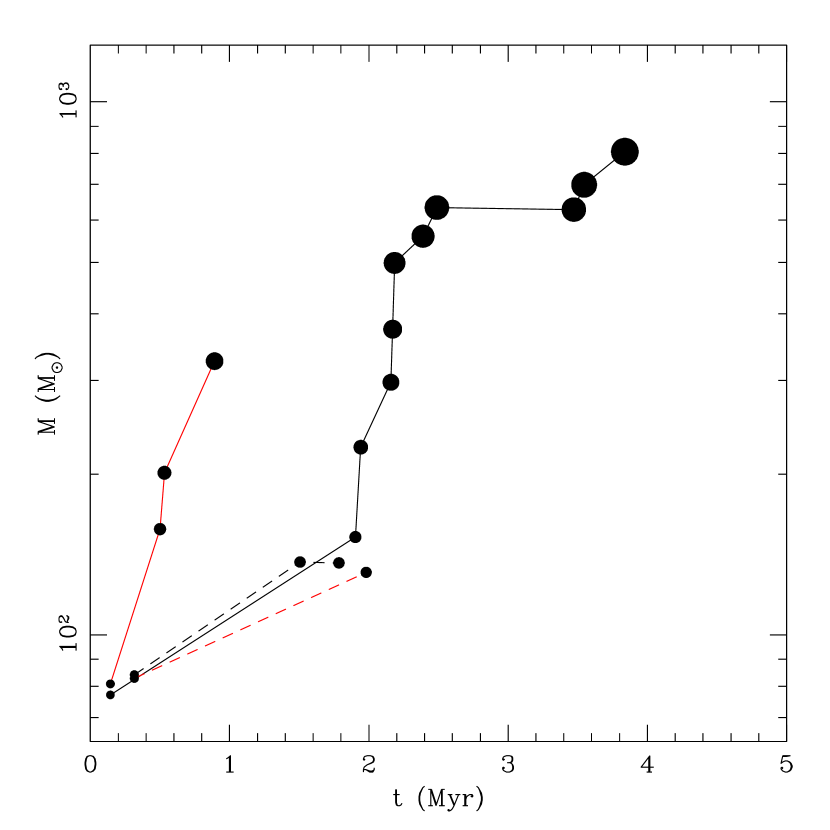
As an example, Figure 4 shows the mass of the two most massive stars over time for the cluster with the Seg IMF (run SW8-1) and the NSeg IMF (run NSW8-1). In the Seg case there is a clear evidence of a collisional runaway producing two very massive stars. The most massive star in this case attains a mass of through successive collisions. The second most massive star also grows significantly and reaches through successive collisions. A clear sign of a collisional runaway is a steep increase of the stellar mass through successive collisions. Figure 4 clearly shows that at the most massive star enters a runaway regime. The whole process of the runaway takes place between –. In case of NSeg IMF the two most massive stars experience only two to three collisions and there is no runaway happening. We obtain qualitatively similar results when changing the random seed to generate other equivalent initial conditions. For instance, in the run SW8-2 with Seg IMF we see a runaway, where the most massive star grows to within the first starting from about , through successive collisions. The corresponding run with the NSeg IMF, NSW8-2, did not exhibit any runaway growth (Table 1). A similar result is obtained for simulated clusters with other values. For example, Figure 5 shows the growth of the two most massive stars in the simulated clusters for runs SW7-1 and NSW7-1, both clusters with , but the first from the Seg and the latter from the NSeg set. Again, the run from set Seg shows clear evidence of a collisional runaway, whereas the equivalent cluster from set NSeg shows none. (For a full list of simulation results with other initial values, see Table 1.) Note that, in the collisional runaway of the stars in our simulations, we find that the stars can grow even after via collisions. This is due to the collisional rejuvenation prescription in BSE, which assumes complete mixing (Hurley et al., 2000). Thus the collisional stars live longer compared to their normal lifetime. This assumption is of course a simplification and the amount of mixing and thus rejuvenation depends on the details of the kinematics of the collisions (e.g., Sills et al., 1997; Glebbeek & Pols, 2008) . However, this assumption gives an upper limit of the degree of rejuvenation and lets the stars grow for a longer time than with a more realistic rejuvenation prescription. In this study for the considerations of a collisional runaway we take collisional sequences only upto .

A very interesting aspect of these results with the Seg IMF is that, many of these runs lead to a double collisional runaway, one being stronger than the other (e.g., runs SW8-1,2, SW7-1,2; see Table 1 for a full list) creating two very massive stars (VMS). Double runaways have been studied and observed in some previous simulations with primordial binaries (e.g., Gürkan et al., 2006), however, a double runaway even without primordial binaries has not been observed before. Due to the flat mass spectrum in the high mass end of the Seg IMF, there is a larger reservoir of high-mass stars increasing the chance of a double runaway. A double runaway does not necessarily mean black hole binaries, as discussed in Gürkan et al. (2006), since the two VMSs may still collide with each other at a later time but before compact object formation (e.g., SW8-2, SW7-1). The signature of a double runaway and production of two VMSs seems to be common in all of our simulations with the Seg IMF, where the initial concentration is conducive to a collisional runaway, in particular for runs with King concentration parameters (Figure 6).
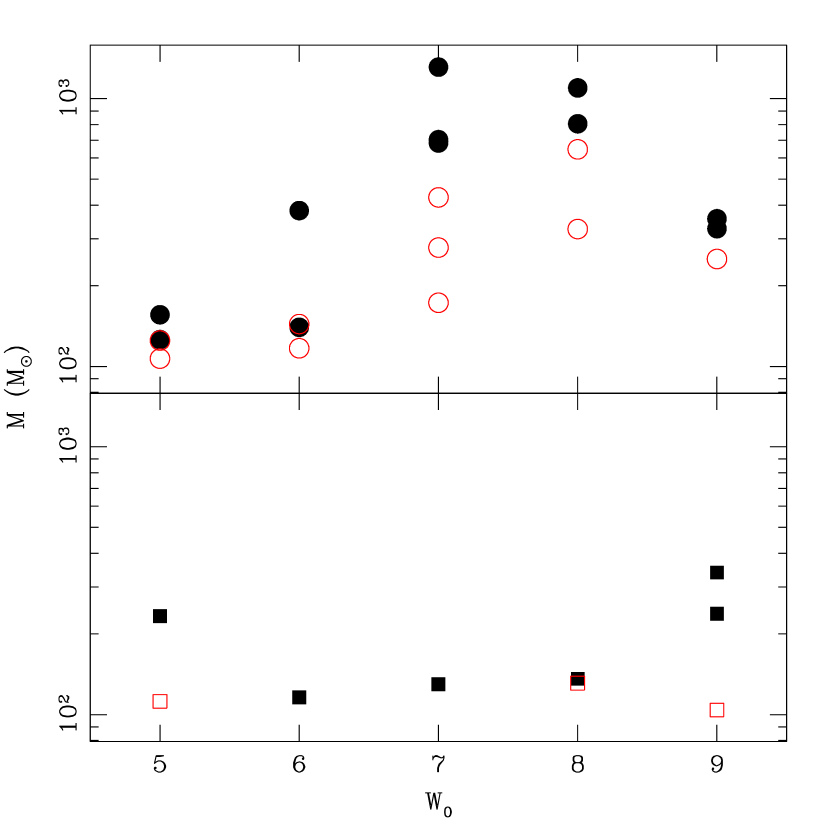
Similar results are obtained for clusters with other initial concentrations or values. The main difference is in the final mass of the most massive stars, shown in Figure 6. The final stellar mass is also subject to statistical fluctuations to a certain extent. The collisional runaway with the Seg IMF and is weak, whereas, for there is no runaway (Table 1). For each of these runs with the Seg IMF, the corresponding simulations with the same initial but the NSeg IMF do not exhibit any runaway and do not produce the VMSs. However, for , both the Seg and the NSeg IMF simulations show runaways and the masses of the collisionally created most massive stars are comparable. In the Seg case shows a weaker collisional runaway in our simulated examples. This is because from a King model with to one with , the core radius decreases considerably, thus the top-heavy IMF is within a smaller volume. As a result the total initial mass as well as the number of high-mass stars decrease. From our simulations, we find that with the Seg IMF, and are optimal for strong collisional runaways. On one hand a lower decreases the probability of a runaway because of the lower central density. On the other hand, a higher gives the same result although the central density is higher, because of the lower overall mass of the cluster as well as the lower number of high-mass stars.
3.3. Enhanced Mass Loss via Stellar Winds
High-mass stars can lose a significant fraction of their mass through stellar winds (e.g., Cassinelli, 1979; Chiosi & Maeder, 1986; Kudritzki & Puls, 2000). Glebbeek et al. (2009) show that a VMS generated via stellar collisions may lose mass through stellar winds at such a high rate that its collisional growth may be quenched. We explore this possibility, following their work, for our simulated clusters SW8-1 and SW8-2, where collisional runaways have been observed. Following Glebbeek et al. (2009) each collision is treated using the “Make Me a Massive Star” (MMAMS) software package (Gaburov et al., 2008; Lombardi et al., 2002), which gives the properties of the collision product. This output is then imported into the Eggleton stellar evolution code (Eggleton, 1971, 1972; Pols et al., 1995) using the method of Glebbeek et al. (2008). This method is repeated for every collision in the collision chain (for a more detailed description see Glebbeek et al., 2009, especially Section ).
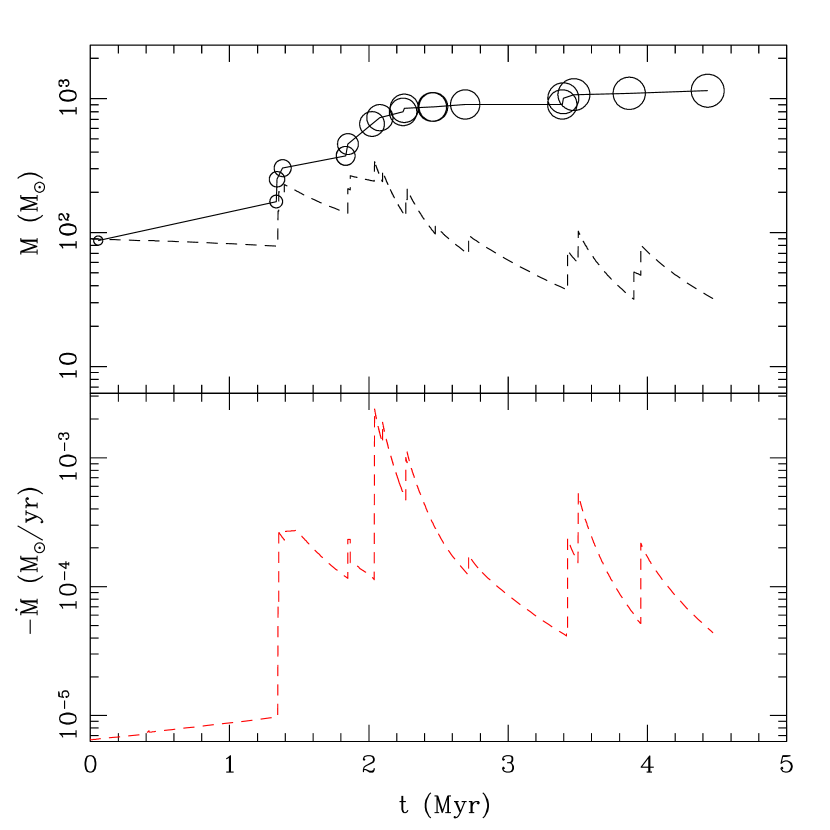
Figure 7 shows the time evolution of the most massive star for the run SW8-2 as an example. The solid line in the top panel shows the collisional growth of the stellar mass in the runaway observed in our run SW8-2, using the standard wind prescriptions from BSE/SSE, included in NBODY4. The dashed line in the top panel tracks the mass of the star assuming the wind mass loss prescriptions suggested by Glebbeek et al. (2009). The bottom panel shows the mass loss rate via stellar winds as a function of time according to Glebbeek et al. (2009). With this wind mass loss prescription, while collisions increase the stellar mass, the increased stellar mass in turn leads to enhanced wind mass loss. The growth of the stellar mass through the chain of collisions is quenched and instead of the VMS a star of only is produced with this wind prescription. At the final stage the star is burning Helium in its core and has a high surface Helium abundance () (Figure 8).

We should mention that the modeling of stellar winds from high-mass stars is quite uncertain, and various treatments often come from extrapolations from observed stars at a lower mass. Depending on the prescription wind mass loss rates may vary by orders of magnitude. If indeed the high wind mass loss prescription is correct, then a VMS will not be produced even when a collisional runaway takes place. Interestingly, the mass lost via stellar winds due to the collisional growth of the stars will be extremely Helium rich which may provide observable signatures (more on this in §4.3). Similar results are obtained from the collision chain in run SW8-1.
4. Possible observational Signatures of a Collisional Runaway
Here we discuss the possible observable signatures of a collisional runaway in a cluster. In the previous section we have shown that depending on the stellar wind prescription a collisional runaway may create a VMS or the mass growth can be quenched through high wind mass loss. Here we consider both cases and discuss possible observable signatures of both possibilities.
4.1. Possible Creation of another Pistol Star
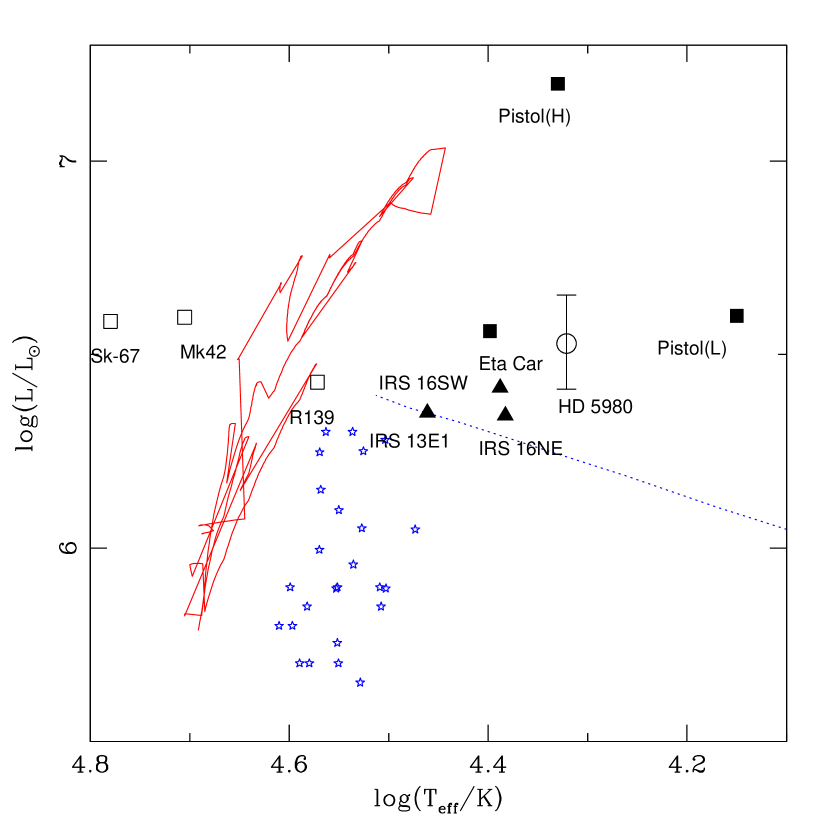
The Quintuplet cluster is very similar to the Arches cluster. It is also very near the Galactic center (projected distance ; e.g., Nagata et al., 1990; Portegies Zwart et al., 2002). The Arches and the Quintuplet are also similar in their metallicities, and mass (Najarro et al., 2009). The Arches is younger () than the Quintuplet cluster (). The Pistol star is one of the most interesting and well studied objects in the Quintuplet. This is one of the brightest stars ever observed (Figure 9; Moneti et al., 1994; Cotera et al., 1996; Lang et al., 1997; Figer et al., 1998). The inferred initial mass of the Pistol star is . The Pistol star is classified as a luminous blue variable (LBV Figer et al., 1998) or a B[e] (Morris et al., 1996) star. The stellar surface is extremely Helium rich and it has lost a significant fraction of its mass via Helium rich massive stellar winds (e.g. Figer et al., 1995; Cotera et al., 1996; Timmermann et al., 1996; Lang et al., 1997; Figer et al., 1998). From our results we find that the massive stars generated via collisional runaways may be a potential channel to produce a massive and Helium rich Pistol like star (Figure 7, 8). Figure 9 shows the evolution of the most massive star found in run SW8-2 for the enhanced wind mass loss case as an example. The massive star produced through the collisional runaway spends a significant period of time (e.g., in case of the run SW8-2) above the Humphreys-Davidson limit (Humphreys & Davidson, 1979) like the Pistol star. Thus if the Arches was indeed created with a top-heavy IMF at the center as is observed today, then a Pistol-like star could be created at some point. However, due to the uncertainty in the age estimate of the Arches cluster and the onset of the collisional runaway in simulations depending on the initial conditions it is not possible to predict whether a similar LBV star should already have been created in the Arches cluster and could be observed today.
4.2. IMBH Progenitors
The presence of supermassive black holes at the center of most galaxies is now well established (e.g., Richstone et al., 1998; Kormendy & Gebhardt, 2001; Ghez et al., 2005). Extrapolating the relation between the host mass and the black hole mass it has been postulated that massive clusters may also host black holes in the mass range – (e.g., see reviews by van der Marel, 2004; Rasio et al., 2004). These black holes are much less massive than the supermassive black holes at the centers of most galaxies but more massive than the stellar-mass black holes expected as remnants from high-mass stars. Although no conclusive observational evidence for an IMBH has been obtained yet, there are several interesting candidates (e.g., Farrell et al., 2009; Irwin et al., 2009). The main proposed channel of formation for these IMBHs is through collisional runaways in dense clusters (e.g., Freitag & Benz, 2002; Portegies Zwart & McMillan, 2002; Gürkan et al., 2004, 2006; Freitag et al., 2006b, a, 2007, a, b). It is thus exciting to find young star clusters where a collisional runaway may have taken place.
The simulated clusters with the Seg IMF, in particular with , , and create VMSs via collisional runaway. The counterparts of the same clusters with the more standard NSeg IMF do not produce these VMSs. If the winds do not quench the mass growth via collisions, then the VMSs can potentially be IMBH progenitors (e.g. Fryer, 1999; Fryer & Kalogera, 2001; Portegies Zwart & McMillan, 2002; Heger et al., 2005; Belczynski et al., 2009). If an IMBH is indeed produced, there can be many observational signatures. Even without primordial binaries, at the high densities attained at the core binaries can form dynamically from three-body interactions. IMBHs being a lot more massive than the typical stars in its vicinity inevitably exchange into a binary or a higher order bound system (Gill et al., 2008). A stable mass transfer to the IMBH from its binary companion can be visible as ultra luminous X-ray sources. Inspiral and capture of compact objects such as stellar mass black holes and neutron stars into the IMBH can be a strong gravity wave source detectable with the Laser Interferometric Space Antennae (LISA). The simulated clusters with the Seg IMF, often show signatures of two separate runaways, one weaker than the other. These runaways may produce two VMSs, both of which may create massive black holes. If the VMSs do not collide prior to creating the massive black holes a massive binary black hole system can be formed. If produced, an IMBH-IMBH binary is a good source for LISA during the inspiral phase (see Gürkan et al., 2006).
4.3. Enhanced Wind Mass Loss: Helium Enrichment
If the wind mass loss of the most massive star dominates over its collisional growth, then the rapid increase in mass is inhibited. (Figure 7). In this case a VMS is not produced as a result of the runaway. Instead, a large amount of processed stellar material is injected into the surrounding interstellar medium, which is, consequently, expected to become strongly enriched in Helium. For example, the total mass lost via winds from the most massive star formed in the runaway in the run SW8-2 is , while its can exceed , resulting in of Helium ejected via winds. In contrast, if the stars, that merged to form the VMS, are evolved in isolation, the total mass of ejected Helium would be significantly lower, , within the first . An anomalously high Helium enrichment of the surrounding interstellar medium may, therefore, provide an observational signature for a collisional runaway.
However, such a signature might not necessarily be found inside Arches but rather outside of it, as the material lost through winds has rather large velocities. Assuming the terminal flow velocity of the wind from O/B stars for solar metallicities is times the escape speed from the surface of the star (Vink et al., 2001), we find that the wind velocity for our collisionally formed VMSs is . As these velocities are much larger than the escape speed of even much more massive star clusters, it is likely that the material escapes the Arches cluster entirely. On the other hand, this material can also slow down through collisions with winds from other massive stars. Such multiple stellar wind interactions result in a complex network of shock compressed, extremely hot () gas that should then leave the cluster as a cluster wind (see, e.g., Canto et al., 2000). The structure of this wind consists of four zones (Silich et al., 2004): a star cluster region filled with a hot X-ray plasma, an X-ray halo with decreasing temperature profile, a line-cooling, recombining zone, and a region of recombined gas, exposed to the UV radiation from the central star cluster. Indeed diffuse X-ray bright sources have been observed within Arches as well as extending beyond the cluster radius (e.g. Yusef-Zadeh et al., 2002; Rockefeller et al., 2005). This extremely hot gas may also be confined due to ram pressure exerted by a molecular cloud or other external medium surrounding the cluster (Rockefeller et al., 2005).
Helium abundances are usually determined through measuring Helium recombination lines (e.g., Peimbert et al., 2000). Thus a strong Helium enrichment can then only be detected outside the X-ray halo region, in the line cooling zone. Based on detailed calculations of Silich et al. (2004), this region is outside a radius of - from the Arches cluster. Other signatures of a collisional runaway might be provided by the wind structure itself. This is because the extension and physical parameters of the diffuse X-ray emitting region are mainly dependent on the sum of the mass-loss rates of the individual sources. Given that for the case of a runaway this mass loss rate can be significantly increased, it may strongly influence the appearance of the cluster winds. However, such imprints might be very diffucult to detect. This is in part because our rates for the most massive star are highly time-variable, varying by two orders of magnitudes within a few , while particularly large values in excess of the total mass injection rate for all other Arches stars of (Stevens & Hartwell, 2003) are only attained during an even shorter timescale. Another reason is that the Arches cluster wind may be confined by cooler surrounding inter stellar material, an effect that is hard to quantify (Rockefeller et al., 2005).
Instead of searching for imprints of a runaway in the global cluster wind structure, signatures may be found in the properties of individual objects, as stellar radii and mass loss rates of runaway stars can be unusual (Figure 7; Glebbeek et al., 2009). One way to directly detect and constrain the mass loss rate, the effective radius of the star, and the wind velocities is by exploiting the so called Baldwin effect (Baldwin, 1977; Morris et al., 1993), which is an anticorrelation between the line luminosity of one strong emission line, such as HeII (often found in WR winds), and the continuum luminosity. van Gent et al. (2001) show that the ratio of line and continuum luminosity, the equivalent width , depends on the mass loss rate, , the terminal velocity of the wind, , and the effective radius , , as . When the distance of the star is known, and the temperature can be estimated, observation of can constrain the wind mass loss rate, wind velocities and the effective radii of the stars.
5. Summary and Conclusion
We carried out many -body simulations with initial conditions chosen such as to resemble the Arches cluster. Using a standard Kroupa (2001) IMF with no radial variation (NSeg) and a radially dependent IMF that corresponds to the level of mass segregation inferred from observations (Seg; e.g. Dib et al., 2007a), we study possible consequences and discuss potential observable signatures to distinguish between the two cases.
We show that the degree of mass segregation via dynamical evolution of the simulated clusters during the first is minor both for the Seg and the NSeg IMF (Figure 2). Thus, while runs with the Seg IMF reproduce well all parts of the currently observed slopes in the MF at , those with the NSeg IMF do not produce enough mass segregation within the Arches lifetime to match the observed MF as well (Figure 2). Therefore, our results indicate that the present day observed degree of mass segregation in the Arches cluster cannot be a result of dynamics only and at least some degree of primordial mass segregation is required.
We further show that the choice of IMF changes the overall dynamical evolution significantly for Arches like clusters over a range of initial . For the Seg IMF there is clear evidence of collisional runaway, producing stars up to over a range of initial concentrations (Table 1, Figures 4, 5, 6). In contrast, with the more standard NSeg IMF no collisional runaway is observed with the same initial conditions. We find that the sequence of collisions in the simulations with successful collisional runaway starts at around . Note that the current estimated age of the Arches is (e.g., Stolte et al., 2002). Hence, if the observed top-heavy MF within is indeed primordial, then it is possible that a collisional runaway has started or is bound to happen. Unfortunately, the uncertainty in the age estimation prevents us from predicting whether a collisional runaway should already have taken place in the Arches.
An interesting aspect of the collisional runaways observed in this study is the general tendency of a double runaway in cases where the collisional runaway is strong (e.g., runs SW8-1,2 and runs SW7-1,2, see Table 1). Double collisional runaways have been observed and studied in numerical simulations before (Gürkan et al., 2006). However, those simulations concluded that primordial binaries are a necessity for a double collisional runaway. It is very interesting that with the primordially mass-segregated clusters even without any primordial binaries double collisional runaways can take place. Due to the flatness in the high mass end of the IMF in this case, there is a larger reservoir of high-mass stars. Thus the probability to start a second runaway is higher. The ultimate fate of the smaller runaway is dependent on the statistical fluctuations of the simulation (see §3). However, it is possible that the VMSs do not collide prior to compact object formation and both stay bound to the cluster after their respective supernova explosions (e.g., run SW8-1). In such a case they may form IMBH binaries or coalesce at the center of the cluster. If possible to form, this can create a very strong gravity wave signal for LISA (Gürkan et al., 2006).
If the mass loss from stellar evolution driven winds is too high then the collisional mass growth is quenched (Glebbeek et al., 2009). By evolving the collision products separately following each successive collision in a sequence of runaway collisions according to the prescription in Glebbeek et al. (2009) we find that the VMSs are not produced as a result of a collisional runaway. Instead, a Helium star of a few tens of a Solar mass is created (Figure 7). The mass lost via these winds is extremely Helium rich, with reaching beyond . In this case the cluster as well as its surrounding medium will be enriched by this Helium rich gas, which could be observed through recombination at distances beyond from the Arches cluster.
Further indications of a collisional runaway might be provided by the runaway object itself, as such an object has a rather unusual radius and mass loss rate compared to ordinary massive stars. Constraints on the radius, mass loss rate, and the wind speeds may be obtained using the Baldwin effect (e.g., Baldwin, 1977; van Gent et al., 2001). Furthermore, during the evolution of the runaway star, a Pistol like stellar object may also be produced (§4.1). However, since the duration for which the star attains Pistol like high luminosities is short, it is not possible to predict whether a Pistol like star should already have been created in Arches given the uncertainties in the age estimation and the statistical fluctuations in the exact onset and the details of the simulated collisional runaways.
Nevertheless, we should point out that the above recipe to follow the runaway star for these high stellar winds is not completely self-consistent. Each collision in a cluster is dependent on the masses and radii of the collision progenitors. Since, severe wind mass loss from the stars changes the masses of the stars significantly, the chain of collisions in the runaway may also be different. However, this model still provides us with an estimate of the total mass loss from the VMS via stellar winds, its stellar properties, as well as the composition of the ejected material if a runaway did indeed happen.
We thank Farhad Yusef-Zadeh for helpful suggestions. This research was supported by NASA Grant NNX08AG66G and NSF Grant AST-0607498 at Northwestern University. This research was partly done at KITP while the authors participated in the spring 2009 program on “Formation and Evolution of Globular Clusters”, and was supported in part by the NSF Grant PHY05-51164.
References
- Aarseth (2003) Aarseth, S. J. 2003, Gravitational N-Body Simulations, ed. S. J. Aarseth
- Baldwin (1977) Baldwin, J. A. 1977, ApJ, 214, 679
- Baumgardt et al. (2008) Baumgardt, H., De Marchi, G., & Kroupa, P. 2008, ApJ, 685, 247
- Belczynski et al. (2009) Belczynski, K., Bulik, T., Fryer, C. L., Ruiter, A., Vink, J. S., & Hurley, J. R. 2009, arXiv:0904.2784v1 [astro-ph.SR]
- Bonnell & Davies (1998) Bonnell, I. A. & Davies, M. B. 1998, MNRAS, 295, 691
- Canto et al. (2000) Canto, J., Raga, A. C., , & Rodriguez, L. F. 2000, The Astrophysical Journal, 536, 896
- Cassinelli (1979) Cassinelli, J. P. 1979, ARA&A, 17, 275
- Chiosi & Maeder (1986) Chiosi, C. & Maeder, A. 1986, ARA&A, 24, 329
- Clark et al. (2009) Clark, J. S., Crowther, P. A., & Mikles, V. J. 2009, arXiv:0909.3818v1 [astro-ph.SR]
- Cotera et al. (1996) Cotera, A. S., Erickson, E. F., Colgan, S. W. J., Simpson, J. P., Allen, D. A., & Burton, M. G. 1996, ApJ, 461, 750
- Dabringhausen et al. (2009) Dabringhausen, J., Kroupa, P., & Baumgardt, H. 2009, MNRAS, 394, 1529
- Demleitner et al. (2001) Demleitner, M., Accomazzi, A., Eichhorn, G., Grant, C. S., Kurtz, M. J., & Murray, S. S. 2001, in Astronomical Society of the Pacific Conference Series, Vol. 238, Astronomical Data Analysis Software and Systems X, ed. F. R. Harnden, Jr., F. A. Primini, & H. E. Payne, 321
- Dib (2007) Dib, S. 2007, Journal of Korean Astronomical Society, 40, 157
- Dib et al. (2007a) Dib, S., Kim, J., & Shadmehri, M. 2007a, MNRAS, 381, L40
- Dib et al. (2007b) Dib, S., Kim, J., Vázquez-Semadeni, E., Burkert, A., & Shadmehri, M. 2007b, ApJ, 661, 262
- Eggleton (1971) Eggleton, P. P. 1971, MNRAS, 151, 351
- Eggleton (1972) —. 1972, MNRAS, 156, 361
- Elmegreen (2004) Elmegreen, B. G. 2004, MNRAS, 354, 367
- Elmegreen & Shadmehri (2003) Elmegreen, B. G. & Shadmehri, M. 2003, MNRAS, 338, 817
- Farrell et al. (2009) Farrell, S. A., Webb, N. A., Barret, D., Godet, O., & Rodrigues, J. M. 2009, Nature, 460, 73
- Figer et al. (1999) Figer, D. F., Kim, S. S., Morris, M., Serabyn, E., Rich, R. M., & McLean, I. S. 1999, ApJ, 525, 750
- Figer et al. (1995) Figer, D. F., McLean, I. S., & Morris, M. 1995, ApJ, 447, L29
- Figer et al. (1998) Figer, D. F., Najarro, F., Morris, M., McLean, I. S., Geballe, T. R., Ghez, A. M., & Langer, N. 1998, ApJ, 506, 384
- Freitag & Benz (2002) Freitag, M. & Benz, W. 2002, A&A, 394, 345
- Freitag et al. (2007) Freitag, M., Guerkan, M. A., & Rasio, F. A. 2007, in Astronomical Society of the Pacific Conference Series, Vol. 367, Massive Stars in Interactive Binaries, ed. N. St.-Louis & A. F. J. Moffat, 707
- Freitag et al. (2006a) Freitag, M., Gürkan, M. A., & Rasio, F. A. 2006a, MNRAS, 368, 141
- Freitag et al. (2006b) Freitag, M., Rasio, F. A., & Baumgardt, H. 2006b, MNRAS, 368, 121
- Fryer (1999) Fryer, C. L. 1999, ApJ, 522, 413
- Fryer & Kalogera (2001) Fryer, C. L. & Kalogera, V. 2001, ApJ, 554, 548
- Gaburov et al. (2008) Gaburov, E., Lombardi, J. C., & Portegies Zwart, S. 2008, MNRAS, 383, L5
- Ghez et al. (2005) Ghez, A. M., Salim, S., Hornstein, S. D., Tanner, A., Lu, J. R., Morris, M., Becklin, E. E., & Duchêne, G. 2005, ApJ, 620, 744
- Gieles & Baumgardt (2008) Gieles, M. & Baumgardt, H. 2008, MNRAS, 389, L28
- Gill et al. (2008) Gill, M., Trenti, M., Miller, M. C., van der Marel, R., Hamilton, D., & Stiavelli, M. 2008, ApJ, 686, 303
- Glebbeek et al. (2009) Glebbeek, E., Gaburov, E., de Mink, S. E., Pols, O. R., & Portegies Zwart, S. F. 2009, A&A, 497, 255
- Glebbeek & Pols (2008) Glebbeek, E. & Pols, O. R. 2008, A&A, 488, 1017
- Glebbeek et al. (2008) Glebbeek, E., Pols, O. R., & Hurley, J. R. 2008, A&A, 488, 1007
- Gürkan et al. (2006) Gürkan, M. A., Fregeau, J. M., & Rasio, F. A. 2006, ApJ, 640, L39
- Gürkan et al. (2004) Gürkan, M. A., Freitag, M., & Rasio, F. A. 2004, ApJ, 604, 632
- Gürkan & Rasio (2005) Gürkan, M. A. & Rasio, F. A. 2005, ApJ, 628, 236
- Heger et al. (2005) Heger, A., Woosley, S. E., & Baraffe, I. 2005, in Astronomical Society of the Pacific Conference Series, Vol. 332, The Fate of the Most Massive Stars, ed. R. Humphreys & K. Stanek, 339
- Hillenbrand & Hartmann (1998) Hillenbrand, L. A. & Hartmann, L. W. 1998, ApJ, 492, 540
- Humphreys & Davidson (1979) Humphreys, R. M. & Davidson, K. 1979, ApJ, 232, 409
- Hurley et al. (2000) Hurley, J. R., Pols, O. R., & Tout, C. A. 2000, MNRAS, 315, 543
- Hurley et al. (2002) Hurley, J. R., Tout, C. A., & Pols, O. R. 2002, MNRAS, 329, 897
- Irwin et al. (2009) Irwin, J. A., Brink, T., Bregman, J. N., & Roberts, T. P. 2009, arXiv:0908.1115v1
- Kim et al. (2006) Kim, S. S., Figer, D. F., Kudritzki, R. P., & Najarro, F. 2006, ApJ, 653, L113
- Kim et al. (2007) —. 2007, Journal of Korean Astronomical Society, 40, 153
- Kim & Morris (2003) Kim, S. S. & Morris, M. 2003, ApJ, 597, 312
- King (1966) King, I. R. 1966, AJ, 71, 64
- Kormendy & Gebhardt (2001) Kormendy, J. & Gebhardt, K. 2001, in American Institute of Physics Conference Series, Vol. 586, 20th Texas Symposium on relativistic astrophysics, ed. J. C. Wheeler & H. Martel, 363–381
- Kroupa (2001) Kroupa, P. 2001, MNRAS, 322, 231
- Krumholz et al. (2009) Krumholz, M. R., McKee, C. F., & Tumlinson, J. 2009, ApJ, 699, 850
- Kudritzki & Puls (2000) Kudritzki, R.-P. & Puls, J. 2000, ARA&A, 38, 613
- Lang et al. (1997) Lang, C. C., Goss, W. M., & Wood, D. O. S. 1997, ApJ, 474, 275
- Lombardi et al. (2002) Lombardi, Jr., J. C., Warren, J. S., Rasio, F. A., Sills, A., & Warren, A. R. 2002, ApJ, 568, 939
- Miller & Scalo (1979) Miller, G. E. & Scalo, J. M. 1979, ApJS, 41, 513
- Moneti et al. (1994) Moneti, A., Glass, I. S., & Moorwood, A. F. M. 1994, MNRAS, 268, 194
- Morris et al. (1993) Morris, P., Conti, P. S., Lamers, H. J. G. L. M., & Koenigsberger, G. 1993, ApJ, 414, L25
- Morris et al. (1996) Morris, P. W., Eenens, P. R. J., Hanson, M. M., Conti, P. S., & Blum, R. D. 1996, ApJ, 470, 597
- Nagata et al. (1995) Nagata, T., Woodward, C. E., Shure, M., & Kobayashi, N. 1995, AJ, 109, 1676
- Nagata et al. (1990) Nagata, T., Woodward, C. E., Shure, M., Pipher, J. L., & Okuda, H. 1990, ApJ, 351, 83
- Najarro et al. (2009) Najarro, F., Figer, D. F., Hillier, D. J., Geballe, T. R., & Kudritzki, R. P. 2009, ApJ, 691, 1816
- Nakano (1966) Nakano, T. 1966, Progress of Theoretical Physics, 36, 515
- Peimbert et al. (2000) Peimbert, M., Peimbert, A., & Ruiz, M. T. 2000, ApJ, 541, 688
- Pols et al. (1995) Pols, O. R., Tout, C. A., Eggleton, P. P., & Han, Z. 1995, MNRAS, 274, 964
- Portegies Zwart et al. (2007) Portegies Zwart, S., Gaburov, E., Chen, H.-C., & Gürkan, M. A. 2007, MNRAS, 378, L29
- Portegies Zwart et al. (2002) Portegies Zwart, S. F., Makino, J., McMillan, S. L. W., & Hut, P. 2002, ApJ, 565, 265
- Portegies Zwart & McMillan (2002) Portegies Zwart, S. F. & McMillan, S. L. W. 2002, ApJ, 576, 899
- Rasio et al. (2004) Rasio, F. A., Freitag, M., & Gürkan, M. A. 2004, in Coevolution of Black Holes and Galaxies, ed. L. C. Ho, 138
- Richstone et al. (1998) Richstone, D., Ajhar, E. A., Bender, R., Bower, G., Dressler, A., Faber, S. M., Filippenko, A. V., Gebhardt, K., Green, R., Ho, L. C., Kormendy, J., Lauer, T. R., Magorrian, J., & Tremaine, S. 1998, Nature, 395, A14
- Rockefeller et al. (2005) Rockefeller, G., Fryer, C. L., Melia, F., & Wang, Q. D. 2005, ApJ, 623, 171
- Salpeter (1959) Salpeter, E. E. 1959, ApJ, 129, 608
- Serabyn et al. (1998) Serabyn, E., Shupe, D., & Figer, D. F. 1998, Nature, 394, 448
- Silich et al. (2004) Silich, S., Tenorio-Tagle, G., & Rodríguez-González, A. 2004, ApJ, 610, 226
- Silk & Takahashi (1979) Silk, J. & Takahashi, T. 1979, ApJ, 229, 242
- Sills et al. (1997) Sills, A., Lombardi, Jr., J. C., Bailyn, C. D., Demarque, P., Rasio, F. A., & Shapiro, S. L. 1997, ApJ, 487, 290
- Stevens & Hartwell (2003) Stevens, I. R. & Hartwell, J. M. 2003, MNRAS, 339, 280
- Stolte (2006) Stolte, A. 2006, Journal of Physics Conference Series, 54, 217
- Stolte et al. (2008) Stolte, A., Ghez, A. M., Morris, M., Lu, J. R., Brandner, W., & Matthews, K. 2008, ApJ, 675, 1278
- Stolte et al. (2002) Stolte, A., Grebel, E. K., Brandner, W., & Figer, D. F. 2002, A&A, 394, 459
- Subramaniam et al. (1993) Subramaniam, A., Sagar, R., & Bhatt, H. C. 1993, A&A, 273, 100
- Tan et al. (2006) Tan, J. C., Krumholz, M. R., & McKee, C. F. 2006, ApJ, 641, L121
- Timmermann et al. (1996) Timmermann, R., Genzel, R., Poglitsch, A., Lutz, D., Madden, S. C., Nikola, T., Geis, N., & Townes, C. H. 1996, ApJ, 466, 242
- van der Marel (2004) van der Marel, R. P. 2004, in Coevolution of Black Holes and Galaxies, ed. L. C. Ho, 37
- van Gent et al. (2001) van Gent, J. I., Lamers, H. J. G. L. M., de Koter, A., & Morris, P. W. 2001, A&A, 372, 963
- Vink et al. (2001) Vink, J. S., de Koter, A., & Lamers, H. J. G. L. M. 2001, A&A, 369, 574
- Yusef-Zadeh et al. (2002) Yusef-Zadeh, F., Law, C., Wardle, M., Wang, Q. D., Fruscione, A., Lang, C. C., & Cotera, A. 2002, ApJ, 570, 665