Methods for measuring the citations and productivity of scientists across time and discipline
Abstract
Publication statistics are ubiquitous in the ratings of scientific achievement, with citation counts and paper tallies factoring into an individual’s consideration for postdoctoral positions, junior faculty, and tenure. Citation statistics are designed to quantify individual career achievement, both at the level of a single publication, and over an individual’s entire career. While some academic careers are defined by a few significant papers (possibly out of many), other academic careers are defined by the cumulative contribution made by the author’s publications to the body of science. Several metrics have been formulated to quantify an individual’s publication career, yet none of these metrics account for the collaboration group size, and the time dependence of citation counts. In this paper we normalize publication metrics in order to achieve a universal framework for analyzing and comparing scientific achievement across both time and discipline. We study the publication careers of individual authors over the 50-year period 1958-2008 within six high-impact journals: CELL, the New England Journal of Medicine (NEJM), Nature, the Proceedings of the National Academy of Science (PNAS), Physical Review Letters (PRL), and Science. Using the normalized metrics (i) “citation shares” to quantify scientific success, and (ii) “paper shares” to quantify scientific productivity, we compare the career achievement of individual authors within each journal, where each journal represents a local arena for competition. We uncover quantifiable statistical regularity in the probability density function (pdf) of scientific achievement in all journals analyzed, which suggests that a fundamental driving force underlying scientific achievement is the competitive nature of scientific advancement.
I Introduction
The study of human success is difficult because information has traditionally been recorded for only the excellent, while individuals with lower than average careers are generally neglected in the record books. Hence, drawing conclusions based only on the relatively few stellar careers will suffer to some extent from selection bias. In contrast, conclusions drawn from the entire population might better illustrate the mechanisms of success. While it is not feasible to obtain the career publication data for every scientist in every journal, it is possible to study a subset of scientists that succeed in publishing in a specific journal.
Several empirical studies have analyzed the citation statistics of individual papers howpopular ; 110PhsRev ; 100citedist ; GooglePageRank ; DiffusionRanking , of individual journals/fields DiffusionRanking ; citationsPNAS ; ScalingJournals ; hindexFields ; BrazilPhysChem ; Jranking ; IFactor , and of subsets of individuals DiffusionRanking ; SoretteStrechedExp ; Hindex ; hindexResearchers . In this paper, we study the cumulative citation statistics of individual scientists over their publication careers within a given journal. Studying the distribution of career accomplishment in a particular journal serves as a proxy for the more difficult task of studying the citation statistics of all individuals in all journals, where such all-encompassing data are not as readily available. Here we adopt the working hypothesis that studying publications in high-impact journals offers crude approximation to an author’s scientific contribution.
We develop a simple method for normalizing citations so that they can be compared across time and discipline. In order to compare across time, we normalize the number of citations for each paper in a given year by the average number of citations to papers from the same publication year. This re-scaling can also aid in removing discipline-specific citation patterns that vary across discipline, especially when considering discipline-specific journals. We further remove discipline-specific collaboration patterns by dividing the achievement equally among the collaboration group members.
This work aims to demonstrate the importance of properly normalizing any conceivable metric that quantifies career achievement (e.g. the citation count, h-index). Extending the work of Radicchi et al. citationsPNAS , which normalizes the citation values of single articles across discipline by re-scaling to local citation averages, our goal is to provide a framework for normalizing the scientific achievement of individual careers. The methodology developed in this paper should conceivably make possible the comparison of careers between various fields. Furthermore, we are able to study the mechanisms of human success in scientific arenas, where effective competition arises from limited financial, temporal, and creative resources.
In addition to studying the distribution of success and productivity, in this paper we also investigate the waiting
time between successive achievements, which is intrinsically related to the underlying mechanism of progress.
Recent work in BB1 ; BB2
demonstrates that the Matthew effect (the “rich–get–richer” effect) can be quantified by analyzing the career
longevity of employees within competitive professions, such as professional sports and academia. Here, we demonstrate
the Matthew effect on the scale of individual authors by analyzing the time intervals between successive publications in
high-impact journals. The Matthew effect MatthewI derives from a passage in the Gospel of Matthew and is a
popular conceptual theory in sociology.
This theory is analogous to several other positive feedback or cumulative advantage theories
cumadvprocess ; huberCum which
have been used to explain the ubiquity of right-skewed distributions that arise in socioeconomic studies. Of particular
note, the generic preferential attachment mechanism is relevant to the dynamics of citations
growingnetworks ; ABPA as well as the dynamics of human sexual networks sexPA .
First, we briefly summarize several results which are relevant to the analysis of success and productivity performed in this paper. A seminal study performed over 50 years ago by W. Shockley ShockleyProductivity studied the rate of productivity measured by the total number of publications and the total number of patents filed at several large research institutions. In this paper, Shockley suggests that normalizing metrics for output (e.g. patents, papers, citations) by the number of individuals could alleviate the discrepancy between disciplines. In this paper, we normalize metrics for output by the number of contributors such that they are weighted “shares”, a procedure recently employed in the calculation of h-index values hindexResearchers .
Laherrère et al. SoretteStrechedExp analyze the top 1120 most-cited physicists over the sixteen-year period 1981-1997, with the result that the distribution of cumulative citation counts among these scientists, without any normalization procedure, is described by a stretched exponential pdf.
Redner howpopular analyzes approximately 800,000 individual papers and found that the pdf of citations per paper follows an approximate inverse-cubic power law. This result is found by analyzing the Zipf plot of the number of citations to a particular paper. Interestingly, we find that this result is maintained even after the normalization procedure developed in this paper. Redner 110PhsRev also analyzes 110 years of citation statistics in Physical Review journals, where he calculates the citation distribution of papers, and finds a log-normal pdf (without normalizing for publication time). In addition to the size and coverage of the Physical Review database, another impressive feature of this study is the analysis of citation dynamics, relating the citation growth rate to the number of contemporaneous citations. Of particular note, Redner finds an approximately linear citation (attachment) rate for citations originating from within Physical Review publications. Also, a recent study Jranking analyzes the citation dynamics in 2,267 journals and finds that the time-dependent average number of citations per paper within each journal approaches a steady state value which can be used as a normalizing factor for comparing journals across discipline. In this paper, we use the time-dependent average number of citations per paper for a particular journal and publication year as the normalizing factor in order to compare articles across time and discipline.
Recently, Hirsch Hindex proposed the h-index to be an unbiased metric to quantify scientific impact. The h-index is calculated using the raw number of citations for each of an author’s papers. Although simple in its definition, the h-index has encountered scrutiny, with the opposition claiming that the definition of the h-index is biased in that it neglects differences in publication patterns between scientific (sub)disciplines. It is further biased in that it neglects variations in the size of collaborations, and hence, the credit associated with a given publication. In Ref. hindexResearchers , Batista et al. normalize the h-index to the number of authors contributing to each paper in order to account for differences in publication styles across discipline. Two additional studies suggest that normalizing by the size of the field can alleviate the differences in research and publication style across disciplines hindexFields ; citationsPNAS , however the relationship between citation trends and field size are not trivial and depend on several factors IFactor . Very recently, an enormous study of twenty-five million papers by Wallace et al. 100citedist implements Tsallis statistics to investigate the distribution of citations for papers spanning the 106-year period 1900-2006. The extensive analysis in 100citedist also discusses the changes in citation trends over time and the “uncited” phenomena.
Our main result is to provide the first study that quantifies the career publication statistics of individual authors while normalizing the publication statistics with respect to 2 factors:
-
(i)
the number of authors credited for a particular publication,
-
(ii)
the time-dependent increase of citation counts.
Specifically, we account for (i) by normalizing citation counts and paper tallies to the number of contributing authors, and (ii) by normalizing citations by the local average number of citations per paper; the local average is computed from the set of papers published in the same journal in the same year. While these two factors have been discussed, to our knowledge, no study has incorporated them both simultaneously.
In order to compare careers that are of similar duration, we use methods described in
huber98 to isolate “completed” careers from our journal data bases, which all span the 50-year period 1958-2008
except for CELL which was created only in 1974. For the subset of careers that meet a completion
criterion, we normalize each individual citation according to factors (i) and (ii).
We then tally the normalized citation shares for each scientist, which serves as one possible metric for career accomplishment.
We also perform the analogous
procedure for paper shares which serves as a metric for career productivity.
The organization of this paper is as follows: in Section II we review the data analyzed, the procedure with which we aggregate the data into publication careers, and the possible systematic errors inherent in our method. In Section III we analyze the distribution of both citation and productivity statistics for three high-impact multidisciplinary journals: Nature, the Proceedings of the National Academy of Science (PNAS), and Science, and also for three less multidisciplinary journals: CELL, the New England Journal of Medicine (NEJM), and Physical Review Letters (PRL). We note that only three of these journals analyzed are discipline specific, and so we rely significantly on the results of hindexFields ; citationsPNAS in justifying the comparison of normalized career metrics across discipline beyond our results for the high-impact journals CELL, the New England Journal of Medicine (NEJM), and Physical Review Letters (PRL).
II Data and Methods
We downloaded journal data in May 2009 from ISI Web of Knowledge WofK . We restrict our analysis to publications termed “Articles,” which excludes reviews, letters to editors, corrigendum, etc. For each journal, we combine all publications into one database. In total, these data represent approximately 350,000 articles and 600,000 scientists (see Table 1).
| Journal | Years | Articles | Authors, N |
|---|---|---|---|
| CELL | 1974-2008 | 53,290 | 31,918 |
| NEJM | 1958-2008 | 17,088 | 66,834 |
| Nature | 1958-2008 | 65,709 | 130,596 |
| PNAS | 1958-2008 | 84,520 | 182,761 |
| PRL | 1958-2008 | 85,316 | 112,660 |
| Science | 1958-2008 | 48,169 | 109,519 |
Our data collection procedure begins with downloading all “articles” for each journal for year from ISI Web of Knowledge. From the set of articles for each particular journal and year, we calculate , the average number of citations per article at the date of data extraction (May 2009). Each article summary includes a field for a contributing author’s name identification, which consists of a last name and first and middle initial authorname . From these fields, we aggregate the career works of individual authors within a particular journal. In this paper we develop normalized metrics for career success and productivity, while in BB2 we compare theory and empirical data for career longevity.
For each author, we combine all his/her articles in a given journal. Specifically, a publication career in this paper refers to the lifetime achievements of a single author within a single journal, and not the lifetime achievements combined among the six journals analyzed. We define as the total number of papers for a given author in a given journal over the 50-year period. In analogy with the traditional citation tally, one can calculate the career success/impact within a given journal by adding together the citations received by the papers,
| (1) |
Furthermore, one can calculate the career productivity of a given author within a specific journal as the total number of papers published within the journal. A main point raised in this paper is to discount the value of citation metrics which do not take into account the time-evolution of citation accumulation.
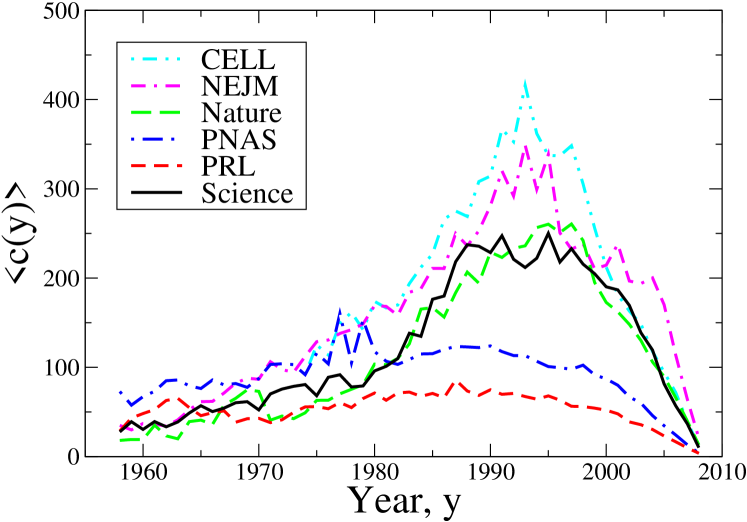
Naturally, some older papers will have more citations than younger papers only because the older papers have been in circulation for a longer time. In Fig. 1 we plot , the average number of citations for articles from a given year, and confirm that the time-dependence of citation accumulation is an important factor. Interestingly, it is found in Jranking that the pdf of citations from papers within a given year and journal is approximately log-normal, where the average value of the distribution has a time-dependent drift. With increasing time, the pdf approaches a steady state distribution which is also approximately log-normal. Hence, the non-monotonicity in suggests that an important factor in the dynamics of citation counts is the growth with time of the scientific body and the scientific output. The mechanism underlying the evolution of citation trends and impact factors is complex, where it is found that citation growth rates decompose into several components in addition to the growth of science IFactor . Another criticism of Eq. (1) is that it does not take into account the variability in number of coauthors, which varies both within and across discipline (see Figure 3).
To remedy these problems, we propose a simple success metric termed citation shares, which normalizes the citations of paper by , the average number of citations for papers in a given journal in year , and divides the quantity into equally distributed shares among the coauthors. Dividing the shares equally will obviously discount the value of the efforts made by greater contributors while raising the value of the efforts made by lesser contributors. Without more accurate reporting schemes on the extent of each authors’ contributions (as is now implemented in e.g. Nature and PNAS), dividing the shares equally is the most reasonable method given the available data. Hence, we calculate the normalized career citation shares as
| (2) |
An analogous estimator for career productivity is , the total number of paper shares within a given journal,
| (3) |
which partitions the credit for each publication into equal shares among the coauthors.
There is another sampling bias that we address. Currently, we assume that all careers are comparable in their duration,
or more precisely, maturity. However, without further consideration, this assumption would ensure that we are comparing
the careers of graduate students with seasoned professors. Hence, we implement a
standard method to isolate “completed” careers from our data set which begins at year
and ends at year , a common method described in huber98 . For each author we calculate , his/her average time between successive publications in a particular journal. A career which begins
with the first recorded publication in year and ends with the final recorded publication in year
is considered “complete” if the following two criteria are met:
and
.
In other words, this method estimates that the career begins in year and ends in year . If either the beginning or ending year do not lie within the range of the data base, then we discount the career as incomplete to first approximation. Statistically, this means that there is a significant probability that this author published before or will publish after . Using this criterion reduces the size of the data set by approximately (compare the raw data set sizes in Table 1 to the data set sizes in Table 2). The results reported in this paper are, unless otherwise stated, based on the analysis of only the subset of “completed” careers. Another justification for this criterion is that we recently implement this method in previous work on career longevity in BB2 , which is more sensitive to using or not using the criterion.
We note some potential sources of systematic error in the use of this database:
-
1.
Degenerate names leads to misleading increases in career totals.
-
2.
Authors using middle initials in some but not all instances of publication decreases career totals.
-
3.
A mid-career change of (last) name decreases career totals.
-
4.
Sampling bias due to finite time period. Recent young careers are biased toward short careers. Long careers located toward the beginning or end of the database are biased toward short careers and hence decrease career totals.
Radicchi et al. DiffusionRanking observe that the method of concatenated author ID leads to a pdf of degeneracy that scales as , which contributes to the systematic error mentioned in item . Although the size of our data set guarantees almost surely that such errors exist (given the prevalence of last names Wang, Lee, Johnson, etc.), these errors should be negligible in the estimation of pdf parameters quantifying a significant portion of the data set.
III Results
III.1 Individual Papers
The growth dynamics of citations vary, ranging from stunted growth to steady growth and, in some cases where research is published ahead of its time, to late blooming growth 110PhsRev . One objective of this paper is to account for the time-dependence of citation counts in a consistent way so that citations can be compared across time. We de-trend citation counts to a time-independent framework by dividing the number of citations a paper has received by the average number of citations for all papers published in the given journal in the same year. In Fig. 1 we plot , the average number of citations per paper, where the average is performed over the full set of papers in each given journal for each year . We note that approaches zero as the year becomes contemporaneous with the data download date, and that the peak value of occurs for papers published approximately years before our data download date in 2009. The presence of this maximum value reflects the growth of the scientific body, the growth of scientific productivity, and the time delay over which ideas become relevant and established. See Ref. Jranking for the average citation profiles of 2,266 journals indexed by ISI. Normalizing to this standard baseline allows one to compare the success of papers across scientific disciplines, first demonstrated in Ref citationsPNAS .
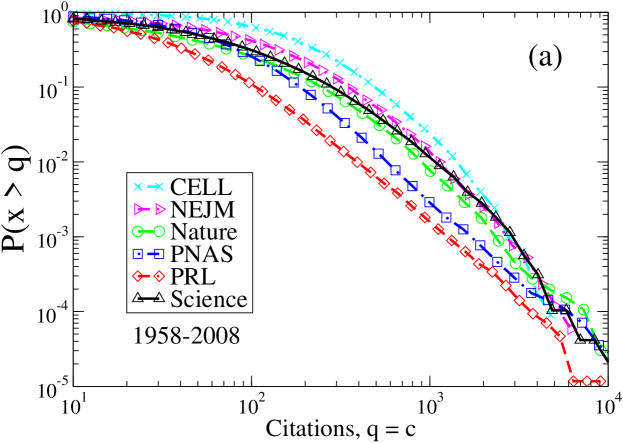
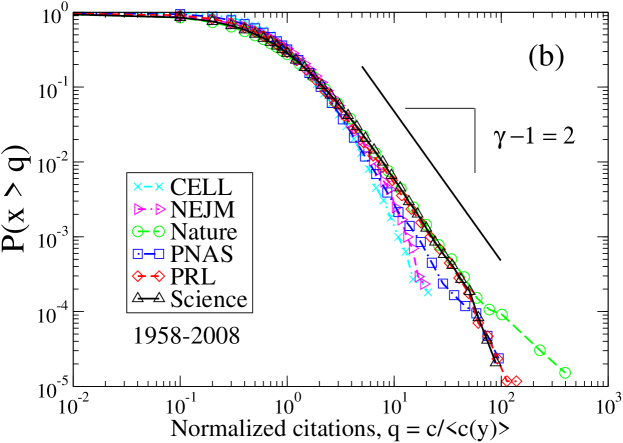
In order to visualize the effects of normalizing citations to a local average in the case of single papers, we compare the un-normalized cumulative distribution functions (cdf) of Fig. 2(A) with the normalized cdf of Fig. 2(B). The procedure of normalizing by the local average reduces the variations across journal (discipline DiffusionRanking ), revealing a universal scaling law with . The scaling exponent describing the success of individual papers was first reported in howpopular , where normalizing techniques were not employed. Surprisingly, we observe the same value of here for the normalized citation statistics of individual papers from several major journals over a 50-year period.
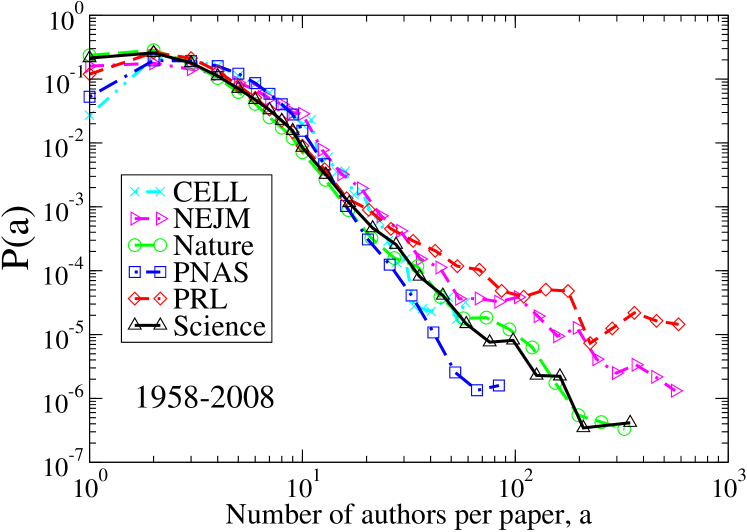
In addition to time-dependent factors, we also consider factors resulting from various research styles across the broad range of scientific disciplines. In science, the resources required to make significant scientific advances range from a pencil and paper to million-dollar laboratory equipment. Similarly, the number of contributors to scientific advances ranges from a single scientist to projects involving several hundred scientists. Fig. 3 illustrates the pdf of collaboration size associated with a single publication. The pdf is significantly right-skewed, especially for publications in NEJM and PRL where occasionally, the number of authors contributing to a single publication exceeds 100 individuals. For instance, in the cases of research at major medical institutes and particle accelerators, it is common for the credit for the scientific advance reported in a publication to be shared by extremely large numbers of contributors. In Eqs. (2) and (3) we choose a simple weighting recipe for associating credit among authors of a single paper . We assign equal credit for all authors. Although this recipe may grant some authors more credit than due, it also credits other authors with less credit than due. We believe this weighting scheme is useful in proportionally sharing the credit for a scientific advancement among the authors. To address this issue, the journals Nature and PNAS require the corresponding author to assign credit to each co-author across a broad range of categories such as theoretical analysis, experimental methods, and writing of the manuscript. If adopted across all journals, this formalism could potentially improve the quantitative allocation of scientific credit, thus improving the quantitative measures for individual scientific impact.
III.2 Citation Shares
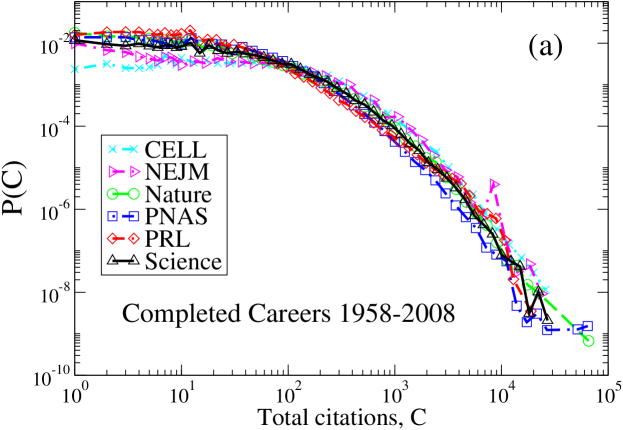
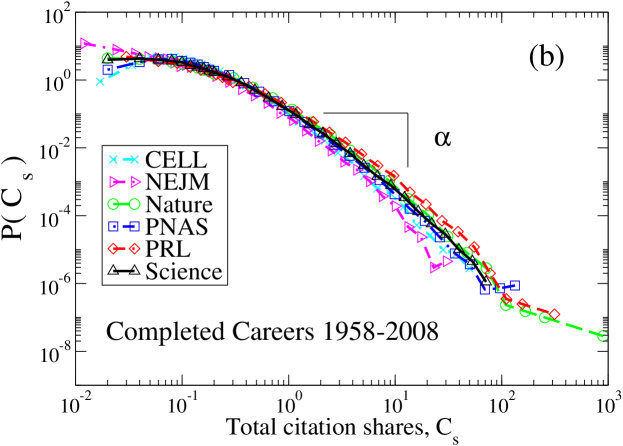
In Figs. 4(A) and 4(B) we present the pdfs of career citations and of career citation shares , corresponding to Eq. (1) and Eq. (2), respectively. While the six pdfs of in Fig. 4(A) are all similarly right-skewed, the collapse onto a universal function is weak for small values of .
The discrepancy between the pdf curves for small and large citation counts in Fig. 4(A) is likely associated with factors associated with the size of the scientific field, the size of the collaboration group and the impact of the research. Since we study only six high-impact journals, these factors should be negligible in the overall difference across discipline and journal, since we assume both discipline and journal are large. Hence, the collapse of the six pdfs for normalized citation shares in Fig. 4(B) demonstrates that normalization is necessary. For each pdf we observe a scaling regime
| (4) |
and we estimate the scaling exponent in the tail of the pdf using the maximum likelihood estimator (MLE), also known as the Hill estimator MEJN ; ClausetPowLaw .
| Journal | ||||
|---|---|---|---|---|
| CELL | 23,060 | 0.34 (0.35) | ||
| NEJM | 49,341 | 0.25 (0.26) | ||
| Nature | 94,221 | 0.46 (0.50) | ||
| PNAS | 118,757 | 0.42 (0.46) | ||
| PRL | 72,102 | 0.61 (0.75) | ||
| Science | 82,181 | 0.43 (0.44) |
We list values calculated for in Table 2. The Hill estimator is a robust method for approximating power-law exponents which incorporates each data observation greater than a cutoff value into the calculation of ,
| (5) |
with standard error,
| (6) |
For each journal, the the number of data points greater than used in the calculation of is approximately of the total data set size . Remarkably, the scaling exponent for citation statistics of completed careers is approximately for all journals analyzed. Hence, we find convincing evidence for a universal scaling function representing the distribution of citation shares for scientific careers in competitive high-impact journals. Interestingly, the values of for each journal are less than the values of which describes the scaling of normalized single article citation counts in Fig. 2. This result implies that the success of individuals over their entire careers is not related in a simple way to the success of a random number of independent articles. Instead, there is a larger number of stellar careers than would be expected from the number of stellar papers.
| CELL | NEJM | PRL | ||||||
|---|---|---|---|---|---|---|---|---|
| Name | Name | Name | ||||||
| GREEN, H | 49.7 | 35 | BRAUNWALD, E | 30.3 | 59 | WEINBERG, S | 313.3 | 49 |
| BALTIMORE, D | 33.8 | 64 | KOCHWESER, J | 23.6 | 28 | ANDERSON, PW | 137.4 | 64 |
| MANIATIS, T | 29.5 | 55 | MCCORD, JM | 20.2 | 1 | WILCZEK, F | 120.0 | 62 |
| SHARP, PA | 25.1 | 41 | FINLAND, M | 17.4 | 36 | TERSOFF, J | 105.1 | 76 |
| TJIAN, R | 23.8 | 45 | HENNEKENS, CH | 16.9 | 36 | HALDANE, FDM | 102.3 | 38 |
| LEDER, P | 22.4 | 39 | REICHLIN, S | 16.7 | 10 | YABLONOVITCH, E | 87.5 | 21 |
| AXEL, R | 20.9 | 52 | VECCHIO, TJ | 14.8 | 1 | PERDEW, JP | 78.3 | 20 |
| WEINTRAUB, H | 20.5 | 46 | STAMPFER, MJ | 14.3 | 45 | LEE, PA | 74.6 | 76 |
| KARIN, M | 18.5 | 40 | TERASAKI, PI | 13.7 | 29 | PENDRY, JB | 74.1 | 29 |
| RUBIN, GM | 18.0 | 52 | OSSERMAN, EF | 13.7 | 6 | PARRINELLO, M | 72.8 | 68 |
| KOZAK, M | 17.1 | 6 | KUNIN, CM | 13.5 | 16 | FISHER, ME | 71.6 | 67 |
| ROEDER, RG” | 15.5 | 44 | YUSUF, S | 13.4 | 18 | CIRAC, JI | 66.7 | 97 |
| RHEINWALD, JG | 14.7 | 7 | ROSEN, FS | 13.2 | 42 | HALPERIN, BI | 66.7 | 50 |
| EVANS, RM | 14.1 | 32 | CHALMERS, TC | 13.1 | 30 | RANDALL, L | 63.4 | 14 |
| OFARRELL, PH | 13.9 | 14 | AUSTEN, KF | 12.9 | 30 | BURKE, K | 63.2 | 18 |
| GLUZMAN, Y | 13.3 | 2 | WELLER, TH | 12.7 | 7 | JOHN, S | 62.8 | 20 |
| HUNTER, T | 13.2 | 27 | GARDNER, FH | 12.6 | 19 | GEORGI, H | 61.9 | 26 |
| GOLDSTEIN, JL | 13.0 | 36 | DIAMOND, LK | 12.6 | 18 | CAR, R | 59.8 | 51 |
| PENMAN, S | 12.9 | 30 | FEINSTEIN, AR | 12.2 | 16 | GLASHOW, SL | 59.6 | 37 |
| BROWN, MS | 12.8 | 35 | MERRILL, JP | 11.9 | 25 | CEPERLEY, DM | 58.9 | 39 |
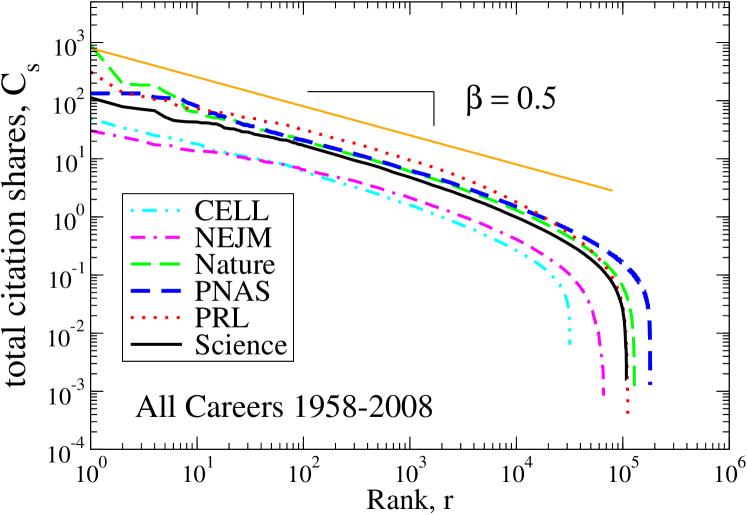
Another illustrative method for comparing the distribution of success across the entire range of individuals is the popular Zipf plot, which is mathematically related to the pdf howpopular ; BrazilPhysChem . In Fig. 5 we plot versus rank for the same set of completed careers analyzed in Fig. 4(B). The Zipf plot emphasizes the scaling in the tail of the pdf, which are represented by high rank values. We calculate the scaling exponent of the Zipf plot for rank values in the range for each journal, where corresponds to the number of data points incorporated into the calculation of using Hill’s MLE. These values are in approximate agreement with the expected relationship .
The small range of values across journals (see Table 2) demonstrates that our normalization procedure places scientific accomplishments on a comparable footing across both time and discipline. In Table 3 we list the top 20 publication careers according to citation shares. This table consists mostly of careers that have many papers of significant impact; however, it also contains a few careers that are distinguished by a small number of seminal papers. Hence, while longevity at the upper tier of science is good at assuring reputation and success, there are also a few instances of success achieved via a singular yet monumental accomplishment.
III.3 Paper Shares
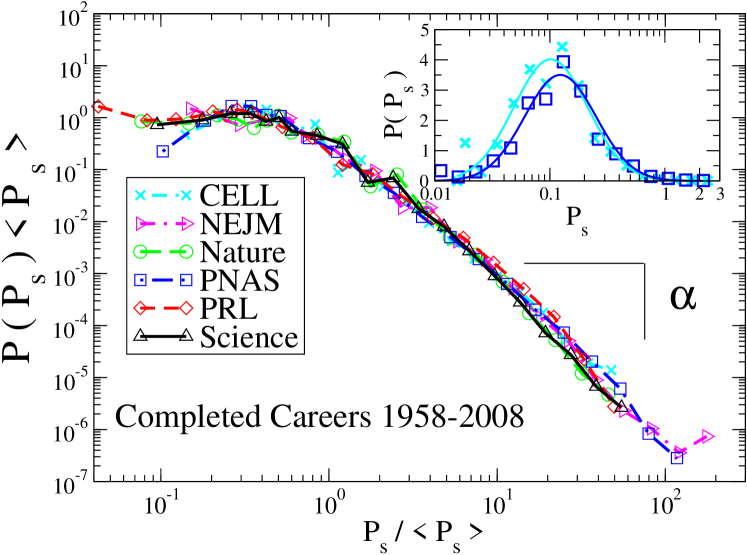
We now focus on scientific productivity, quantified by the number of papers published by a given author. In Fig. 6 we plot the pdfs for paper shares defined in Eq.(3). In order to collapse the pdfs for the six journals analyzed, we hypothesize that a universal function for productivity can be written as . In an effort to compare the pdfs across discipline, we approximate the generic pdf of paper shares by a log-normal distribution with a heavy tail after a cutoff value . Quantitatively, we represent the general form of the pdf as,
| (7) |
The least-square parameters for the log-normal fit and the MLE parameter for the scaling regime are listed in Table 4. The log-normal distribution is consistent with the prediction by Shockley ShockleyProductivity that productivity (as estimated here by paper shares) is a result of a series of multiplicative factors, which can lead to log-normal MultiplicativeI , stretched exponential MultiplicativeII , and even power-law ReedH distributions, given the appropriate set of systematic conditions.
| Journal | |||
|---|---|---|---|
| CELL | |||
| NEJM | |||
| Nature | |||
| PNAS | |||
| PRL | |||
| Science |
III.4 Matthew Effect
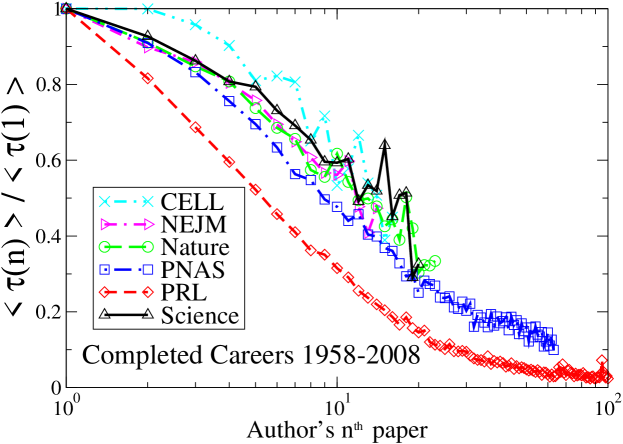
We conclude this section with quantitative evidence of the “Matthew effect” in the advancement of scientific careers. In Fig. 7 we plot the average waiting time between publications for all authors that meet the complete career criterion by averaging the difference in publication year for the paper and the paper . The values of for each journal are (CELL, PRL), (Nature, PNAS, Science) and (NEJM) years. The decrease in waiting time between publications is a signature of the cumulative advantage mechanism qualitatively described in huberCum and quantitatively analyzed in cumadvprocess ; BB2 . To avoid presenting statistical fluctuations arising from the small size of data sets, we only present computed for data sets exceeding observations.
To explain the steady decline of the curve for PRL we mention that PRL has many authors with many articles (). A possible explanation is that a significant number of these authors are involved in large particle accelerator experiments with multiple collaborating groups. These multilateral projects contribute significantly to the heavy tail observed in the pdf of the number of authors per paper (Fig. 3). Hence, the decay in the curve for PRL which approaches zero might be due to the project leaders at large experimental institutions which produce over many years many significant results per year. Furthermore, the organization of the curves in Fig. 7 suggests that it is more difficult at the beginning of a career to repeatedly publish in CELL than PRL. Reaching a crossover point along the career ladder is a generic phenomenon observed in many professions. Accordingly, surmounting this abstract crossover is motivated by significant personal incentives, such as salary increase, job security, and managerial responsibility.
IV Discussion
Scientific careers share many qualities with other competitive careers, such as the careers of professional sports players, inventors, entertainers, actors, and musicians BB1 ; Hollywood ; musicians . Limited resources such as employment, salary, creativity, equipment, events, data samples, and even individual lifetime contribute to the formation of generic arenas for competition. Hence, of interest here is the distribution of success and productivity in high impact journals which in principle have high standards of excellence.
In science, there are unwritten guides to success requiring ingenuity, longevity, and publication. We observe a quantifiable statistical regularity describing publication careers of individual scientists across both time and discipline. Interestingly, we find that the scaling exponent for individual papers () is larger than the scaling exponent for total citation shares () and the scaling exponent for total paper shares (), which indicates that there is a higher frequency of stellar careers than stellar papers. This is consistent with the observation that a stellar career can result from an arbitrary combination of stellar papers and consistent success, as demonstrated in Table 3. In all, the statistical regularity found in the distributions for both citation shares and paper shares lend naturally to methods based on extreme statistics in order to distinguishing stellar careers. Such methods have been developed for Hall of Fame candidacy in baseball BB2 ; BB3 , where statistical benchmarks are established using the distribution of success.
Statistical physicists have long been interested in complex interacting systems, and are beginning to succeed in describing social dynamics using models that were developed in the context of concrete physical systems SocialDynamics . This study is inspired by the long term goal of using quantitative methods from statistical physics to answer traditional questions rooted in social science CompSocScience , such as the nature of competition, success, productivity, and the universal features of human activity. Many studies begin as empirical descriptions, such as the studies of common mobility patterns mobility , sexualitysexpowlaw ; internetdating , and financial fluctuations Mantegna , and lead to a better understanding of the underlying mechanics. It is possible that the empirical laws reported here will motivate useful descriptive theories of success and productivity in competitive environments.
ACKNOWLEDGMENTS
We thank S. Miyazima and S. Redner for helpful comments and the NSF for financial support.
References
- (1) Redner S (1998) How popular is your paper? An emprical study of the citation distribution. Eur. Phys J. B 4: 131-134.
- (2) Redner S (2005) Citation Statistics from 110 Years of Physical Review. Physics Today 58: 49-54.
- (3) Maslov S, Redner S (2008) Promise and Pitfalls of Extending Google’s PageRank Algorithm to Citation Networks. Journal of Neuroscience 28: 11103-11106.
- (4) Wallace ML, Lariviére V, Gingras Y (2009) Modeling a century of citation distributions. Journal of Infometrics 3: 296-303.
- (5) Radicchi F, Fortunato S, Markines B, Vespignani A (2009) Diffusion of scientific credits and the ranking of scientists. Phys. Rev. E 80, 056103 (2009).
- (6) Picoli Jr. S, Mendes RS, Malacarne LC, Lenzi EK (2006) Scaling behavior in the dynamics of citations to scientific journals. Europhysics Letters 75: 673-679.
- (7) Iglesias JE, Pecharromán C (2007) Scaling the h-index for different scientific ISI fields. Scientometrics 73: 303-320.
- (8) Radicchi F, Fortunato S & Castellano C (2008) Universality of citation distributions: Toward an objective measure of scientific impact. PNAS 105: 17268.
- (9) Gupta HM, Campanha JR, Pesce RAG (2005) Power-Law Distributions for the Citation Index of Scientific Publications and Scientists. Brazilian Journal of Physics 35: 981-985.
- (10) M.J. Stringer, M. Sales-Pardo and L.A.N. Amaral, Effectiveness of Journal Ranking Schemes as a Tool ofr Locating Information. PLoS ONE 3, e1683 (2008).
- (11) B.M. Althouseet al., Differences in impact factor across fields and over time, Journal of the American Society for Information Science and Technology 60, 27 (2009).
- (12) Laherrère J, Sornette D (1998) Stretched exponential dsitributions in nature and economy: “fat tails” with characteristic sclaes. Eur. Phys. J. B 2: 525-539.
- (13) Hirsch JE (2005) An Index to Quantify an Individual’s Scientific Research Output. PNAS 102: 16569-16572.
- (14) Batista PD, Campiteli MG, Martinez AS (2006) Is it possible to compare researchers with different scientific interests? Scientometrics 68: 179-189.
- (15) Petersen AM, Jung W-S & Stanley HE (2008) On the distribution of career longevity and the evolution of home-run prowess in professional baseball. Europhysics Letters 83, 50010.
- (16) Petersen AM, Jung W-S, Yang J-S, & Stanley HE (2009) Quantitative and empirical demonstration of the Matthew effect in a study of career longevity. Submitted. e-print arXiv:0806.1224.
- (17) Merton RK (1968) The Matthew effect in Science. Science 159: 56 -63.
- (18) De Solla Price D (1976) A general theory of bibliometric and other cumulative advantage processes. Journal of the American Society for Information Science 27: 292-306.
- (19) Huber JC (1998) Cumulative Advantage and Success-Breeds-Success: The Value of Time Pattern Analysis. Journal of the American Society for Information Science 49: 471 476.
- (20) Albert R, Barabàsi AL(2002). Statistical mechanics of complex networks. Reviews of Modern Physics 74: 47 97.
- (21) Krapivsky PL, Redner S (2001) Organization of Growing Random Networks. Phys. Rev. E 63: 066123.
- (22) Freiesleben de Blasio B, Svensson A, Liljeros F (2007) Preferential attachment in sexual networks. PNAS 104: 10762-10767.
- (23) Shockley W (1957) On the statistics of individual variations of productivity in research laboratories. Proceedings of the IRE 45: 279-190.
- (24) Huber JC (1998) Inventive Productivity and the Statistics of Exceedances. Scientometrics 45: 33.
- (25) ISI Web of Knowledge: www.isiknowledge.com/
- (26) In the ISI database, the author name John M. Doe would be stored as “Doe, J” or “Doe, JM” depending on the author’s designation.
- (27) Newman MEJ (2005) Power laws, Pareto distributions and Zipf’s law. Contemporary Physics 46: 323.
- (28) Clauset A, Shalizi CR & Newman MEJ (2009). Power-law distributions in empirical data. SIAM Review 51, 661 (2009).
- (29) Redner S (1989) Random multiplicative processes: An elementary tutorial. Am. J. Phys. 58: 267-271.
- (30) Sornette D. (1998) Multiplicative processes and power laws. Phys. Rev. E 57: 4811-4813.
- (31) Reed WJ, Hughes BD (2002) From gene families and genera to incomes and internet file sizes: Why power laws are so common in nature. Phys. Rev. E 66: 067103.
- (32) Sinha S, Raghavendra S (2004) Holywood blockbusters and long-tailed distributions. Eur. Phys. J. B 42: 293-296.
- (33) Davies JA (2002) The individual success of musicians, like that of physicists, follows a stretched exponential distribution. Eur. Phys. J. B 27: 445-447.
- (34) A.M. Petersen, O. Penner, H.E. Stanley, Detrending career statistics in professional Baseball: accounting for the Steroids Era and beyond. e-print arXiv:1003.0134.
- (35) Castellano C, Fortunato S & Loreto V (2009) Statistical physics of social dynamics. Rev. Mod. Phys. 81: 591.
- (36) Lazer D, et al. (2009) Computational Social Science. Science 323: 721-723.
- (37) González MC, Hidalgo CA & Barabási AL (2008) Understanding individual human mobility patterns. Nature 453, 779.
- (38) Liljeros, F., et al. The web of human sexual contacts. Nature 411, 907 (2001).
- (39) Holme P, Edling CR, Liljeros F (2004) Structure and time evolution of an Internet dating community. Social Networks 26: 155 174.
- (40) Mantegna RN, Stanley HE (1999) An Introduction to Econophysics: Correlations and Complexity in Finance (Cambridge University Press, UK).