Revisiting the fossil group candidates UGC 842 and NGC 6034
Abstract
We present a new insight on NGC 6034 and UGC 842, two groups of galaxies previously reported in the literature as being fossil groups. The study is based on optical photometry and spectroscopy obtained with the CTIO Blanco telescope and Sloan Digital Sky Survey archival data. We find that NGC 6034 is embedded in a large structure, dominated by three rich clusters and other small groups. Its first and next four ranked galaxies have magnitude differences in the band and projected distances which violate the optical criteria to classify it as a fossil group. We confirm that the UGC 842 group is a fossil group, but with about half the velocity dispersion that is reported in previous works. The velocity distribution of its galaxies reveals the existence of two structures in its line of sight, one with 223 km s-1 and another with 235 km s-1, with a difference in velocity of 820 km s-1. The main structure is dominated by passive galaxies, while these represent 60% of the second structure. The X-ray temperature for the intragroup medium of a group with such a velocity dispersion is expected to be 0.5–1 keV, against the observed value of 1.9 keV reported in the literature. This result makes UGC 842 a special case among fossil groups because (1) it represents more likely the interaction between two small groups, which warms the intragroup medium and/or (2) it could constitute evidence that member galaxies lost energy in the process of spiraling toward the group center, and decreased the velocity dispersion of the system. As far as we know, UGC 842 is the first low-mass fossil group studied in detail.
1 Introduction
Fossil groups are galaxy systems optically dominated by an elliptical galaxy immersed in an extended and luminous X-ray halo (LX,bol 1042 erg s-1), in which the magnitude gap between the two brightest galaxies within half of the virial radius is greater than 2 in the band (Ponman et al., 1994). The scarcity of L∗ galaxies and the evidence for the existence of a “massive” structure traced by the hot intragroup gas support the hypothesis of their central galaxies being formed by merging of luminous galaxies, most likely by dynamical friction (Cypriano et al., 2006; Mendes de Oliveira et al., 2006, 2009).
The estimated time scales for dynamical friction and results of numerical simulations are consistent with an old age for fossil groups. For example, -body/hydrodynamical simulations carried out by D’Onghia et al. (2005) suggest a correlation between the magnitude gap between the two brightest galaxies and the formation time of the group. More recently several studies of simulated fossil groups were made using the Millennium simulations (Dariush et al., 2007; Sales et al., 2007; Díaz-Giménez et al., 2008) which corroborated the idea that fossil groups/clusters assembled most of their masses much earlier than non-fossil systems. These studies also predicted a fraction of 3%–13% of groups with masses greater than 1013 M⊙ being fossil groups, depending on the exact range of masses considered.
The true nature of fossil groups has promoted a lively debate in the past decade. The absence of a conclusive explanation for the nature of these objects is mainly due to (1) the lack of a proper sample for statistical studies, (2) the lack of X-ray data with sufficient resolution and signal-to-noise (S/N) for a proper study of the group properties, and (3) the lack of optical spectroscopy of the group members, for membership confirmation and a study of the kinematic properties of the known groups. A growing number of fossil group candidates has been claimed in the recent literature. For example, Santos et al. (2007) identified 34 potential candidate fossil groups in a systematic search carried out using the Sloan Digital Sky Survey (SDSS). More recently, La Barbera et al. (2009) identified 25 other fossil groups. However, the nature of these newly identified groups still need to be confirmed. We investigate here two groups pointed in the literature as being fossil groups: UGC 842 and NGC 6034 (Voevodkin et al., 2008; Yoshioka et al., 2004).
UGC 842 is a bright elliptical galaxy with a heliocentric radial velocity of 13,55632 km s-1 (Huchra et al., 1999). It is a weak radio source detected by the Very Large Array (VLA) telescope with flux level of S(6 cm) 1.1 mJy (Gioia et al., 1983). The UGC 842 group is immersed in an extended halo with a radius of 4’ in the sky, which corresponds to 300 kpc at its redshift. Gastaldello et al. (2007) reported an X-ray observation of UGC 842 system carried out by the Chandra satellite. They derived a virial radius and mass of 1272220 kpc and 12.81013 , and and of 63485 kpc and 7.543.411013 , respectively. About 1 year later, Voevodkin et al. (2008) reported a combined optical and X-ray analysis of this group from SDSS and XMM-Newton data. According to these authors, galaxies in the UGC 842 group have 439 km s-1 (from 16 galaxies inside = 509 kpc), its intragroup gas has a temperature of 1.900.30 keV and metallicity of 0.340.12 Z⊙, and displays a bolometric X-ray luminosity of 1.631043 erg s-1. From the XMM-Newton data, Voevodkin et al. (2008) also inferred 509 kpc, Mgas,500 = (3.51.1)1012 M⊙, and Mtotal,500 = (4.030.69)1013 M⊙. The UGC 842 group is classified as a fossil group by these authors.
| Group | Central Galaxy | Radial Velocity | 1st-ranked -mag | 1st-ranked -mag |
|---|---|---|---|---|
| (CTIO-Hydra) | (SDSS) | (SDSS) | ||
| UGC 842 | J011853.62–010007.2 | 1342840 km s-1 | 13.47 | -23.19 |
| NGC 6034 | J160332.08+171155.2 | 1016248 km s-1 | 13.54 | -22.49 |
NGC 6034 is a bright E/S0 radio galaxy member of Abell 2151 and immersed in the Hercules supercluster (Corwin, 1971; Valentijn & Perola, 1978), with a heliocentric radial velocity of 10,112 km s-1 (Tarenghi et al., 1979). VLA observations at 21-cm (H I) reported by Dickey (1997) show that NGC 6034 has a head-tail morphology in the continuum, with two jets, and evidence of gas falling toward the nucleus with a velocity of about 70 km s-1 as derived from the detection of shifted narrow absorption line at 10,22615 km s-1. An X-ray observation of the NGC 6034 group with the Einstein Observatory shows that 1.31042 erg s-1 (Canizares et al., 1987). ASCA observation (1999 August 24) reveals that this group has a relatively cold intragroup medium with = 0.670.09 keV and abundance = 0.080.05 , affected by a photoelectric absorption equivalent to 3.41020 cm-2, and displaying a bolometric X-ray luminosity of about 2.81043 erg s-1 (Fukazawa et al., 2004). Curiously, also from ASCA observation, Yoshioka et al. (2004) derived = 1.29(+0.48/-0.36) keV, = 0.11(+0.39/-0.10) , 3.41020 cm-2, and 7.51041 erg s-1. The main properties of the UGC 842 and NGC 6034 groups are described in Table 1.
We report on new optical photometry and spectroscopy of the groups UGC 842 and NGC 6034 (hereafter UGC 842 and NGC 6034, for simplicity) and their “neighborhoods”, carried out at the CTIO-Blanco 4.0 m telescope, which are combined with data from the SDSS Data Release 6 (DR6; Adelman-McCarthy et al., 2008). These data are used here to perform an analysis of the structure and kinematics of these two systems and also allowed an investigation about the nature of the systems as fossil groups (confirmed in the case of UGC 842 and not confirmed for NGC 6034). When needed, we adopt a lambda cold dark matter (CDM) cosmology with = 70 km s-1 Mpc-1, = 0.3, and = 0.7.
2 Observations: Photometry and Spectroscopy
Images in the and bands of UGC 842 and NGC 6034 were obtained at the CTIO-Blanco 4.0 m telescope on 2005 August 25. The images were taken with the mosaic camera, covering a region (after trimming of the edges) of approximately 3838 arcmin2 (equivalent to about 22 Mpc2 and 1.51.5 Mpc2 at the redshift of each of these groups, respectively).
A total of five mosaic images were obtained for UGC 842, in the band, with exposure times of 600 s each, and other five images of 360 s each in the band, with a seeing of about 1 arcsec in the band and 1.1 arcsec in the band. For NGC 6034, only one image was taken for each filter, with exposures times of 200 s and seeing of 1.6 arcsec in the band and 2.1 arcsec in the band.
The galaxies in the area around NGC 6034 and UGC 842 were observed spectroscopically on 2006 August 13 UT with the Hydra-CTIO multi-object spectrograph (Barden & Ingerson, 1998) at the CTIO Blanco 4 m telescope in Chile. NGC 6034 was also observed on 2007 April 14, with the same equipment. The observations were performed during dark/gray times with a good atmospheric transparency in 2007 April, and under bright sky with some cirrus in 2006 August, in both epochs with a seeing that on average varied between 0.9” and 1.2” (DIMM monitor). The observation of UGC 842 had in general poor S/N due to the proximity of the Moon in the field – we were able to extract only 20 out of a total of 84 spectra observed.
The spectra were acquired using two different setups. For the data taken on 2006 August, we used the KPGL3 grating over the wavelength range 3960–6960 Å, centered on 5278 Å, which provided a spectral resolution of 4 Å, and a dispersion of 1.39 Å pixel-1. In 2007 April, we used the KPGL2 grating over the wavelength range 3450–8242 Å, centered on 5845 Å, which provided a spectral resolution of 6.5 Å, and dispersion of 2.33 Å pixel-1. To avoid second order contamination above 8000 Å, the blocking filter GG385 was used. All spectra were imaged with the 400 nm Bench Schmidt camera onto a SITe 2k4k CCD, with a binning of 2 pixels in the spectral direction. Total exposure times of 2 hr (430 minutes) and 1.5 hr (330 minutes) were used for the objects observed in 2006 August and 2007 April, respectively.
2.1 Data Reduction and Analysis
2.1.1 Photometry
The images were processed using standard reduction techniques within IRAF111 IRAF is distributed by the National Optical Astronomy Observatories, which are operated by the Association of Universities for Research in Astronomy, Inc., under cooperative agreement with the National Science Foundation.. After correcting them by bias and flat field, we derived positions and magnitudes for all identified objects using Sextractor. Flux calibration was performed using magnitudes of common stars in the field with the SDSS database, given that our nights were not photometric. The probable galaxies were identified based on the class_star parameter (less than 0.7). From the number counts of galaxies in the whole field we estimate that the photometry is complete down to about 21.5 mag in the band for UGC 842 and NGC 6034.
2.1.2 Spectroscopy
The spectroscopic data were reduced using standard procedures in IRAF. In summary, all science exposures, comparison lamps (He/Ne/Ar), spectroscopic flats (taken before or after each object spectrum) and the so-called “milk flats”222Milk flats are calibrations obtained once per run, during the afternoon, by opening the dome and placing a dispersing filter in front of the row of fibers, in the spectrograph. were bias/overscan subtracted and trimmed using the IRAF task CCDPROC. The “milk flats” were then combined and spectral shapes in - and -direction were removed using the IRAF task FIT1D. The resultant image was then filtered by using a median filter and normalized to one. The science exposures and spectroscopic flats were then divided by the processed “milk flats” in order to reduce spectral noise in the images.
The spectra were extracted with the IRAF DOHYDRA task. Dome flats were used to flat field the individual fibers, while twilight flats were used for fiber-to-fiber throughput correction. The spectra were then wavelength calibrated. The residual values in the wavelength solution for 20–30 points using a 4th or 5th-order Chebyshev polynomial typically yielded values of 0.20–0.30 Å. Finally, the average sky spectrum was subtracted from each object spectrum using typically 12 sky fiber spectra per field. The final one-dimensional object spectra were then combined by their average value.
2.1.3 Radial velocities
In order to measure radial velocities we first inspected the spectra to search for obvious absorption and emission features characteristic of early- and late-type galaxy populations. For galaxies with clear emission lines, the IRAF task RVIDLINE was used employing a line-by-line Gaussian fit to measure the radial velocity (this was done for only one galaxy belonging to UGC 842 and 11 galaxies in NGC 6034). The residuals of the average velocity shifts of all measurements were used to estimate the errors. The velocities for absorption-line and for emission-line systems with clear absorption lines (6 out of 11 galaxies belonging to NGC 6034), were calculated using the cross-correlation technique (Tonry & Davis, 1979). The spectra were cross-correlated with high S/N templates using the task FXCOR inside IRAF. The detected narrow cross-correlation peaks were fitted by a Gaussian, with errors given by the -statistic in which = (3/8)(/(1 + )) (Tonry & Davis, 1979), where is the FWHM of the correlation peak and is the ratio of the correlation peak height to the amplitude of the antisymmetric noise. This value was used as a reliability factor of the quality of the measured velocity. For 3.5, the resulting velocity was that associated to the template which produced the lowest error. For galaxies with 3.5, we looked for absorption features like Ca II and band in the spectra, and performed a line-by-line Gaussian fit using the package RVIDLINE. The resulting values were then compared with the velocities given by cross-correlation. In all cases the agreement between the two procedures was good. The measured velocities are shown in Tables 3 and 4 (see Section 3.4) for galaxies in the field of UGC 842 and NGC 6034, respectively.
2.2 The SDSS catalog
We used the SDSS DR6 to search for galaxies in the region around NGC 6034 and UGC 842 with three objectives: (1) to find missing galaxies that were not observed spectroscopically in our observations in the CTIO; (2) to study the environment in a large area around the groups and to minimize the contamination produced by other nearby structures in our analysis (in Section 3.1); and (3) to find any systematic differences that may exist between SDSS and our data.
From the SDSS DR6 archival we obtain magnitudes and spectroscopic redshifts of all objects classified as galaxies (class 3 in the SDSS) with ’-magnitude 21 in a 33 deg2 area around NGC 6034 and in a 2.31.7 deg2 area around UGC 842. The SDSS DR6 catalog in the field of UGC 842 ends at declination -1.25 deg (J2000), and for this reason the analysis performed on SDSS data in this work does not reflect a symmetric field around UGC 842. However, our results are not affected by such limitation. The galaxy counts calculated using the objects classified as galaxies reach their maximum at ’ 21 mag. Using this estimate value for the completeness limit and the usual uncertainties in the galaxy classification above ’ 20 mag, we have adopted this latter value as a conservative upper limit for the magnitude. This catalog was then used for the subsequent analysis.
3 Analysis and Results
3.1 The environment around NGC 6034 and UGC 842
We used the entire SDSS DR 6 galaxy catalog described in Section 2.2 to inspect the environment around UGC 842 and NGC 6034. In addition, we used the NASA/IPAC Extragalactic Database (NED) to search for known groups and clusters of galaxies that could be present in the regions of UGC 842 and NGC 6034.
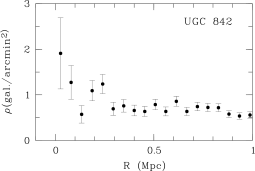
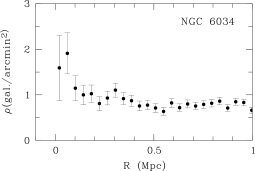
The positions of all SDSS objects photometrically classified as galaxies in the fields of UGC 842 and NGC 6034 were used to plot the density of objects () as a function of distance to the brightest galaxy in each group. These are shown in Figure 1. As can be noticed, over densities of galaxies are present within circles of projected radii of about 400 kpc from the centers of UGC 842 and NGC 6034 (7.4 and 9.8 arcmin, respectively).
3.1.1 UGC 842
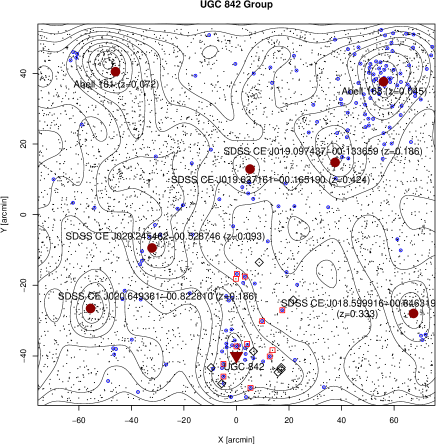
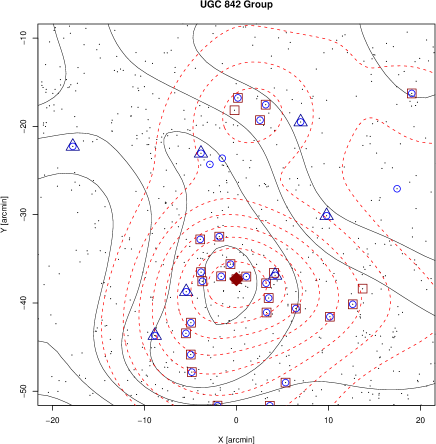
Figure 2 shows the projected galaxy-density map for the field of UGC 842. It is clear that the UGC 842 group is well isolated (at least to the north), with no major or massive galaxy clusters at the same redshift. There are two galaxy clusters that lie closer in redshift but far in projected distance to the group: Abell 181 at = 0.072 and Abell 168 at = 0.045. Both clusters are located more than 2 deg ( 6.4 Mpc at = 0.045) north from UGC 842. Other major structures are also indicated in the figure, but they all are background clusters. Figure 2 (right panel) shows a zoom of arcmin2 around the UGC 842 group. The meaning of the symbols are the same as in the previous (left panel) figure except that we divided the sample of member galaxies in passive (squares) and blue, star forming (triangles). The selection of the two samples was performed using the SDSS Database by inspecting visually each spectrum.
3.1.2 NGC 6034
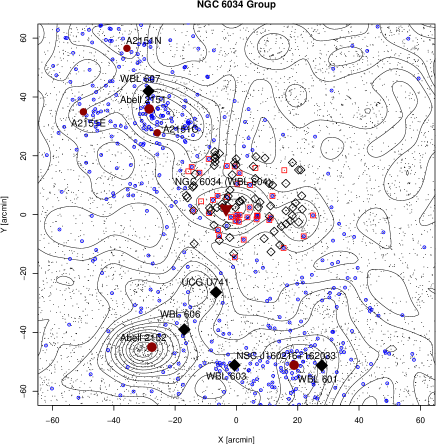
It became clear from our analysis that NGC 6034 is located in a much richer neighborhood than UGC 842. Figure 3 (on the left panel) shows the projected galaxy-density map of all galaxies with ’ 20 mag inside an area of 33 deg2, centered around NGC 6034. In this figure one can see that the group is embedded in a region dominated by three major, rich, galaxy clusters: Abell 2151 (Hercules), Abell 2152, and NSC J160216+162033 (big filled circles in the figure). Several galaxy groups are also present in the area: WBL 601, WBL 603, WBL 606, WBL 607, and USGC U741 (big filled diamonds in the figure). Table 2 summarizes the main parameters of the groups and clusters in the region. Note also that the structure named NGC 6034 group is not listed in NED and its position corresponds to the position of the group WBL 604.
| Group/Cluster Names | Type | R.A.(2000) | Decl.(2000) | Velocity | Velocity Reference |
|---|---|---|---|---|---|
| (km s-1) | |||||
| Abell 2151 | Cluster | 16:05:25.9 | 17:47:50 | 11070 | Bird et al. (1995) |
| Abell 2151E | Cluster | 16:06:51.9 | 17:46:51 | 9623 | Ebeling et al. (1998) |
| Abell 2151C | Cluster | 16:05:15.5 | 17:39:45 | 10650 | Bird et al. (1995) |
| Abell 2151N | Cluster | 16:05:55.0 | 18:08:27 | 11445 | Bird et al. (1995) |
| Abell 2152 | Cluster | 16:05:22.4 | 16:26:55 | 12291 | Struble & Rood (1999) |
| NSC J160216+162033 | Cluster | 16:02:16.9 | 16:20:32 | 11422 | Gal et al. (2003) |
| WBL 601 | Group | 16:01:40.7 | 16:20:41 | 10637 | White et al. (1999) |
| WBL 603 | Group | 16:03:34.6 | 16:20:48 | 11212 | White et al. (1999) |
| WBL 606 | Group | 16:04:40.4 | 16:32:52 | 9539 | White et al. (1999) |
| WBL 607 | Group | 16:05:26.8 | 17:53:55 | 10936 | White et al. (1999) |
| UCG U741 | Group | 16:03:58.8 | 16:45:33 | 10821 | Ramella et al. (2000) |
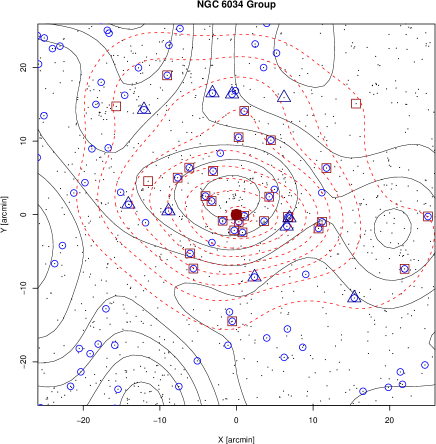
In order to investigate how many galaxy groups belong to the large structure in which NGC 6034 seems to be embedded we show in Figure 3 (on the right side) a zoom of the 4040 arcmin2 field around this group. From the figure it is clear that a number of galaxies with velocities in the interval 9,000 and 12,000 km s-1 may in fact belong to other nearby structures. The (red) dashed contours in the figure represent the projected density of galaxies at the distance of the group. We can see that the peak of the distribution is offset by 3’–4’ from the high density peak given by the projected density map obtained using all galaxies with ’ 20 mag. The reason of this displacement is due to the existence of two massive structures along the line of sight at 0.11 and 0.14 (see Figure 7, left).
3.2 Color-Magnitude Diagrams
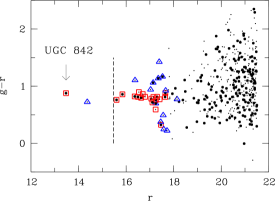
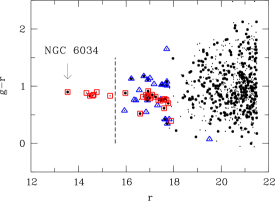
A red-sequence of galaxies is clearly seen in the color-magnitude diagram (CMD) of both groups (Figure 4). Group membership is confirmed by spectroscopy for all galaxies with 17.7 mag inside 500 kpc around UGC 842 and NGC 6034, with two exceptions for NGC 6034.
The UGC 842 group obeys the optical criteria to be classified as a fossil group, in which the brightest galaxy dominates the group within Rvir/2. The two closest “bright” galaxies are yet relatively far from UGC 842 (J011913.49-010839.9: 528 kpc, = 14.58 mag; and J011832.25-011150.4: 688 kpc, = 14.66 mag). The same is not true for the NGC 6034 group. Six galaxies in the field of NGC 6034, shown in Figure 4, violate the magnitude criteria adopted to classify a group as a fossil group within Rvir/2 (see parameters in Table 5). One of them, J160348.24+171426.2, has a 0.9 mag, 188 kpc, and 800 km s-1, with respect to the brightest galaxy. It is not completely clear if this galaxy, with such a relatively high is or is not a group member – note that for this group is 230 km s-1. The other five identified members which also break the fossil group definition have 300 kpc 460 kpc, and V 240 km s-1. They are: J160402.75+171656.6, J160419.55+171049.4, J160249.22+171002.6, J160314.11+172202.4, and J160356.65+171818.4.
3.3 SDSS DR6 Versus CTIO Observations
From the initial SDSS catalog described in Section 2.2, we concentrated on all galaxies inside a region of radius 25’ around UGC 842 and NGC 6034 (the region covered by our Hydra-CTIO observations) and with velocities between 9,000 km s-1 and 60,000 km s-1. In this velocity interval, we have 55 and 9 galaxies that were observed in common with SDSS DR6 and our observations in the area of UGC 842 and NGC 6034, respectively. We used this information to search for any possible systematic effects and to estimate the true errors in our measurements. Figure 5 shows the residuals of the velocities (our velocities, VH, minus velocities from the SDSS catalog, VS) as a function of the quadratic errors ( and S) for the 64 galaxies in common with the SDSS DR6 data set. The average difference between the two data sets is 35 km s-1 with and of 63 km s-1. Thus, in order to minimize the errors in the determination of the average velocity and the velocity dispersion, we applied this small velocity correction to all galaxies in the SDSS DR6 catalog.

For NGC 6034, we selected all galaxies with radial velocities in the interval 9,000–12,000 km s-1. A total of 35 galaxies are in common with the SDSS DR6. For five of the galaxies observed with Hydra-CTIO, the velocities were obtained for the first time. In addition, there are six galaxies listed in the SDSS DR6 and inside the above interval that were not observed by us. In total, we have 46 galaxies in the area of NGC 6034 and within the inverval of radial velocities of 9,000 to 12,000 km s-1.
For UGC 842, we selected all galaxies with radial velocities in the interval 10,000–17,000 km s-1. A total of nine galaxies are in common with the SDSS DR6. For three of the galaxies observed with Hydra-CTIO, the velocities were obtained for the first time.
3.4 Velocity distributions and mass determinations
The new galaxy radial velocities in the fields of UGC 842 and NGC 6034 are listed in Tables 3 and 4, respectively. The radial velocities and the associated errors derived using cross-correlation (absorption-line systems) are given in the column named V. The radial velocities from emission lines are given in the column named V. All radial velocities are corrected to the heliocentric reference frame. The galaxy identifications and their coordinates, total magnitudes in the ’ band and ’ band, values, and the number of emission lines (el) used when it is possible for velocity calculation (see Section 2.1.3) are also given in the tables. We used the robust bi-weight estimators CBI and SBI of Beers et al. (1990) to calculate a reliable value for the average velocity and the velocity dispersion for each group. The adopted radial velocities in Tables 3 and 4 for the determination of the average velocity and velocity dispersion of the groups are always the velocities calculated by cross-correlation, except in the cases when the S/N of the absorption line spectra was too low (in one case for the UGC 842 group and five cases for the NGC 6034 group). We use the relation of Carlberg et al. (1997) in order to estimate the virial radius of the systems: = /10 /H(), where H()=H[(1+)3+(1--)(1+)2+]1/2. Then the mass was estimated by = (2/G).
| Gal. | Fib. | SDSS ID | V | #el | ||||||
|---|---|---|---|---|---|---|---|---|---|---|
| (mag) | (mag) | (mag) | (mag) | (km s-1) | (km s-1) | |||||
| 248 | 66 | J011726.91-004700.1 | 18.81 | 18.41 | 18.08 | 19.10 | 1733969 | 2.42 | ||
| 1309 | 21 | J011743.74-004953.0 | 16.00 | 15.18 | 14.93 | 16.48 | 1593035 | 10.07 | ||
| 3134 | 5 | J011745.47-010606.2 | 19.02 | 18.54 | 18.24 | 19.38 | 4419484 | 2.58 | ||
| 3079 | 79 | J011745.62-010641.5 | 19.66 | 19.04 | 18.77 | 20.07 | 6928113 | 2.62 | ||
| 3755 | 114 | J011750.18-010727.2 | 19.60 | 18.78 | 18.88 | 20.35 | 5109882 | 4.14 | ||
| 4780 | 54 | J011758.75-010112.8 | 18.76 | 18.47 | 18.20 | 19.03 | 14190101 | 3.06 | ||
| 5256 | 11 | J011803.03-010258.1 | 17.12 | 16.21 | 16.03 | 17.68 | 1319267 | 5.24 | ||
| 7155 | 52 | J011814.40-005256.3 | 16.85 | 16.43 | 16.13 | 17.20 | 1478185 | 6 | ||
| 8131 | 67 | J011818.87-003619.6 | 19.53 | 19.05 | 2654860 | 4.93 | ||||
| 9106 | 12 | J011827.75-010131.4 | 17.83 | 17.59 | 17.24 | 18.18 | 586872 | 6 | ||
| 7894 | 108 | J011832.25-011150.4 | 15.61 | 14.66 | 14.39 | 16.07 | 1387389 | 4.20 | ||
| 1002 | 43 | J011837.30-005924.2 | 16.70 | 15.85 | 15.60 | 17.19 | 1398766 | 5.56 | ||
| 1126 | 15 | J011840.90-004021.7 | 17.44 | 16.62 | 16.37 | 17.92 | 1462759 | 6.76 | ||
| 1187 | 18 | J011852.99-003935.3 | 16.08 | 15.20 | 14.94 | 16.58 | 1431133 | 2.07 | ||
| 8901 | 39 | J011853.62-010007.2 | 14.35 | 13.47 | 13.21 | 14.85 | 1342840 | 10.09 | ||
| 13007 | 37 | J011854.47-004059.5 | 15.93 | 15.04 | 14.78 | 16.44 | 1351135 | 11.30 | ||
| 1597 | 93 | J011913.43-010503.4 | 17.56 | 16.70 | 16.47 | 18.14 | 1377158 | 4.94 | ||
| 1480 | 124 | J011913.49-010839.9 | 15.55 | 14.58 | 14.30 | 16.08 | 1378944 | 8.70 | ||
| 1662 | 31 | J011916.05-011040.2 | 19.17 | 18.81 | 18.49 | 19.53 | 835877 | 3.89 | ||
| 1821 | 128 | J011932.22-010607.9 | 18.16 | 17.39 | 16.94 | 18.48 | 6119542 | 4.34 |
| Gal. | Fib. | Run | SDSS ID | V | V | #el | |||||
|---|---|---|---|---|---|---|---|---|---|---|---|
| (mag) | (mag) | (mag) | (mag) | (km s-1) | (km s-1) | ||||||
| 1 | 87 | 1 | J160152.09+171139.8 | 17.83 | 16.96 | … | … | 1049933 | 10.68 | ||
| 333 | 63 | 1 | J160204.26+170433.0 | 14.47 | 13.60 | … | … | 1095716 | 14.68 | ||
| 780 | 129 | 1 | J160206.23+171345.4 | 18.08 | 16.99 | … | … | 4226466 | 8.42 | ||
| 857 | 137 | 1 | J160206.90+171819.8 | 18.80 | 18.38 | … | … | 4976361 | 3.98 | ||
| 885 | 72 | 1 | J160208.02+172708.4 | 18.62 | 17.50 | 17.35 | 19.29 | 4233938 | 9.10 | ||
| 1042 | 104 | 1 | J160210.90+170925.4 | 19.45 | 18.00 | 16.82 | 19.14 | 6909872 | 5.56 | ||
| 1076 | 130 | 1 | J160210.98+172707.1 | 18.00 | 17.25 | 17.05 | 18.48 | 3252243 | 8.26 | ||
| 1278 | 49 | 2 | J160214.96+171557.4 | 18.49 | 17.88 | 17.94 | 19.22 | 4201023 | 5 | ||
| 1363 | 48 | 1 | J160218.39+171421.3 | 17.84 | 16.72 | 16.54 | 18.56 | 4238448 | 9.12 | ||
| 1473 | 115 | 1 | J160219.00+172938.4 | 20.51 | 18.78 | 17.65 | 20.21 | 9275187 | 7.40 | ||
| 1438 | 132 | 1 | J160219.24+171134.7 | 19.25 | 18.13 | 17.91 | 20.01 | 4252353 | 7.60 | ||
| 1426 | 19 | 1 | J160221.89+170949.3 | 18.65 | 17.52 | … | … | 4206156 | 8.23 | ||
| 1830 | 81 | 2 | J160227.29+170845.9 | 18.27 | 17.17 | 16.85 | 18.80 | 4239468 | 6.64 | ||
| 1873 | 8 | 2 | J160227.48+171313.6 | 18.35 | 17.51 | … | … | 4242977 | 2.80 | ||
| 1888 | 111 | 1 | J160227.52+172232.3 | 18.78 | 18.06 | 17.80 | 19.23 | 4183448 | 5.12 | ||
| 1908 | 23 | 1 | J160229.59+172700.3 | 19.11 | 18.35 | 18.06 | 19.51 | 1103453 | 5.81 | ||
| 1994 | 6 | 1 | J160230.54+170035.6 | 17.82 | 17.06 | 16.81 | 18.24 | 984231 | 9.58 | ||
| 114 | 2 | 980841 | 8.98 | 992249 | 10 | ||||||
| 2144 | 82 | 1 | J160233.45+170754.4 | 18.57 | 18.11 | 17.82 | 18.93 | 4097312 | 5 | ||
| 2265 | 100 | 1 | J160235.55+170136.9 | 19.02 | 18.24 | 17.97 | 19.48 | 3630096 | 2.40 | ||
| 2588 | 57 | 1 | J160242.80+170614.3 | 19.19 | 17.92 | 17.71 | 19.98 | 5266840 | 7.59 | ||
| 2677 | 92 | 1 | J160244.90+172159.4 | 18.62 | 18.17 | 17.97 | 19.07 | 1831980 | 3.44 | ||
| 2580 | 66 | 1 | J160245.04+171815.4 | 16.45 | 15.82 | 15.58 | 16.83 | 1067851 | 6.90 | ||
| 2720 | 12 | 1 | J160246.95+165916.5 | 19.30 | 18.30 | 17.85 | 19.67 | 5027165 | 5.97 | ||
| 2746 | 22 | 2 | J160247.36+171056.6 | 17.52 | 16.71 | 16.77 | 18.30 | 1028224 | 12.84 | ||
| 2716 | 8 | 1 | J160247.54+171454.9 | 17.16 | 16.41 | … | … | 1305148 | 7.01 | 1316063 | 5 |
| 2801 | 54 | 1 | J160249.11+171120.4 | 18.21 | 17.17 | 16.87 | 18.65 | 3219646 | 6.03 | ||
| 2691 | 79 | 1 | J160249.22+171002.6 | 15.48 | 14.63 | 14.41 | 16.01 | 1035627 | 19.49 | ||
| 2858 | 103 | 1 | J160249.29+172228.4 | 20.89 | 20.53 | 17.62 | 18.61 | 15987100 | 3.53 | ||
| 3033 | 61 | 1 | J160254.86+173106.4 | 17.74 | 16.71 | 16.59 | 18.47 | 3000623 | 13.37 | ||
| 3158 | 116 | 1 | J160255.92+170348.3 | 18.08 | 17.65 | 17.35 | 18.42 | 1381010 | 6 | ||
| 3344 | 69 | 1 | J160301.29+171609.5 | 17.98 | 17.32 | 17.10 | 18.46 | 3320377 | 3.20 | ||
| 3524 | 46 | 1 | J160303.39+171429.1 | 18.73 | 17.72 | 17.47 | 19.24 | 4035634 | 8.86 | ||
| 85 | 2 | 4033588 | 3.99 | ||||||||
| 3615 | 25 | 1 | J160305.24+171136.1 | 17.67 | 16.88 | 16.74 | 18.32 | 995238 | 10.62 | ||
| 3379 | 86 | 1 | J160305.72+171020.3 | 17.11 | 16.59 | 16.26 | 17.36 | 1005040 | 7 | ||
| 3651 | 84 | 1 | J160306.68+173136.4 | 17.61 | 16.95 | 16.88 | 18.05 | 2980123 | 10.56 | ||
| 3686 | 33 | 1 | J160307.22+172749.4 | 17.36 | 16.88 | 16.61 | 17.69 | 1077651 | 4.35 | 1083536 | 9 |
| 3580 | 67 | 1 | J160307.58+172412.9 | 18.39 | 17.87 | 17.69 | 18.77 | 3303182 | 3.41 | 3294240 | 6 |
| 3910 | 68 | 1 | J160307.88+171719.9 | 18.67 | 17.65 | 17.35 | 19.07 | 4033957 | 5.36 | ||
| 3998 | 16 | 1 | J160310.23+172819.0 | 18.25 | 17.58 | 17.38 | 18.68 | 3376538 | 5.99 | ||
| 4168 | 15 | 1 | J160314.11+172202.4 | 15.66 | 14.76 | 14.49 | 16.18 | 994341 | 12.47 | ||
| 4221 | 90 | 1 | J160314.95+171421.3 | 18.20 | 17.45 | 17.05 | 18.51 | 1048737 | 7.84 | ||
| 4411 | 108 | 1 | J160317.65+171101.7 | 17.68 | 16.83 | 16.76 | 18.32 | 1043553 | 5.77 | ||
| 4527 | 99 | 1 | J160322.65+170326.0 | 17.10 | 16.34 | … | … | 1178325 | 12.06 | ||
| 45 | 2 | 1180548 | 11.39 | 1171752 | 10 | ||||||
| 4729 | 42 | 1 | J160324.62+171648.8 | 17.92 | 16.74 | 16.40 | 18.40 | 4019730 | 13.00 | ||
| 4930 | 59 | 1 | J160327.88+171628.7 | 20.16 | 19.06 | 17.57 | 19.40 | 4058195 | 3.60 | ||
| 4920 | 124 | 1 | J160328.00+171146.2 | 17.84 | 16.93 | 16.76 | 18.38 | 1031434 | 12.36 | ||
| 29 | 2 | 1033935 | 11.63 | ||||||||
| 4913 | 91 | 2 | J160328.00+171619.8 | 18.03 | 16.91 | 16.89 | 18.83 | 4041879 | 5.79 | ||
| 4749 | 91 | 1 | J160328.02+172559.4 | 16.09 | 15.24 | 15.03 | 16.65 | 1056822 | 24.08 | ||
| 4989 | 31 | 1 | J160328.93+170930.2 | 18.40 | 17.62 | 17.58 | 19.06 | 1056332 | 8.74 | ||
| 14 | 2 | 1063874 | 4.19 | ||||||||
| 5099 | 93 | 2 | J160330.86+171056.4 | 18.05 | 17.24 | 16.96 | 18.41 | 1000332 | 12.22 | ||
| 5065 | 20 | 1 | J160330.94+172226.0 | 17.75 | 16.94 | 16.58 | 18.11 | 1030728 | 9.30 | ||
| 4090 | 29 | 1 | J160332.08+171155.2 | 14.44 | 13.54 | 13.08 | 14.69 | 1016248 | 10.75 | ||
| 5204 | 18 | 1 | J160332.41+173051.9 | 18.53 | 17.65 | 2971521 | 18.43 | ||||
| 4972 | 37 | 1 | J160332.58+172845.9 | 15.70 | 15.01 | 14.78 | 16.06 | 1319722 | 14.83 | ||
| 5232 | 9 | 2 | J160333.18+170947.1 | 17.80 | 17.01 | 16.95 | 18.43 | 998531 | 12.02 | ||
| 4846 | 64 | 1 | J160333.42+171421.6 | 17.35 | 16.22 | 15.45 | 17.47 | 4095145 | 10.05 | ||
| 5091 | 135 | 1 | J160334.27+165725.7 | 16.26 | 15.48 | 15.06 | 16.49 | 1006431 | 13.64 | ||
| 5269 | 117 | 1 | J160334.38+172817.5 | 17.76 | 17.46 | 16.98 | 17.95 | 1138471 | 6 | ||
| 5306 | 34 | 2 | J160334.45+172936.3 | 19.57 | 18.11 | 17.74 | 20.15 | 6795580 | 5.33 | ||
| 5348 | 9 | 1 | J160335.72+165841.7 | 17.87 | 17.22 | 16.86 | 18.41 | 1431651 | 5.88 | 1437649 | 9 |
| 5493 | 18 | 2 | J160337.57+172527.3 | 19.53 | 18.25 | 18.06 | 20.07 | 6840363 | 5.47 | ||
| 5522 | 126 | 1 | J160339.26+171105.4 | 16.85 | 15.97 | 15.77 | 17.42 | 1019450 | 8.97 | ||
| 5446 | 110 | 1 | J160340.50+172016.6 | 16.50 | 15.93 | 15.56 | 16.59 | 1274844 | 6.34 | ||
| 47 | 2 | 1278456 | 5.05 | ||||||||
| 5543 | 39 | 1 | J160340.81+170409.8 | 18.14 | 17.00 | 16.64 | 18.71 | 4113947 | 9.36 | ||
| 5688 | 56 | 1 | J160342.84+171812.9 | 18.51 | 17.49 | 17.10 | 18.96 | 2900518 | 15.66 | ||
| 5770 | 35 | 2 | J160343.72+171450.8 | 19.50 | 18.59 | 18.07 | 19.80 | 4218554 | 6.66 | ||
| 5801 | 106 | 1 | J160344.27+171750.8 | 18.37 | 17.60 | 17.55 | 19.10 | 1069442 | 5.93 | ||
| 5827 | 106 | 2 | J160344.58+171719.5 | 18.06 | 17.64 | 17.49 | 18.45 | 2914218 | 6 | ||
| 5833 | 95 | 1 | J160344.60+172826.4 | 18.27 | 17.75 | 17.44 | 18.64 | 1109912 | 7 | ||
| 5785 | 17 | 1 | J160344.88+170808.1 | 18.21 | 17.60 | 16.53 | 18.10 | 2067750 | 5 | ||
| 5855 | 75 | 1 | J160345.04+171347.0 | 17.94 | 17.09 | 16.83 | 18.45 | 992326 | 16.41 | ||
| 5651 | 120 | 1 | J160348.24+171426.2 | 15.31 | 14.47 | 14.04 | 15.63 | 1097431 | 12.08 | ||
| 6110 | 83 | 1 | J160350.67+171529.8 | 19.46 | 17.97 | 16.96 | 19.74 | 6909148 | 9.80 | ||
| 6065 | 126 | 2 | J160350.71+171421.8 | 17.65 | 16.90 | 15.97 | 17.64 | 1276741 | 9.87 | 1285558 | 10 |
| 6296 | 73 | 1 | J160354.42+170308.2 | 17.49 | 16.55 | 16.39 | 18.08 | 3332133 | 9.11 | ||
| 6331 | 93 | 1 | J160354.55+170435.2 | 18.11 | 17.36 | 17.44 | 18.91 | 1043043 | 6.35 | ||
| 6418 | 128 | 1 | J160356.30+170639.3 | 18.46 | 17.70 | 17.48 | 18.96 | 1036643 | 8.18 | ||
| 6313 | 122 | 1 | J160356.65+171818.4 | 16.16 | 15.33 | 15.10 | 16.68 | 1000445 | 9.80 | ||
| 6472 | 138 | 2 | J160357.52+171419.5 | 18.80 | 17.72 | 17.53 | 19.33 | 4186154 | 6.97 | ||
| 6563 | 78 | 1 | J160359.24+173209.4 | 18.46 | 17.43 | 17.13 | 18.96 | 3358432 | 13.42 | ||
| 6589 | 102 | 1 | J160359.79+172952.2 | 18.25 | 17.18 | 17.00 | 18.97 | 3364245 | 12.30 | ||
| 6569 | 47 | 1 | J160400.07+173104.0 | 17.71 | 16.64 | 16.33 | 18.30 | 3369320 | 18.02 | ||
| 6580 | 95 | 2 | J160400.17+173115.6 | 18.85 | 18.00 | 17.38 | 19.27 | 3353447 | 9.06 | ||
| 6501 | 20 | 2 | J160400.31+173317.5 | 17.25 | 16.24 | 16.15 | 17.85 | 3375741 | 10.55 | ||
| 6678 | 78 | 2 | J160401.12+172839.4 | 18.67 | 17.92 | 17.72 | 19.18 | 3490881 | 4.57 | ||
| 6692 | 28 | 1 | J160401.42+170820.4 | 18.55 | 17.91 | 17.68 | 18.95 | 2974350 | 4.43 | 2977646 | 5 |
| 6512 | 65 | 1 | J160402.75+171656.6 | 15.21 | 14.33 | 14.14 | 15.77 | 995641 | 13.41 | ||
| 7347 | 36 | 1 | J160405.47+171314.7 | 19.36 | 17.70 | 17.61 | 20.02 | 8853673 | 5.37 | ||
| 7055 | 131 | 2 | J160407.17+171410.6 | 17.39 | 16.84 | 16.69 | 17.72 | 83790118 | 2.02 | ||
| 7244 | 96 | 1 | J160407.55+171224.8 | 18.29 | 17.90 | 17.59 | 18.59 | 1054641 | 7 | ||
| 7100 | 58 | 1 | J160408.21+173051.1 | 18.58 | 17.75 | 17.61 | 19.11 | 1100637 | 9.83 | ||
| 8528 | 40 | 1 | J160418.17+171627.8 | 18.90 | 18.17 | 1036865 | 4.06 | ||||
| 8413 | 51 | 1 | J160420.36+172611.2 | 16.67 | 15.90 | 15.65 | 17.07 | 1062841 | 8.49 | 1078751 | 10 |
| 110 | 2 | 1080568 | 5.51 | 1075350 | 10 | ||||||
| 8144 | 134 | 1 | J160425.95+172543.1 | 18.86 | 17.85 | 17.60 | 19.43 | 3243526 | 13.33 | ||
| 8143 | 17 | 2 | J160427.24+170203.4 | 18.68 | 17.68 | 17.73 | 19.45 | 4114783 | 4.41 | ||
| 7584 | 71 | 1 | J160427.99+172148.0 | 17.89 | 16.95 | 16.84 | 18.54 | 3222928 | 10.89 | ||
| 8264 | 2 | 2 | J160428.03+171317.1 | 19.20 | 18.38 | 17.74 | 19.08 | 4182364 | 2.86 | ||
| 8134 | 2 | 1 | J160428.44+171319.8 | 17.96 | 17.50 | 17.23 | 18.31 | 1030139 | 6 | ||
| 7994 | 13 | 1 | J160429.13+172116.8 | 19.11 | 18.32 | 17.58 | 18.96 | 5334924 | 6 | ||
| 7895 | 59 | 2 | J160430.42+172809.0 | 15.52 | 14.92 | 14.95 | 16.04 | 1192353 | 7.39 | 1183127 | 10 |
| 7600 | 51 | 2 | J160434.80+172638.0 | 18.97 | 18.21 | 18.02 | 19.46 | 969263 | 6.94 | ||
| 6780 | 133 | 1 | J160436.01+171739.9 | 18.79 | 17.80 | 3229734 | 10.73 | ||||
| 7506 | 44 | 1 | J160437.44+171825.0 | 17.51 | 16.59 | 3219617 | 19.33 | ||||
| 5682 | 24 | 1 | J160354.19+173242.7aaNo magnitude information is available for this galaxy in the SDSS data. | 1550661 | 5.08 | ||||||
| 3474 | 63 | 2 | J160304.42+171127.6aaNo magnitude information is available for this galaxy in the SDSS data. | 16.88 | 18.10 | 1087175 | 3.00 | 1095645 | 9 |


| Group | V (CBI) | (SBI) | |||
|---|---|---|---|---|---|
| (km s-1) | (km s-1) | ( kpc) | ( M⊙) | ||
| UGC 842 (all) | 35 | 13,80881 | 47137 | … | … |
| UGC 842 (early-type) | 28 | 13,68280 | 41951 | … | … |
| UGC 842-S1 (all) | 20 | 13,46751 | 22329 | 509 | 1.1 |
| UGC 842-S1 (early-type) | 19 | 13,45853 | 22630 | 515 | 1.1 |
| UGC 842-S2 (all) | 15 | 14,28363 | 23535 | … | … |
| UGC 842-S2 (early-type) | 9 | 14,20453 | 23167 | … | … |
| NGC 6034 (all) | 44 | 10,44462 | 41039 | 954 | 7.0 |
| NGC 6034 (non-emission) | 31 | 10,34766 | 36140 | 840 | 4.7 |
3.4.1 UGC 842
The velocity distribution of all known galaxies with velocities between 10,000 km s-1 and 17,000 km s-1 and within a region of 8050 arcmin2 is shown in Figure 6 (left). The right histogram in Figure 6 shows the velocity distribution of the member galaxies of UGC 842 (with projected distances from the central galaxy within 1 h Mpc, or 20 arcmin). It suggests that UGC 842 has at least a bi modal distribution. In order to investigate its structure, we use the KMM-test (Ashman et al., 1994), which is appropriate to detect the presence of two or more components in an observational data set. First we consider whether the data are consistent with a single component. The results of applying the test in the homoscedastic mode (common covariance) yields strong evidence that the velocity distribution of galaxies in the velocity interval above is at least bimodal, rejecting a single Gaussian model at a confidence level of 99.5% (-value of 0.005). The -value is another way to express the statistical significance of the test, and is the probability that a likelihood test statistic would be at least as large as the observed value if the null hypothesis (one component in this case) were true. Assuming two components, the KMM-test estimated a mean value for each component of 13,477 km s-1 and 14,331 km s-1. The two components correspond to the structures S1 and S2 in Figure 6 (right). The average velocities and the velocity dispersions of S1 and S2 calculated using the robust bi-weight estimator are listed in Table 5. The two structures are separated by 820 km s-1 in the group rest frame. The first structure includes UGC 842 itself, which has a radial velocity of 13,428 km s-1, close to the peak of its distribution. In total, 20 and 15 galaxies are members of the structures S1 and S2, respectively. It is interesting to note that the first structure is mainly formed by passive galaxies (19 out of 20 galaxies) while for the second one, the number of passive galaxies is 60% (9 galaxies) of the total population. Similar double peaked galaxy distribution is also found when only passive galaxies are considered (the shaded region in Figure 6, right), which shows that the result is not biased by emission-line objects. The groups S1 and S2 seem to occupy the same projected area although S1 seems more centrally concentrated. Although the interaction between two small groups each with 230 km s-1 cannot be conclusively discarded, a radial velocity difference of 820 km s-1 between the peaks of the distributions S1 and S2 is an evidence that the observed bimodality is most probably due to a superposition of structures in the line of sight. If this is true, and assuming a condition of equilibrium, the group S1 – the UGC 842 group – has a virial mass and radius of 1.11013 M⊙ and 509 kpc, respectively. The high concentration of late-type galaxies in the group S2 strongly suggests that it is not in equilibrium.
3.4.2 NGC 6034
Figure 7 (right) shows the velocity distribution of all known member galaxies (with measured velocities) of the NGC 6034 group. The distribution is well represented by a Gaussian, although there is a high velocity tail. The best estimates for its parameters are Vavg = 10,44462 km s-1 and = 41039 km s-1, from 44 member galaxies (Table 5). This velocity dispersion implies a virial radius of 954 kpc and mass of 71013 M☉ for this group. The shaded histogram in Figure 7 (right) shows the distribution of the 31 non-emission-line (early-type) galaxies of the sample. The fraction of emission-line galaxies in the group is relatively high and represents about 30% of the known members, and they have preferentially higher velocities than the system, populating the right tail of the distribution. For this reason, we suspect that the tail is due to spiral galaxies falling onto the principal group. Consequently, we derive a slightly lower dispersion from the non-emission galaxies ( 361 km s-1) than that of the whole sample ( 410 km s-1). If we do not consider the emission-line galaxies, the calculated average velocity, velocity dispersion, virial radius and virial mass for the non-emission-line population of NGC 6034 are: = 10,34766 km s-1, = 36140 km s-1, = 840 kpc, and = 4.71013 M⊙.
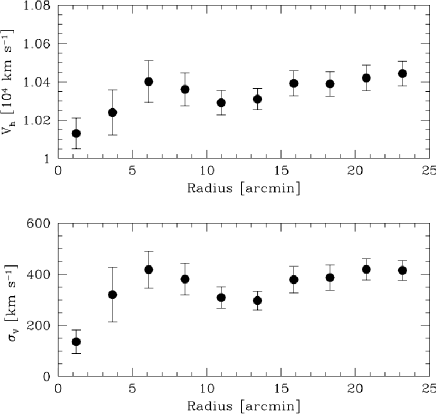
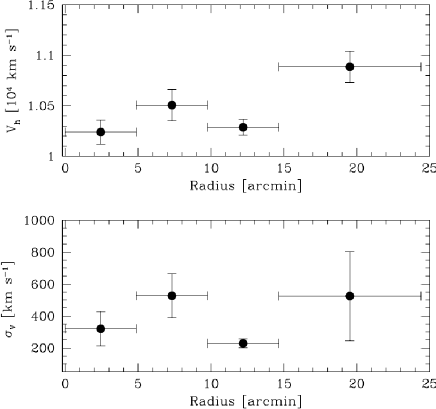
In order to check the extent of the NGC 6034 group and to minimize the contamination of galaxies that could be part of other structures, we analyzed the cumulative and differential distributions of velocities in the group as a function of radius (Figure 8). For the cumulative distribution, we calculated the average velocity and the velocity dispersion by including all galaxies inside a given radius, in steps of 100 kpc (denoted in arcmin in the figures). Thus, for a radius of 400 kpc, we included all galaxies from the center of the group up to this radius. With this analysis we can see the general behavior of the group from the central part to the outskirt regions. For the differential distribution, we calculated the average velocity and the velocity dispersion for those galaxies inside concentric rings of 200 kpc from the center of the group. If the ring had less than 10 galaxies, then we increased the width of the ring until we reached this minimum value. This analysis may reveal the degree of anisotropy present in the group.
In both figures we can see an increase in the average velocity and velocity dispersion for radii larger than 16 arcmin ( 650 kpc). This increment probably is due to the presence of the three major galaxy clusters in the region. We calculated the average velocity and the velocity dispersion for all galaxies inside this radius. The results are = 10,39265 km s-1 and = 37952 km s-1, which results in 882 kpc and 5.51013 M⊙. These are the values we would favor for describing the group NGC 6034. Even with this revised smaller for NGC 6034, three galaxies (J160348.24+171426.2, J160402.75+171656.6, and J160356.65+171818.4) populate the 2 magnitude gap, within /2 of the group center.
3.4.3 Optical Versus X-ray Properties
The measured value of the intracluster gas bolometric X-ray luminosity of NGC 6034 is 2.81043 erg s-1 (Fukazawa et al., 2004) and for UGC 842 it is 1.631043 erg s-1 (Voevodkin et al., 2008). According to the relations for groups and clusters from Xue & Wu (2000) and Mahdavi & Geller (2001), we find that for the X-ray luminosity of NGC 6034 group it is expected a velocity dispersion of about 425 km s-1, in good agreement with our direct measurement of 410 km s-1 (when we include all galaxies in the group; or 360 km s-1 when only the non-emission-line galaxies are included). On the other hand, a velocity dispersion of 450 km s-1 is expected for a group with the X-ray luminosity of UGC 842, which is much higher than its measured velocity of 223 km s-1 even if we assume that each substructure seen in its line of sight contributes with one-half of the observed LX. The first consequence of this divergence between X-rays and optical properties is the determination of the true virial radius for UGC 842. From dynamical relations of velocity distribution of galaxies we determine a virial radius of 509 kpc, while the intragroup X-ray gas implies a virial radius of 1272 kpc, according to Gastaldello et al. (2007). This apparent inconsistency is discussed in Section 4.
4 Summary and Discussion
We summarize below the main findings of this paper:
About NGC 6034:
-
•
NGC 6034 is a group of 4 L∗ galaxies with a mass of 71013 M⊙ and of 954 kpc (or 4.71013 M⊙ and of 840 kpc if only non-emission-line galaxies are considered). It is not a fossil group given that the magnitude difference in the band between the first and second (J160402.75+171656.6) ranked galaxies is only 0.79 mag and the projected distance between these two galaxies is 360 kpc. Other four (or five; see Section 3.2) galaxies also violate the optical criteria to classify it as a fossil group.
-
•
NGC 6034 is clearly part of a much larger structure that includes at least three clusters (among them the Hercules cluster) and several other groups.
-
•
The velocity distribution of NGC 6034 is fairly well represented by a Gaussian except for a high velocity tail composed of spiral galaxies. These are most probably objects falling onto the system. The velocity dispersion of only the non-emission-line galaxies (31 members with measured redshifts) is 36140 km s-1 and including the 13 emission-line objects it increases slightly to 41039 km s-1.
About UGC 842:
-
•
The system referred to as UGC 842 in the literature is in fact a superposition of two groups, S1 and S2, with a velocity difference of about 820 km s-1.
-
•
UGC 842/S1 is dominated by passive galaxies while there is a high fraction (40%) of emission galaxies in S2.
-
•
UGC 842/S1 is dominated by a bright elliptical galaxy and it is a low mass fossil group. The large content in passive galaxies suggests equilibrium, and the estimated virial mass and radius are 1.11013 M⊙ and 509 kpc, respectively.
-
•
There is a large discrepancy between the expected temperature and X-ray luminosity expected for a group with such a low sigma and its observed values of of 1.900.30 keV and LX,bol 1.631043 erg s-1 by Voevodkin et al. (2008), suggesting that we have a case of interaction of the two subclumps S1 and S2 or we are whitenessing the decrease of sigma due to the central merger event.
Other previous papers have also studied UGC 842. However, it has not been realized in these works that what is referred to as UGC 842 is in fact two systems. For example, a velocity dispersion of 439 km s-1 was derived by Voevodkin et al. (2008) from the redshifts of 16 galaxies within a radius of 509 kpc around UGC 842. This value is in good agreement with our value of 47137 km s-1 determined from the redshifts of 35 potential member galaxies, if we ignore the double-peaked velocity distribution. However, the KMM-test (Ashman et al., 1994) rejects a Gaussian velocity distribution at the 99.5% level, and the distribution reveals clearly two structures – S1, the UGC 842 group, and S2 – with a velocity dispersion of about 230 km s-1 each (see Figure 6 and Table 5). The fact that the bolometric X-ray luminosity of UGC 842 fits well in the LX-TX relation, the measured sigma for the group is too low in the LX– and TX– group relations (e.g., Xue & Wu, 2000): UGC 842 seems to be too luminous and too hot, with a of 1.9 keV (Voevodkin et al., 2008), for its sigma. The expected X-ray temperature for S1 and S2 from their velocity dispersion is around 0.5–1 keV, and the superposition of both plasmas in the line of sight does not imply in the detection of a temperature as high as 1.9 keV. Although not too pronounced, similar behavior has also been observed in other fossil groups (Khosroshahi et al., 2007). In fact, this high value for the temperature of UGC 842 is in line with the suggestion of Khosroshahi et al. (2007) that both temperature and X ray luminosity has been boosted for fossil groups compared to the values for “normal” groups with similar velocity dispersions, given their early times of formation. Another possibility we envisage is that the galaxies have lower relative velocities in fossil groups given that they have lost energy by dynamical friction in the process of spiraling towards the group center for interacting and finally merging. The radial velocity difference between the peaks of the velocity distribution of S1 and S2 ( 820 km s-1; see Section 3.4) suggests that the two groups are simply overlapping in the line of sight. Although the smooth appearance of the X-ray image (Voevodkin et al., 2008) agrees with this hypothesis, we think the SNR of the X-ray observation cannot rule out the presence of X-ray substructures that could indicate a recent interaction of the two sub-groups. Better S/N and spatial resolution X-ray data may reveal if there is an interaction between the two groups (S1 or S2) or not. Thus, the measured temperature of 1.9 keV for UGC 842 may either represent the intragroup medium of the most massive group, S1, or it could be the result of an interaction between S1 and S2. Both possibilities make UGC 842 especially interesting in the study of formation and evolution of fossil groups.
References
- Adelman-McCarthy et al. (2008) Adelman-McCarthy, J. K., et al. 2008, ApJS, 175, 297
- Ashman et al. (1994) Ashman, K. M., Bird, C. M., & Zepf, S. E. 1994, AJ, 108, 2348
- Barden & Ingerson (1998) Barden, S. C., Ingerson, T. E. in ASP Conf. Ser. 152, Fiber Optics in Astronomy III, ed. S. Arribas, E. Mediavilla, and F. Watson (San Francisco, CA: ASP), 60
- Beers et al. (1990) Beers, T. C., Flynn, K., & Gebhardt, K. 1990, AJ, 100, 32
- Bird et al. (1995) Bird, C. M., Davis, D. S. & Beers, T. C. 1995, AJ, 109, 920
- Canizares et al. (1987) Canizares, C. R., Fabbiano, G., & Trinchieri, G. 1987, ApJ, 312, 503
- Carlberg et al. (1997) Carlberg, R. G., et al. 1997, ApJ, 485, 13
- Corwin (1971) Corwin, H. G., Jr. 1971, PASP, 83, 320
- Cypriano et al. (2006) Cypriano, E. S., Mendes de Oliveira, C., & Sodré, L., Jr. 2006, AJ, 132, 514
- Dariush et al. (2007) Dariush, A., Khosroshahi, H. G., Ponman, T. J., Pearce, F., Raychaudhury, S., Hartley, W. 2007, MNRAS, 382, 433
- Díaz-Giménez et al. (2008) Díaz-Giménez, E., Muriel, H., Mendes de Oliveira, C. 2008, A&A, 490, 965
- Dickey (1997) Dickey, J. M. 1997, AJ, 113, 1939
- D’Onghia et al. (2005) D’Onghia, E., Sommer-Larsen, J., Romeo, A. D., Burkert, A., Pedersen, K., Portinari, L., & Rasmussen, J. 2005, ApJ, 630, 109
- Ebeling et al. (1998) Ebeling, H., et al. 1998, MNRAS, 301, 881
- Fukazawa et al. (2004) Fukazawa, Y., Makishima, K., & Ohashi, T. 2004, PASJ, 56, 965
- Gal et al. (2003) Gal, R. R., et al. 2003, AJ, 125, 2064
- Gastaldello et al. (2007) Gastaldello, F., et al. 2007, ApJ, 669, 158
- Gioia et al. (1983) Gioia, I. M., Feigelson, E. D., Maccacaro, T., Schild, R., & Zamorani, G. 1983, ApJ, 271, 524
- Goto et al. (2002) Goto, T., et al. 2002, AJ, 123, 1807
- Huchra et al. (1999) Huchra, J. P., Vogeley, M. S., & Geller, M. J. 1999, ApJS, 121, 287
- Khosroshahi et al. (2007) Khosroshahi, H. G., Ponman, T. J., & Jones, L. R. 2007, MNRAS, 377, 595
- La Barbera et al. (2009) La Barbera, F., de Carvalho, R. R., de la Rosa, I. G., Sorrentino, G., Gal, R. R., & Kohl-Moreira, J. L. 2009, AJ, 137, 3942
- Mahdavi & Geller (2001) Mahdavi, A., & Geller, M. J. 2001, ApJ, 554, 129
- Mendes de Oliveira et al. (2009) Mendes de Oliveira, C. L., Cypriano, E. S., Dupke, R. A., & Sodré Jr., L. 2009, AJ, 138, 502
- Mendes de Oliveira et al. (2006) Mendes de Oliveira, C., Cypriano, E. S., & Sodré Jr., L. 2006, AJ, 131, 158
- Ponman et al. (1994) Ponman, T. J. et al. 1994, Nature, 369, 462
- Ramella et al. (2000) Ramella, M.,Pisani, A. & Geller, M. J. 2000, AJ, 113, 483
- Sales et al. (2007) Sales, L. V., Navarro, J. F., Lambas, D. G., White, S. D. M., Croton, D. J. 2007, MNRAS, 382, 1901
- Santos et al. (2007) Santos, W. A., Mendes de Oliveira, C., & Sodré, L., Jr. 2007, AJ, 134, 1551
- Struble & Rood (1999) Struble, M. F. & Rood, H. J. 1999, ApJS, 125, 35
- Tarenghi et al. (1979) Tarenghi, M., Tifft, W. G., Chincarini, G., Rood, H. J., & Thompson, L. A. 1979, ApJ, 234, 793
- Tonry & Davis (1979) Tonry, J., & Davis, M. 1979, AJ, 84, 1511
- Valentijn & Perola (1978) Valentijn, E. A., & Perola, G. C. 1978, A&A, 63, 29
- Voevodkin et al. (2008) Voevodkin, A., Miller, C. J., Borozdin, K., Heitmann, K., Habib, S., Ricker, P., & Nichol, R. C. 2008, ApJ, 684, 204
- Xue & Wu (2000) Xue, Y., & Wu, X. 2000, ApJ, 538, 65
- White et al. (1999) White, R., et al. 1999, AJ, 118, 2014
- Yoshioka et al. (2004) Yoshioka, T., Furuzawa, A., Takahashi, S., Tawara, Y., Sato, S., Yamashita, K., & Kumai, Y. 2004, Adv. Space Res., 34, 2525