Complex magnetic topology and strong differential rotation on the low-mass T Tauri star V2247 Oph††thanks: Based on observations obtained at the Canada-France-Hawaii Telescope, operated by the National Research Council of Canada, the Institut National des Sciences de l’Univers of the Centre National de la Recherche Scientifique of France and the University of Hawaii.
Abstract
From observations collected with the ESPaDOnS spectropolarimeter at the Canada-France-Hawaii Telescope (CFHT), we report the detection of Zeeman signatures on the low-mass classical T Tauri star (cTTS) V2247 Oph. Profile distortions and circular polarisation signatures detected in photospheric lines can be interpreted as caused by cool spots and magnetic regions at the surface of the star. The large-scale field is of moderate strength and highly complex; moreover, both the spot distribution and the magnetic field show significant variability on a timescale of only one week, as a likely result of strong differential rotation. Both properties make V2247 Oph very different from the (more massive) prototypical cTTS BP Tau; we speculate that this difference reflects the lower mass of V2247 Oph.
During our observations, V2247 Oph was in a low-accretion state, with emission lines showing only weak levels of circular polarisation; we nevertheless find that excess emission apparently concentrates in a mid-latitude region of strong radial field, suggesting that it is the footpoint of an accretion funnel.
The weaker and more complex field that we report on V2247 Oph may share similarities with those of very-low-mass late-M dwarfs and potentially explain why low-mass cTTSs rotate on average faster than intermediate mass ones. These surprising results need confirmation from new independent data sets on V2247 Oph and other similar low-mass cTTSs.
keywords:
stars: magnetic fields – stars: formation – stars: imaging – stars: rotation – stars: individual: V2247 Oph – techniques: spectropolarimetry1 Introduction
Whereas our understanding of most phases of stellar evolution made considerable progress throughout the twentieth century, stellar formation remained rather enigmatic and poorly constrained by observations until about two decades ago with the advent of the most powerful ground-based and space telescopes. One of the major discoveries obtained then is that protostellar accretion discs are often associated with extremely powerful and highly collimated jets escaping the systems along their rotation axis (e.g., Snell et al., 1980). This finding has revolutionized the field of stellar formation; in particular, it provided us with strong evidence that magnetic fields are playing an important role throughout stellar formation.
Magnetic fields are expected to modify significantly the contraction of molecular clouds into protostellar cores and discs (e.g., André et al., 2008, for a review). They are also expected to influence the next formation stage, at least for stars with masses lower than about 2.5 ; these protostars (called classical T Tauri stars or cTTSs) apparently host magnetic fields strong enough to disrupt the central regions of their accretion discs, connect the protostars to the inner disc rim through discrete accretion funnels and possibly even slow down the rotation of protostars through the resulting star/disc magnetic torque (e.g., Bouvier et al., 2007, for a review).
While magnetic fields have been repeatedly reported over the last decade at the surface of a number of prototypical TTSs (e.g., Johns-Krull et al., 1999; Johns-Krull, 2007), it is only recently that their large-scale topologies can be investigated into some details through phase-resolved spectropolarimetric observations (Donati et al., 2007, 2008b; Hussain et al., 2009). This new option offers a direct opportunity to pin down the role of magnetic fields in this crucial phase of the formation process. In particular, it straightforwardly allows studying how magnetic topologies of cTTSs depend on mass and rotation rate, giving hints on the potential origin of such fields; moreover, it provides material for quantitatively studying how protostars magnetically connect and interact with their accretion discs.
Up to now, magnetic topologies of 4 cTTSs have been investigated with this method. Among these 4, only BP Tau ( ) is fully convective and hosts a rather simple, dominantly dipolar, large-scale magnetic field, the 3 others being partly convective (as a result of their relatively higher mass, in excess of 1.3 ) and hosting a more complex magnetic topology. In particular, this transition from simple to complex fields for stars on either sides of the full convection limit is reminiscent of the magnetic properties of low-mass main-sequence dwarfs (Morin et al., 2008b; Donati et al., 2008c); in addition to suggesting that magnetic fields of cTTSs are likely of dynamo origin, it also gives potential hints on why magnetospheric accretion and rotation properties of cTTSs are discrepant on both sides of the full convection limit (e.g., with higher mass cTTSs rotating more quickly in average).
Extending this magnetic survey to a larger sample of cTTSs is needed to go further; this is the exact purpose of the MaPP (Magnetic Protostars and Planets) program, in the framework of the international MagIcS research initiative (aimed at qualifying the magnetic properties of stars throughout the HR diagram). This survey has been allocated 690 hr of observing time on the 3.6 m Canada-France-Hawaii Telescope (CFHT) over 9 successive semesters (from 2008b to 2012b). The present paper concentrates on the low-mass111Throughout this paper, cTTSs with masses lower than 0.5 , ranging from 0.5 to 1 and larger than 1 are respectively called low-mass, intermediate-mass and high-mass cTTSs. cTTS V2247 Oph (spectral type M1) in the Oph star forming region (Lynds 1688 dark cloud); with a mass of only about 0.35 (see Sec. 2), it is less massive than all cTTSs yet magnetically imaged and thus appears as an ideal candidate to expand our sample towards cooler cTTSs.
2 V2247 Oph = SR 12 = ROX 21 = HBC 263
First classified as a TTS with weak emission lines (weak-line TTS or wTTS) from its moderate H emission (equivalent width of order 0.4 nm, e.g., Bouvier & Appenzeller, 1992), V2247 Oph has recently been reported to undergo transient episodes of stronger H emission (equivalent width of up to 1.76 nm Littlefair et al., 2004) that makes it qualify as a cTTS based on that criterion (i.e., with an H emission larger than 0.9 nm at spectral type M1, e.g., Fang et al., 2009). It therefore suggests that V2247 Oph is still surrounded by a (likely low-mass) accretion disc.
The exact nature and evolutionary stage of this disc is however unclear. Given that accretion is still on-going (although sporadically), we can assume that the inner disc contains at least gas. However, V2247 Oph shows no significant infrared excess up to about 10 m (Gras-Velázquez & Ray, 2005; Cieza et al., 2007) indicating that the disc contains very little hot-dust. ISOPHOT measurements indicate large excesses at 60 and 100 m (Gras-Velázquez & Ray, 2005) suggesting the presence of an outer disc; however, given the large size of the aperture used (120′′) and the IR-bright nebulosity located very close to V2247 Oph (e.g., Padgett et al., 2008), this excess may potentially be unrelated to V2247 Oph itself and rather result (at least partly) from background/foreground contamination. It thus awaits for a confirmation from higher spatial resolution data (e.g., Spitzer MIPS observations).
V2247 Oph is also known to be a binary star with a companion located at about 0.3′′ (Simon et al., 1987) from the primary star, i.e., at 42 AU assuming a distance of pc for V2247 Oph (e.g., Mamajek, 2008). The presence of the companion likely implies that the disc features a gap at a few tens of AUs, with the inner disc being fed by a circumbinary structure (possibly that producing the far-IR excesses); this configuration may potentially generate lower-than-average and unsteady accretion rates like those observed on V2247 Oph. At most of the optical wavelengths we are working at in the present paper, the companion is outshone by the primary star by more than an order of magnitude and can therefore be neglected for our analysis.
Fits to the spectral energy distribution (Gras-Velázquez & Ray, 2005) indicate that V2247 Oph has a photospheric temperature of 3430 K, a radius and a luminosity of 2.2 and 0.61 respectively (once corrected for a distance of 139 pc) and suffers a visual extinction of . This is in rough agreement with previous determinations from both photometric colors and spectroscopic indices (e.g., Bouvier & Appenzeller, 1992). We thus assume here that K (with a typical error of 150 K) and (with a typical error of 0.1 dex). Fitting the evolutionary models of Siess et al. (2000) to these parameters, we infer that V2247 Oph is a fully convective star with a mass of 0.36 (possible values ranging from 0.29 to 0.45 ), a radius of and an age of about 1 Myr. Note that despite the large uncertainty on mass (about 25% and essentially reflecting the uncertainty on effective temperature, Siess, 2001), we can safely conclude that V2247 Oph is truly a low-mass cTTS and in particular that it is significantly less massive than the intermediate-mass cTTS BP Tau. In the following, we assume that and .
From photometric modulation presumably caused by the presence of cool surface spots going in and out of view of Earth-based observers, V2247 Oph is reported to be rotating with a period of about 3.5 d (Bouvier & Bertout, 1989; Schevchenko & Herbst, 1998). Long term photometric monitoring moreover reveals that this period is significantly changing with time (from about 3.4 to 3.6 d, Grankin et al., 2008); it suggests that V2247 Oph (as many other cool active stars, e.g., Hall, 1991) is experiencing photospheric shearing due to latitudinal differential rotation, which generates different modulation periods for spots located at different latitudes.
With (Bouvier & Appenzeller, 1992), V2247 Oph is located at a critical position in an HR diagram of young stars (Lamm et al., 2005). For stars bluer than this value (i.e. more massive than V2247 Oph), the distribution of rotation periods is bimodal, with a main peak centred at about 7.5 d and an overall average of about 6.7 d in the Orion Nebula Cluster (ONC); for stars redder than this threshold, the period distribution is unimodal with an average of about 3.3 d in the ONC. With a rotation period of 3.5 d, V2247 Oph belongs to the second group while the prototypical cTTS BP Tau (whose and rotation period are respectively equal to 0.9 and 7.6 d) belongs to the more slowly-rotating population222The exact stellar mass at which this limit occurs somewhat depends on the accuracy of both atmospheric and evolutionary models; while studies suggest it is located at about 0.25 (Lamm et al., 2005), our mass estimate of V2247 Oph would place it at about 0.35 ..
From the photometric period and projected equatorial rotation velocity (equal to km s-1, see below, in good agreement with the lower accuracy estimate of Bouvier et al., 1986), we infer that , where denotes the inclination of the rotation axis to the line-of-sight. We obtain that ; our imaging study further confirms this intermediate value of the inclination angle (see Sec. 4).
Optical veiling, presumably caused by accretion and potentially weakening the strength of the photospheric spectrum, is rather common for cTTSs and often generates large-scale and apparently random variations in the equivalent width of photospheric lines. For V2247 Oph however, we see only small changes (of order a few percent) in the equivalent widths of LSD Stokes profiles, suggesting that veiling is minimal; we take this as direct evidence that accretion was weak on V2247 Oph during our observations. The spectrum of V2247 Oph also exhibits all the usual accretion proxies, namely H, H, the He i line and the emission cores of the Ca ii infrared triplet (IRT) lines. From their equivalent widths and the corresponding line fluxes (see Sec. 5), and using empirical correlations from the published literature (e.g., Mohanty et al., 2005; Fang et al., 2009), we can derive a rough estimate of the logarithmic mass accretion rate of V2247 Oph (in yr-1) at the time of our run of about –9.8; using the same correlations, we find that can reach yr-1 during stronger accretion episodes (such as that observed by, e.g., Littlefair et al., 2004). As expected, this is slightly below the typical values expected for low-mass cTTSs (e.g., Mohanty et al., 2005; Fang et al., 2009).
| Date | HJD | UT | S/N | Cycle | |
|---|---|---|---|---|---|
| (2008) | (2,454,000+) | (h:m:s) | () | ||
| Jul 19 | 666.78070 | 06:40:26 | 110 | 9.1 | 0.937 |
| Jul 20 | 667.76238 | 06:14:11 | 120 | 8.5 | 1.218 |
| Jul 21 | 668.77056 | 06:26:04 | 130 | 7.5 | 1.506 |
| Jul 22 | 669.76031 | 06:11:25 | 140 | 6.9 | 1.789 |
| Jul 22 | 669.80591 | 07:17:06 | 140 | 6.9 | 1.802 |
| Jul 24 | 671.75990 | 06:11:05 | 130 | 7.7 | 2.360 |
| Jul 25 | 672.77281 | 06:29:47 | 130 | 7.5 | 2.649 |
| Jul 26 | 673.75570 | 06:05:16 | 150 | 6.3 | 2.930 |
| Jul 27 | 674.75594 | 06:05:44 | 140 | 6.8 | 3.216 |
| Jul 27 | 674.88360 | 09:09:35 | 130 | 7.8 | 3.252 |
| Jul 28 | 675.75706 | 06:07:28 | 60 | 18.7 | 3.502 |
| Jul 28 | 675.84904 | 08:19:56 | 50 | 21.6 | 3.528 |
| Jul 29 | 676.75564 | 06:05:32 | 120 | 8.0 | 3.787 |
| Jul 30 | 677.75556 | 06:05:33 | 140 | 7.0 | 4.073 |
| Jul 30 | 677.87649 | 08:59:43 | 120 | 8.5 | 4.108 |
3 Observations
Spectropolarimetric observations of V2247 Oph were collected in 2008 July using ESPaDOnS on the CFHT in Hawaii. ESPaDOnS collects stellar spectra spanning the whole optical domain (from 370 to 1,000 nm) at a resolving power of 65,000 (i.e., 4.6 km s-1), in either circular or linear polarisation (Donati, 2003). A total of 15 circular polarisation spectra were collected over a period of 12 d; each polarisation spectrum consists of 4 individual subexposures lasting each 879 s and taken in different polarimeter configurations to remove all spurious polarisation signatures at first order.
Raw frames are processed with Libre ESpRIT, a fully automatic reduction package/pipeline available at CFHT. It automatically performs optimal extraction of ESPaDOnS unpolarised (Stokes ) and circularly polarised (Stokes ) spectra following the procedure described in Donati et al. (1997). The velocity step corresponding to CCD pixels is about 2.6 km s-1; however, thanks to the fact that the spectrograph slit is tilted with respect to the CCD lines, spectra corresponding to different CCD columns across each order feature a different pixel sampling. Libre ESpRIT uses this opportunity to carry out optimal extraction of each spectrum on a sampling grid denser than the original CCD sampling, with a spectral velocity step set to about 0.7 CCD pixel (i.e. 1.8 km s-1). All spectra are automatically corrected of spectral shifts resulting from instrumental effects (e.g., mechanical flexures, temperature or pressure variations) using telluric lines as a reference. Though not perfect, this procedure provides spectra with a relative radial velocity (RV) precision of better than 0.030 km s-1 (e.g., Donati et al., 2008c).
The peak signal-to-noise ratios (per 2.6 km s-1 velocity bin) achieved on the collected spectra (i.e., the sequence of 4 subexposures) range between 110 and 150, with 2 lower-quality spectra taken in poor weather conditions. Rotational cycles are computed from heliocentric Julian dates according to the ephemeris:
| (1) |
The full journal of observations is presented in Table 1.
Least-Squares Deconvolution (LSD; Donati et al. 1997) was applied to all observations. The line list we employed for LSD is computed from an Atlas9 LTE model atmosphere (Kurucz, 1993) and corresponds to a M2 spectral type ( K and ) appropriate for V2247 Oph. We selected only moderate to strong atomic spectral lines whose synthetic profiles had line-to-continuum core depressions larger than 40% neglecting all non-thermal broadening mechanisms. We omitted the spectral regions with strong lines formed mostly outside the photosphere, such as the Balmer and He lines, and the Ca ii H, K and infrared triplet (IRT) lines; we also discarded all spectral windows heavily crowded with telluric lines. Molecular lines are not included in the list, their wavelengths, intensities and Zeeman sensitivities being not empirically computable with enough accuracy; we assume that their indirect contribution to LSD profiles is not concentrated at discrete velocities but statistically distributed over a wide domain, thus inducing no significant change nor variability in the shape of Stokes and LSD profiles. Altogether, about 4,800 spectral features are used in this process, most of them from Fe i. Expressed in units of the unpolarised continuum level , the average noise levels of the resulting LSD signatures are of order 8 per 1.8 km s-1 velocity bin, except for the 2 spectra taken on Jul 28 whose noise is about twice to thrice larger.
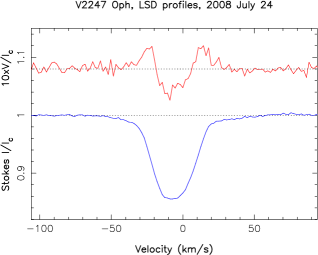
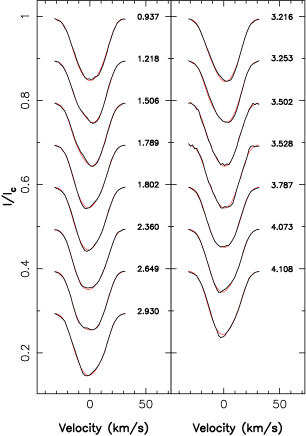
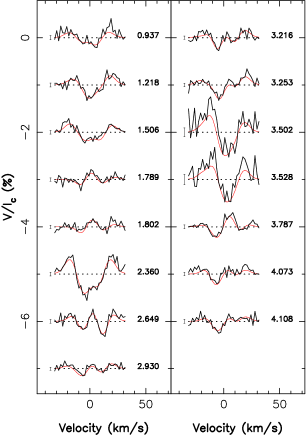
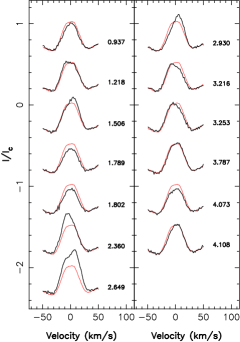
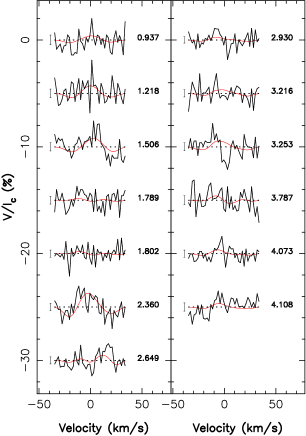
In most spectra, Stokes LSD profiles show clear distortions tracing the presence of cool spots at the surface of V2247 Oph; in addition, Stokes LSD profiles show Zeeman signatures with peak-to-peak average amplitudes of about 0.5% of the unpolarised continuum (i.e., typically 6 times larger than the mean noise level). An example of LSD profiles is shown in Fig. 1. We note that Stokes and spectra recorded almost exactly 7 d apart from each other (thus corresponding to very similar rotation phases but different cycles, e.g., cycles 1.218 and 3.216, or cycles 1.789 and 3.787) show significant differences, larger than those usually attributable to small phase shifts (e.g., between cycles 3.216 and 3.252, or cycles 1.789 and 1.802). We speculate that this is likely evidence for strong enough differential rotation at the surface of V2247 Oph to change the brightness and magnetic spot patterns at the surface of the star in as little as 7 d; this option is investigated in Sec. 4.
4 Brightness and magnetic imaging
4.1 Imaging method
To model the cool spots and magnetic topology at the surface of V2247 Oph, we use the new imaging code of Donati et al. (2006b) where the field is described through spherical-harmonics expansions and the brightness distribution as a series of independent pixels. In its newest implementation, our code can also simultaneously recover the distribution of accretion spots as derived from the profiles of emission lines formed at the base of accretion funnels (e.g., the narrow emission components of the IRT lines). Since V2247 Oph was experiencing only weak accretion at the time of our observations, we keep this part of the modelling separate and describe it in the next section.
Our imaging code uses the principles of maximum entropy to retrieve the simplest magnetic image and brightness distribution compatible with the series of rotationally modulated Stokes and LSD profiles. More specifically, the field is divided into its radial-poloidal, non-radial-poloidal and toroidal components, each of them described as a spherical-harmonics expansion (e.g., Donati et al., 2006b); given the different rotational modulation of Zeeman signatures that poloidal and toroidal fields generate, our imaging code appears particularly useful and efficient at producing dynamo-relevant diagnostics about the large-scale magnetic topologies at the surface of late-type stars. The brightness distribution is simply modeled as a set of independent pixels describing the contrast with respect to the quiet photosphere; for this particular analysis, we only allow the code to recover cool spots (i.e., darker than the photosphere).
The reconstruction process is iterative and proceeds by comparing at each step the synthetic profiles corresponding to the current image with those of the observed data set. To compute the synthetic Stokes and profiles, we divide the surface of the star into small grid cells (typically a few thousands), work out the specific contribution of each grid cell to the Stokes profiles (given the brightness, magnetic field strength and orientation within each grid cell, as well as the cell RV, location and projected area) and finally sum up contributions of all cells. Since the problem is partly ill-posed, we stabilise the inversion process by using an entropy criterion (applied to the spherical harmonics coefficients and to the brightness image pixels) aimed at selecting the image with minimum information among all those compatible with the data.

To describe the local profiles, we use Unno-Rachkovsky’s equations (e.g., Landi degl’Innocenti & Landolfi, 2004) known to provide a fairly accurate description of Stokes and profiles in the presence of magnetic fields. We set the central wavelength, Doppler width and Landé factor of our equivalent line to 700 nm, 3.4 km s-1 and 1.2 respectively and adjust the average line equivalent width to the observed value. We then derive both the rotational broadening and the radial velocity of V2247 Oph by fitting our series of LSD Stokes profiles and selecting the values that minimise the image information content (for a given quality of the fit to the data). We find km s-1 and km s-1. We can also obtain a rough estimate of the inclination angle by selecting the one producing images with minimum information content; the value we derive (when fitting both Stokes and data simultaneously) is , in good agreement with our initial estimate (see Sec. 2).
As noted above, the LSD profiles (and in particular their apparent deviation from strict rotational modulation) suggest that the brightness and magnetic distributions may have changed significantly over the course of our run. By comparison with other active cool stars, it is unlikely that the field would vary significantly over a period of one week; the probable cause for this change is thus surface differential rotation. This conclusion is independently confirmed by the significant changes in photometric period reported for V2247 Oph over the last 2 decades (Grankin et al., 2008). To incorporate differential rotation into the modelling, we proceed as in Donati et al. (2003) and Morin et al. (2008a), i.e., by assuming that the rotation rate at the surface of the star is varying with latitude as where is the rotation rate at the equator the difference in rotation rate between the equator and the pole. When computing the synthetic profiles, we use this law to work out the longitude shift of each cell at each observing epoch with respect to its location at the median observing epoch at which the field is reconstructed (at rotation cycle 2 in the present case and in the ephemeris of Eq. 1, i.e., at HJD 2454670.5); this way, we can correctly evaluate the true spectral contributions of all cells at all epochs.
For each pair of and values within a range of acceptable values, we then derive, from the complete data set, the corresponding magnetic topology (at a given information content) and the associated reduced chi-squared at which modelled spectra fit observations. By fitting a paraboloid to the surface derived in this process (Donati et al., 2003), we can easily infer the magnetic topology that yields the best fit to the data along with the corresponding differential rotation parameters and error bars. This process has proved reliable for estimating surface differential rotation on magnetic stars (e.g., Donati et al., 2003).
4.2 Results
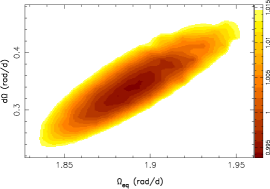
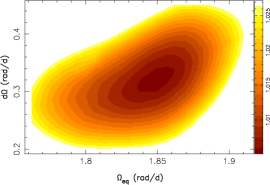
The first result is that both Stokes and LSD profiles confirm that differential rotation is indeed significantly shearing the photosphere of V2247 Oph. In both cases, the maps describing how varies as a function of and (at constant information content) show a clear paraboloid and a well defined minimum (see Fig. 2). The differential rotation parameters producing an optimal fit to the data are respectively equal to rad d-1 and rad d-1 for Stokes data and rad d-1 and rad d-1 for Stokes data. Both results are compatible within about one of their weighted average ( rad d-1, rad d-1, see middle panel of Fig. 2) that we take as reference hereafter. The corresponding rotation periods for the equator and pole are 3.36 and 4.08 d respectively, bracketing the reported photometric periods ranging from 3.4 to 3.6 d (Grankin et al., 2008); in this context, the period with which we phased our data (3.5 d) corresponds to a latitude of about 30∘.
We carried out several tests to confirm that differential rotation is indeed detected. For instance, trying to fit Stokes LSD profiles to a unit reduced chi-squared assuming solid body rotation is hardly possible. The smallest we get is about 13% higher (i.e., larger by 70 for 540 data points) than the minimum obtained when assuming differential rotation at equal information content, and the corresponding rotation period (3.75 d) is significantly larger than the average photometric period; even gets up to 25% higher (i.e., larger by 135) than the minimum when imposing solid body rotation at a period of 3.5 d. We also investigated whether the observed differential rotation could actually be a spurious signal resulting from intrinsic variability (other than differential rotation); note that this option is unlikely as there is little chance for intrinsic variability to mimic a fast equator and a slow pole in the same way in 2 different and fully-independent data sets. We nevertheless checked it by splitting our data into 2 subsets and reconstructing individual images for each subset (assuming solid body rotation); although this method has limited diagnostic power (the fewer the spectra in one subset the less accurate the recovered image), it is nevertheless clear that both images include similar features at slightly different positions and different contrasts. We therefore believe that our detection is real.
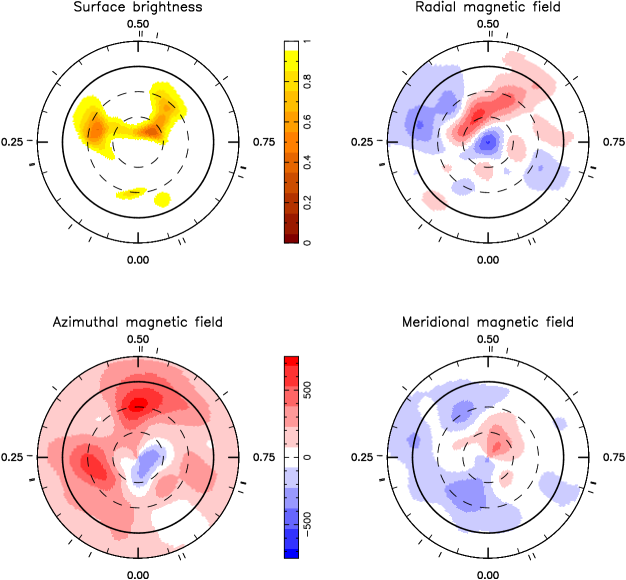
The surface brightness and magnetic map we derive (see Fig. 3) corresponds to a unit fit to the data (see Fig. 4), the initial (corresponding to an unspotted and non-magnetic star) being about 3.4 for 1080 data points in total. The brightness map is fairly simple and includes 2 main features at phases 0.30 and 0.60 with latitudes ranging from 30 to 70∘. In particular, V2247 Oph does not feature a polar cap like the conspicuous ones found, e.g., on the higher mass cTTS V2129 Oph (Donati et al., 2007) and BP Tau (Donati et al., 2008b). Spots large and dark enough to affect significantly the shape of Stokes LSD profiles do not cover more than 3.5% of the stellar surface, at least at the time of our observations. Given the significant rotational broadening in the spectrum of V2247 Oph, this result is well constrained and reliable and cannot be attributed to potential defects of surface imaging.
The large-scale magnetic field of V2247 Oph that we recover is also fairly different from those of V2129 Oph and BP Tau (Donati et al., 2007, 2008b); not only is the detected magnetic flux much weaker (about 300 G in average) but its topology is also fairly different, with a strong toroidal component (totalling about 60% of the magnetic energy, as obvious from Fig. 3) and a predominantly non-axisymmetric poloidal component (less than 30% of the poloidal field energy concentrating in modes with ). Moreover, the poloidal field is complex with about half of the poloidal field energy concentrating in modes with ; this is fairly obvious from the radial field component, featuring nearby regions of opposite polarities (see Fig. 3).
To investigate further the large-scale magnetic topology of V2247 Oph, we forced the code to recover fields that are either mainly symmetric or antisymmetric with respect to the centre of the star; this is achieved by favouring spherical harmonics modes of even or odd values respectively. We find that a symmetric field configuration is marginally more likely; in both cases though, the data can easily be fitted down to noise level and the recovered topologies in the visible hemisphere are very similar. The dipole component of the poloidal field is weak and strongly tilted with respect to the rotation axis; its polar strength ranges from 80 to 100 G and concentrates about 25–30% of the poloidal field energy (depending on the assumed symmetry properties).
Note that the intrinsic weakness of the dipole component on V2247 Oph is a reliable and well constrained result; in particular, it cannot be attributed to observational problems, e.g., to magnetic flux hiding in large high-contrast dark spots (absent on V2247 Oph at the time of our observations) or to flux cancellation from regions of opposite polarities (easily detected in the radial field component).
5 Activity & accretion
As usual for cTTSs, V2247 Oph exhibits in its optical spectrum a number of emission lines known to be proxies of activity and/or accretion – and in particular, the Balmer lines H and H, the He i line and the 849.8 nm line of the Ca ii IRT. The average equivalent widths that we measure in these proxies are equal to 137, 140, 8.5 and 12 km s-1 respectively, or equivalently 0.30, 0.23, 0.017 and 0.035 nm; they correspond to logarithmic line fluxes of 6.2, 5.8, 4.9 and 5.4 (with fluxes in erg s-1 cm-2), or equivalently –4.6, –5.0, –5.9 and –5.4 (with fluxes in ). From these, we derive an average logarithmic accretion luminosity (in ) of and a logarithmic mass accretion rate (in yr-1) of (Fang et al., 2009).
In this paper, we concentrate mostly on 3 proxies, H, H and the LSD average of all 3 Ca ii IRT lines (averaging out to an equivalent width of about 14 km s-1 or 0.04 nm). The He i line is dim and noisy and hardly usable for the present analysis. The complete series of profiles for all three proxies are shown in Fig. 5; small Stokes signatures are also detected in conjunction with the IRT lines.
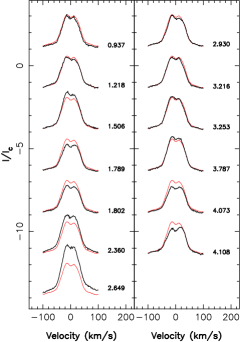
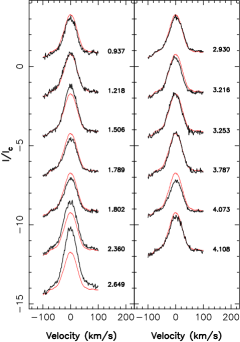
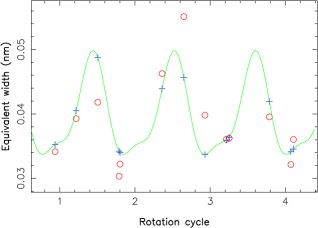
As obvious from Fig. 5, the accretion proxies feature a significant level of intrinsic variability. For instance, the amount of emission at cycle 1.789 is clearly different from that 2 full rotation cycles later (at cycle 3.787) in all 3 proxies; the emission peak detected at cycles 2.360 and 2.649 also seems fairly difficult to reconcile with emission fluxes at nearby phases in both the previous and following rotation cycles. To separate intrinsic variability from rotational modulation (generating mostly low frequency periodic variations), we propose the following procedure. We start by computing the equivalent widths of all 3 proxies as a function of rotation cycle (excluding the low quality data collected on 28 July) and fit them with a low-frequency periodic wave – hopefully retaining rotational modulation only and filtering out intrinsic variability; we then simply rescale all profiles to their fitted equivalent widths. While obviously no more than approximate, this procedure has the advantage of being very straightforward yet reasonably efficient333Our scaling procedure has little impact on the reconstructed maps and mostly aims at filtering out the discrepancies between the synthetic and observed profiles that the model was not designed to reproduce; in other words, it essentially makes the code convergence quicker and more reliable by emphasising the relevant contrasts in the landscape. .
The periodic wave we use to fit the equivalent widths is of the form:
| (2) |
where denotes the rotation cycle of each data point (as in Eq. 1) and , , and are the 6 free parameters of our model wave. We find that for the 3 proxies, the fit residuals show a very clear minimum for , i.e., for a period of about 3.8 d. Assuming that the differential rotation law derived in Sec. 4 also applies in the chromosphere (where accretion proxies supposedly form), it suggests that active and/or accreting regions mainly concentrate at intermediate latitudes of about 50∘. An example of the modelled rotational modulation in the particular case of the IRT is shown in Fig. 6.
By rescaling all IRT profiles to their fitted equivalent widths, we obtain a data set that can be added to that from photospheric lines (see Sec. 4) and further constrain the modelling of V2247 Oph. In that respect, we proceed as in previous work (Donati et al., 2007, 2008b) and assume that IRT emission includes both a quiet chromospheric contribution from the whole stellar surface as well as a stronger but more localised contribution from accretion regions. In previous work, we assumed (as a first guess) that accretion spots coincide with dark photospheric spots; we no longer use this approximation here and recover 2 completely independent distributions (in addition to the magnetic field), one giving the photospheric surface brightness (as in Sec. 4) and another one describing the amount of excess emission from accretion spots. The local emission line (modelled again using Unno-Rachkovsky’s equations) features a central wavelength, Doppler width and Landé factor of 850 nm, 7 km s-1 and 1.0 respectively. The intrinsic emission within accretion spots is (arbitrarily) assumed to be 10 times that within the quiet photosphere; the exact value of this ratio has little impact on the result, e.g., with smaller ratios producing only more contrasted accretion regions without noticeably changing their distribution.
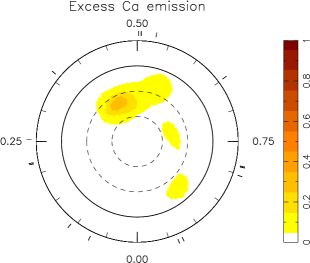
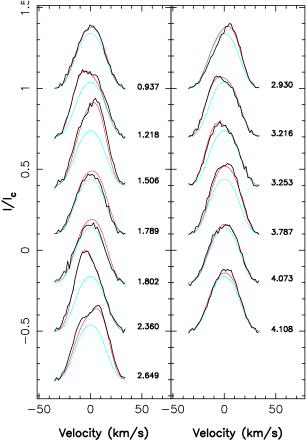
The surface distribution of excess IRT emission we obtain is shown in Fig. 7 while the corresponding fit to the Stokes and profiles is shown in Fig. 8. We find that excess IRT emission is concentrated in one main region located at phase 0.45 and latitude 45∘, and covering about 1.5% of the stellar surface; unsurprisingly, this result is compatible with the observed modulation of the Ca ii IRT core emission (peaking at phase 0.45 and fluctuating with a period corresponding to intermediate latitudes, see Fig. 6). The brightness and magnetic maps at photospheric level (as well as the corresponding fits to Stokes and LSD profiles) are virtually identical to those already shown in Sec. 4. The shapes of Stokes IRT profiles (and in particular the asymmetries) are well reproduced in our model, ensuring at the same time that the corresponding RVs (observed to vary by about km s-1 about the line centre) are also grossly fitted (see Fig. 9). Given how well correlated the equivalent width and RV curves are for the IRT line, H and H, we assume that the excess IRT emission spot we detect is also what generates the observed excess H and H emission.
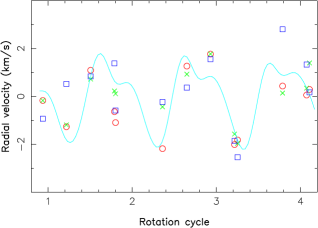
Worth noticing is that the average excess-emission spot latitude that we obtain (about 45∘) is much less than that one would derive from naively assuming that all emission comes from the accretion spot and hence that the semi-amplitude of the line RV variations is roughly given by (which would imply ∘). The excess emission from accretion spots (generating the RV variations) is actually mixed with the (constant and dominant) contribution from the quiet chromosphere (the light-blue line in the left panel of Fig. 8), thereby strongly reducing the observed amplitude of the RV variations. The shape of IRT profiles visually demonstrates this; the IRT line is not wiggling back and forth in velocity space as a whole (as expected from emission concentrating in a localised accretion spot) but features a roughly constant centroid and width at about 10% height (as expected when the whole star significantly contributes to emission through a quiet chromosphere). We thus (unsurprisingly) conclude that, fitting emission line profiles (whenever possible) is much more efficient and reliable than modelling RV variations only, for mapping accretion spots at the surfaces of cTTSs.
6 Summary and discussion
We presented in this paper the first magnetic map for the low-mass cTTS V2247 Oph. This is the lowest mass cTTS to be magnetically imaged yet; despite it being in a low-state of accretion (with with expressed in yr-1), this study brings a number of new and unexpected results.
The brightness distribution we derive at the surface of V2247 Oph (from the rotational modulation of Stokes photospheric LSD profiles) is relatively simple, with dark spots covering about 3.5% of the total surface; in particular, it does not feature a highly-contrasted dark polar spot as seen, e.g., on V2129 Oph (Donati et al., 2007), BP Tau (Donati et al., 2008b) or other cTTSs (Hussain et al., 2009). It is however roughly similar to what is found on low-mass fully-convective dwarfs where large-scale spots are usually low-contrast and cover only a small fraction of the stellar surface (e.g., Morin et al., 2008a).
We also detect clear Zeeman signatures from V2247 Oph, tracing a rather complex and moderately strong multipolar large-scale magnetic topology with an average strength of 300 G and a mixed amount of poloidal and toroidal field; the poloidal field is mostly non-axisymmetric and features a weak (tilted) dipole component of about 80–100 G. Again, this is fairly different from what is seen on intermediate-mass cTTSs like BP Tau, where the field is far simpler, predominantly poloidal, axisymmetric with a dipole component exceeding 1 kG (Donati et al., 2008b). This is also in contrast to low-mass fully-convective mid-M dwarfs (e.g., Morin et al., 2008b) that almost always exhibit very intense, mainly potential large-scale fields with a simple topology roughly aligned with the rotation axis. New results however indicate that a significant fraction of very-low-mass dwarfs (late-M dwarfs with , i.e., below about half the mass threshold for full convection on the main sequence) are found to host moderate and complex non-axisymmetric large-scale magnetic fields (Morin et al 2009, in preparation), very different from the strong and simple fields of mid-M dwarfs. Although V2247 Oph is significantly more massive (at 0.35 ) than late-M dwarfs, the difference in evolutionary stage may easily compensate for the discrepancy; the mass of V2247 Oph is indeed also lower than half the mass threshold for full convection at an age of about 1 Myr. Further observations are of course needed to confirm whether this analogy truly holds; if so, it would bring additional evidence that magnetic fields of intermediate- and low-mass cTTSs are similar in nature to those of mid-M and late-M dwarfs and are thus produced through dynamo processes (rather than being fossil leftovers from an earlier formation stage).
In addition, we find that the spot distribution and the magnetic field of V2247 Oph evolve on a very short timescale, of order one week; in both cases, this evolution is compatible with surface differential rotation shearing the photosphere 5 to 6 times faster than on the Sun, with the equator lapping the pole by one complete rotation every d. This is again fairly unexpected since all fully-convective stars have been reported to show little to no differential rotation up to now (e.g., Donati et al., 2006a; Morin et al., 2008a, b). Only late F stars with very shallow convective zones are yet known to exhibit a similar degree of photospheric shear (e.g., Donati et al., 2008a). Further confirmation from new data sets on V2247 Oph (and other similar low-mass cTTSs) are thus needed to validate this surprising result.
The amount of differential rotation we estimate is compatible with the range of photometric periods measured on V2247 Oph over the last 2 decades (from 3.4 to 3.6 d, implying rad d-1, Grankin et al., 2008). Given the differential rotation law we derive, these periods suggest that spots preferentially cluster at low to intermediate latitudes (15–40∘) on V2247 Oph; this is at least qualitatively compatible with the fact that no high-contrast polar spot is present at the surface. This is the first time that differential rotation is detected on a cTTS; the recent claim (Herbst et al., 2006) that the high-mass cTTS HBC 338 (spectral type G9) is differentially rotating (given the observed variations of the photometric period) needs confirmation, cTTSs with massive accretion discs being prone to photometric perturbations (including sudden changes of the light-curve period) likely caused by accretion (e.g., Simon et al., 1990; Donati et al., 2008b) rather than resulting from differential rotation.
Finally, we find that V2247 Oph features a region of excess IRT (and H and H) emission at phase 0.45 and intermediate latitude. There is no obvious correlation between the location of this emission region and the cool spots mapped from the distorted LSD profiles of photospheric lines; however, we find that it roughly coincides with one of the strongest field region detected on V2247 Oph, the positive radial field spot whose magnetic flux reaches about 0.5 kG. We speculate that this spot may be the footpoint of an accretion funnel linking the star to its accretion disc at the time of our observations. If confirmed, we expect such accretion funnels to be rather short lived, with differential rotation continuously distorting the magnetic connections between the star and the disc as well as the stellar field itself. In particular, this effect may be partly responsible for the sporadic accretion episodes observed on V2247 Oph, with more intense accretion episodes occurring when the magnetic topology linking the star to the disc is favouring accretion.
In addition to the differences in their magnetic topologies, V2247 Oph and BP Tau show quite distinct rotational properties; as emphasised in Sec. 2, each of them belongs to a distinct population of young stars (Lamm et al., 2005), V2247 Oph to the low-mass cTTSs with short rotation period (of about half a week in average) while BP Tau to the intermediate-mass cTTSs with long rotation periods (of about one week in average). These two issues may relate together, i.e., the magnetic topology may have an impact on the rotation period through a coupling mechanism such as, e.g., the well-known disc-locking picture (Camenzind, 1990; Königl, 1991). In this model, the rotation period at the surface of the star settles close to the Keplerian period of the point in the disc (called the Alfven radius and noted ) where the ram pressure of the average accretion flow roughly equals the magnetic pressure of the largest-scale (i.e., the dipole component) poloidal field (e.g., Bessolaz et al., 2008). Using Eq. 1 of Bessolaz et al. (2008) (with set to the average dipole field strength at the rotation equator, i.e., about 40 G for V2247 Oph), we estimate ; we can also work out that the radius at which the Keplerian period matches the average rotation period (called the corotation radius and noted ) is equal to for V2247 Oph. Both estimates roughly agree with each other, suggesting a reasonable agreement with the disc-locking model predictions.
Comparing directly with BP Tau however (and assuming a logarithmic mass accretion rate of –7.5 taken from the literature as in Donati et al., 2008b), the model predicts that both stars should have similar and thus behave similarly with respect to the disc-locking mechanism, the 15-fold weaker dipole field of V2247 Oph being almost compensated by the 200-fold weaker mass accretion rate; re-estimating for BP Tau using the same procedure as for V2247 Oph, we actually find a much smaller value, equal to . While it is not clear whether this new estimate is more accurate than the one used previously, it is at least more consistent with the one we derived for V2247 Oph when it comes to comparing both stars; in this case, we obtain that for BP Tau (taking G) in reasonable agreement with .
Obviously, more stars of different masses and rotation periods, and with consistent estimates of and , are needed to assess the validity of the disc-locking picture; if confirmed, it may ultimately explain why low-mass cTTSs rotate in average faster than their intermediate mass equivalents. The MaPP program should bring new results along this line in the near future.
Acknowledgements
We thank the CFHT/QSO staff for their efficiency at collecting data; we are also grateful for valuable comments from an anonymous referee that contributed to improve the paper. This work was supported by the French “Agence Nationale pour la Recherche” (ANR) within the “Magnetic Protostars and Planets” (MaPP) project.
References
- André et al. (2008) André P., Basu S., Inutsuka S.-i., 2008, ArXiv e-prints
- Bessolaz et al. (2008) Bessolaz N., Zanni C., Ferreira J., Keppens R., Bouvier J., 2008, A&A, 478, 155
- Bouvier et al. (2007) Bouvier J., Alencar S. H. P., Harries T. J., Johns-Krull C. M., Romanova M. M., 2007, in Reipurth B., Jewitt D., Keil K., eds, Protostars and Planets V Magnetospheric Accretion in Classical T Tauri Stars. pp 479–494
- Bouvier & Appenzeller (1992) Bouvier J., Appenzeller I., 1992, A&AS, 92, 481
- Bouvier & Bertout (1989) Bouvier J., Bertout C., 1989, A&A, 211, 99
- Bouvier et al. (1986) Bouvier J., Bertout C., Benz W., Mayor M., 1986, A&A, 165, 110
- Camenzind (1990) Camenzind M., 1990, in Klare G., ed., Reviews in Modern Astronomy Vol. 3 of Reviews in Modern Astronomy, Magnetized Disk-Winds and the Origin of Bipolar Outflows.. pp 234–265
- Cieza et al. (2007) Cieza L., Padgett D. L., Stapelfeldt K. R., Augereau J.-C., Harvey P., Evans II N. J., Merín B., Koerner D., Sargent A., van Dishoeck E. F., Allen L., Blake G., Brooke T., Chapman N., et al., 2007, ApJ, 667, 308
- Donati (2003) Donati J.-F., 2003, in Trujillo-Bueno J., Sanchez Almeida J., eds, Astronomical Society of the Pacific Conference Series Vol. 307 of Astronomical Society of the Pacific Conference Series, ESPaDOnS: An Echelle SpectroPolarimetric Device for the Observation of Stars at CFHT. pp 41–+
- Donati et al. (2003) Donati J.-F., Collier Cameron A., Petit P., 2003, MNRAS, 345, 1187
- Donati et al. (2006a) Donati J.-F., Forveille T., Cameron A. C., Barnes J. R., Delfosse X., Jardine M. M., Valenti J. A., 2006a, Science, 311, 633
- Donati et al. (2006b) Donati J.-F., Howarth I. D., Jardine M. M., Petit P., Catala C., Landstreet J. D., Bouret J.-C., Alecian E., Barnes J. R., Forveille T., Paletou F., Manset N., 2006b, MNRAS, 370, 629
- Donati et al. (2007) Donati J.-F., Jardine M. M., Gregory S. G., Petit P., Bouvier J., Dougados C., Ménard F., Cameron A. C., Harries T. J., Jeffers S. V., Paletou F., 2007, MNRAS, 380, 1297
- Donati et al. (2008b) Donati J.-F., Jardine M. M., Gregory S. G., Petit P., Paletou F., Bouvier J., Dougados C., Ménard F., Cameron A. C., Harries T. J., Hussain G. A. J., Unruh Y., Morin J., Marsden S. C., Manset N., Aurière M., Catala C., Alecian E., 2008b, MNRAS, 386, 1234
- Donati et al. (2008c) Donati J.-F., Morin J., Petit P., Delfosse X., Forveille T., Aurière M., Cabanac R., Dintrans B., Fares R., Gastine T., Jardine M. M., Lignières F., Paletou F., Velez J. C. R., Théado S., 2008c, MNRAS, 390, 545
- Donati et al. (2008a) Donati J.-F., Moutou C., Farès R., Bohlender D., Catala C., Deleuil M., Shkolnik E., Cameron A. C., Jardine M. M., Walker G. A. H., 2008a, MNRAS, 385, 1179
- Donati et al. (1997) Donati J.-F., Semel M., Carter B. D., Rees D. E., Collier Cameron A., 1997, MNRAS, 291, 658
- Fang et al. (2009) Fang M., van Boekel R., Wang W., Carmona A., Sicilia-Aguilar A., Henning T., 2009, ArXiv e-prints
- Grankin et al. (2008) Grankin K. N., Bouvier J., Herbst W., Melnikov S. Y., 2008, A&A, 479, 827
- Gras-Velázquez & Ray (2005) Gras-Velázquez À., Ray T. P., 2005, A&A, 443, 541
- Hall (1991) Hall D. S., 1991, in Tuominen I., Moss D., Rüdiger G., eds, IAU Colloq. 130: The Sun and Cool Stars. Activity, Magnetism, Dynamos Vol. 380 of Lecture Notes in Physics, Berlin Springer Verlag, Learning about stellar dynamos from long-term photometry of starspots. pp 353–+
- Herbst et al. (2006) Herbst W., Dhital S., Francis A., Lin L., Tresser N., Williams E., 2006, PASP, 118, 828
- Hussain et al. (2009) Hussain G. A. J., Collier Cameron A., Jardine M. M., Dunstone N., Velez J. R., Stempels H. C., Donati J.-F., Semel M., Aulanier G., Harries T., Bouvier J., Dougados C., Ferreira J., Carter B. D., Lawson W. A., 2009, MNRAS, pp 997–+
- Johns-Krull (2007) Johns-Krull C. M., 2007, ApJ, 664, 975
- Johns-Krull et al. (1999) Johns-Krull C. M., Valenti J. A., Koresko C., 1999, ApJ, 516, 900
- Königl (1991) Königl A., 1991, ApJ, 370, L39
- Kurucz (1993) Kurucz R., 1993, CDROM # 13 (ATLAS9 atmospheric models) and # 18 (ATLAS9 and SYNTHE routines, spectral line database). Smithsonian Astrophysical Observatory, Washington D.C.
- Lamm et al. (2005) Lamm M. H., Mundt R., Bailer-Jones C. A. L., Herbst W., 2005, A&A, 430, 1005
- Landi degl’Innocenti & Landolfi (2004) Landi degl’Innocenti E., Landolfi M., 2004, Polarisation in spectral lines. Dordrecht/Boston/London: Kluwer Academic Publishers
- Littlefair et al. (2004) Littlefair S. P., Naylor T., Harries T. J., Retter A., O’Toole S., 2004, MNRAS, 347, 937
- Mamajek (2008) Mamajek E. E., 2008, Astronomische Nachrichten, 329, 10
- Mohanty et al. (2005) Mohanty S., Jayawardhana R., Basri G., 2005, ApJ, 626, 498
- Morin et al. (2008a) Morin J., Donati J.-F., Forveille T., Delfosse X., Dobler W., Petit P., Jardine M. M., Cameron A. C., Albert L., Manset N., Dintrans B., Chabrier G., Valenti J. A., 2008a, MNRAS, 384, 77
- Morin et al. (2008b) Morin J., Donati J.-F., Petit P., Delfosse X., Forveille T., Albert L., Aurière M., Cabanac R., Dintrans B., Fares R., Gastine T., Jardine M. M., Lignières F., Paletou F., Ramirez Velez J. C., Théado S., 2008b, MNRAS, 390, 567
- Padgett et al. (2008) Padgett D. L., Rebull L. M., Stapelfeldt K. R., Chapman N. L., Lai S.-P., Mundy L. G., Evans II N. J., Brooke T. Y., Cieza L. A., Spiesman W. J., Noriega-Crespo A., McCabe C.-E., Allen L. E., et al., 2008, ApJ, 672, 1013
- Schevchenko & Herbst (1998) Schevchenko V., Herbst W., 1998, AJ, 116, 1419
- Siess (2001) Siess L., 2001, in T. Montmerle & P. André ed., From Darkness to Light: Origin and Evolution of Young Stellar Clusters Vol. 243 of Astronomical Society of the Pacific Conference Series, Uncertainties Associated with Mass and Age Determination of Pre-Main Sequence Stars. pp 581–+
- Siess et al. (2000) Siess L., Dufour E., Forestini M., 2000, A&A, 358, 593
- Simon et al. (1987) Simon M., Howell R. R., Longmore A. J., Wilking B. A., Peterson D. M., Chen W.-P., 1987, ApJ, 320, 344
- Simon et al. (1990) Simon T., Vrba F., Herbst W., 1990, AJ, 100, 1957
- Snell et al. (1980) Snell R. L., Loren R. B., Plambeck R. L., 1980, ApJL, 239, L17