Relativistic disc reflection in the extreme NLS1 IRAS 13224–3809
Abstract
We present a spectral variability study of the XMM-Newton and Suzaku observations of one of the most extreme Narrow Line Seyfert 1 galaxies, IRAS 13224–3809. The X-ray spectrum is characterized by two main peculiar features, i) a strong soft excess with a steep rise below about 1.3 keV and ii) a deep drop in flux above 8.2 keV. Although absorption–based interpretations may be able to explain these features by a suitable combination of ionization, covering factors, column densities and outflowing velocities, we focus here on a reflection–based interpretation which interprets both features, as well as the large soft excess, in terms of partially ionized reflection off the inner accretion disc. We show that the two peculiar spectral features mentioned above can be reproduced by two relativistic emission lines due to Fe K and Fe L. The lines are produced in the inner accretion disc and independently yield consistent disc parameters. We argue that the high L/K intensity ratio is broadly consistent with expectations from an ionized accretion disc reflection, indicating that they belong to a single ionized reflection component. The spectral shape, X–ray flux, and variability properties are very similar in the XMM-Newton and Suzaku observations, performed about 5 years apart. The overall X–ray spectrum and variability can be described by a simple two–component model comprising a steep power law continuum plus its ionised reflection off the inner accretion disc. In this model, a rapidly rotating Kerr black hole and a steep emissivity profile are required to describe the data. The simultaneous detection of broad relativistic Fe L and K lines in IRAS 13224-3809 follows that in another extreme NLS1 galaxy, 1H 0707–495. Although the data quality for IRAS 13224–3809 does not allow us to rule out competing models as in 1H 0707–495, we show here that our reflection-based interpretation describes in a self–consistent manner the available data and points towards IRAS 13224–3809 being a very close relative of 1H 0707–495 in terms of both spectral and variability properties. These results, together with those based on pure broad Fe K detections, are starting to unveil the processes taking place in the immediate vicinity of accreting radiatively efficient black holes.
keywords:
galaxies: individual: IRAS 13224-3809 – galaxies: active – galaxies: Seyfert – X-rays: galaxies1 Introduction
There is little doubt that narrow-line Seyfert 1 (NLS1) galaxies provide an extreme view of the AGN phenomenon (e.g. Boller et al. 1996, 2002; Brandt et al. 1997; Fabian et al. 2002, 2004; Gallo 2006; Gierlinski et al. 2008). A strong soft excess below 2 keV and significant X-ray variability are often seen, and with XMM-Newton came the discovery of high-energy spectral drop and curvature in some objects (e.g. Boller et al. 2002, 2003). The physical interpretation is a topic of debate, and the suggestions are as extreme as the objects themselves involving relativistically blurred reflection (e.g. Fabian et al. 2002, 2004; Ponti et al. 2006) or ionised absorption (Gierlinski & Done 2004; Middleton et al. 2007), and partial covering (Tanaka et al. 2004, 2005) that may be outflowing (Gallo et al. 2004a). A breakthrough was the discovery of broad iron (Fe) L emission and reverberation-like time lags in a long observation of 1H 0707–495 (Fabian et al. 2009). Confirmation of this type of behaviour in other objects would bolster the importance of NLS1s in understanding the innermost regions of AGN.
IRAS 13224–3809 () along with 1H 0707–495 are perhaps the most remarkable members of this class, displaying the above properties in outstanding fashion. In many ways IRAS 13224–3809 and 1H 0707–495 are very similar objects, especially in the X–ray band. They both show a high energy Fe K drop around 7-8 keV implying either an outflowing partial covering absorber or a large emission line (Boller et al. 2002; Fabian et al. 2004; Boller et al. 2003). In both cases the material producing the structure must be iron overabundant with respect to the Sun. They also have large soft excesses (Ponti PhD thesis) with sharp drops around 1 keV (Leighly 1999). Moreover they show a high degree of variability indicating low black hole masses and high accretion rates.
The motivation of this present work is to examine IRAS 13224–3809 in the light of the discoveries from the new observations of 1H 0707–495 (Fabian et al. 2009). To do so we make use of a previously analysed XMM-Newton observation (e.g. Boller et al. 2003; Gallo et al. 2004b; Ponti et al. 2006) along with a new Suzaku observation. The purpose here is not to duplicate previous efforts by fitting the spectra with partial-covering (or other absorption models) and reflection models and comparing quality of fits. Rather, our goal is to test the robustness of the reflection model and show it to be a valid interpretation, similar to that used for 1H0707-495.
2 Observation and data reduction
2.1 The XMM-Newton observation
IRAS 13224–3809 was observed with XMM–Newton on 2002 January 19 for about 64 ks. A detailed description of the observation and data analysis was presented in Boller et al. (2003) and Gallo et al. (2004), and we will briefly summarise details that are important to the analysis here. Spectral files were created from the original ODF using the SAS version 7.1.0. The EPIC pn and both MOS cameras were operated in full–frame and large–window mode, respectively. The MOS1 and MOS2 spectra are affected by high background at energies greater than 6 keV, so, we did not consider MOS data in the analysis, but used these data only as a check of consistency. We analysed the RGS spectra, but the statistics hampers the detection of narrow absorption and/or emission features. Negligible pile up (checked with the epatplot command) is present in the data and it does not affect the spectral results. The total mean EPIC-pn count rate is 2.348 cts/s, and even the brightest flares are well below the maximum pile-up free count rate that can be achived in the full–frame EPIC pn science mode (8 cts/s; Ehle et al. 2003). Consistent spectral shapes are obtained whether considering single events only or single and double events. Thus, for this study, we selected the latter. The source plus background photons were extracted from a circular region with a radius of 32 arcsec. The background spectrum was extracted from source–free regions on the same chip as the source. With the SAS commands ARFGEN and RMFGEN ancillary and response files were created. After filtering periods of high background (the biggest flare occurred approximately 20 ks after the beginning of the observation and lasted for a few ks, see Fig. 2) we obtain net exposures of about 50 ks. The total observed flux is 510-13 ergs cm-2 s-1 and 2.310-12 ergs cm-2 s-1 in the 2-10 keV and 0.5-10 keV band, respectively. The count rate for the pn detector is 2.348 and 0.022 cts/s for the source and background. In our analysis the pn data has been considered in the 0.3-10 keV band.
The Optical Monitor (OM) data have been analysed starting from the Pipeline Products (PPS). Seven and 15 exposures were taken through the UVW2 filter and the UV Grism, respectively. We only present here the analysis of the images observed with the UVW2 filter because of the low signal to noise of the grating observations. The OM UVW2 flux has been corrected for Milky Way (Galactic) reddening. The UV data have been converted into xspec spectra files using flx2xps utility, part of the ftools package.
2.2 The Suzaku observation


We observed IRAS 13224–3809 with the Suzaku X-ray Telescope. The 200 ks run started on 2007 January 26 at 05:48:34 and ended on 2007 January 26 at 02:02:19 (UT). During the time the two front-illuminated (FI) XIS detectors (XIS0 and XIS3) and the single back-illuminated (BI) CCD (XIS1) operated in standard pointing mode with the target centred on the detectors (XIS nominal pointing). Event files were extracted from version 2.1.6.15 pipeline processing, using a large region of 260 arcsec, as suggested by the ABC Guide111http://heasarc.gsfc.nasa.gov/docs/suzaku/analysis/abc/, in order to prevent calibration problems. Background counts were extracted from annuli between 345 and 470 arcsec. Spectra and light curves were generated using XSELECT. Response matrices and auxiliary response files were created using XISRMFGEN and XISSIMARFGEN (version 2007-05-14), respectively. The spectra from the two FI CCDs were examined separately and found to be consistent with each other within uncertainties. Consequently, the XIS0 and XIS3 data were merged to create a single FI spectrum. The HXD-PIN data were processed in the standard way, but the source was not detected by the instrument. The total observed flux is 710-13 ergs cm-2 s-1 and 2.410-12 ergs cm-2 s-1 in the 2-10 keV and 0.5-10 keV band, respectively. The count rate for the XIS0, XIS1 and XIS3 detectors are 0.156 cts/s (0.037), 0.299 cts/s (0.089) and 0.144 cts/s (0.031) for the source (background), respectively. In our analysis we considered the energy band 0.4-10 keV for the XIS1 and 0.7-10 keV for the summed XIS0 plus XIS3. Above and below this range, deviations from reasonable models are found, indicative of calibration uncertainties.
2.3 Joint analysis
In the subsequent spectral analysis, source spectra were grouped such that each bin contained at least 20 counts and errors are quoted at the 90 per cent confidence level (=2.7 for one interesting parameter). Spectral fitting was performed using XSPEC 11.3.0. All parameters are reported in the rest frame of the source unless specified otherwise and all fits include Galactic absorption with the column density fixed at its nominal value (5.31020 cm-2; Kalberla et al. 2005).
3 A comparison of the XMM-Newton and Suzaku data
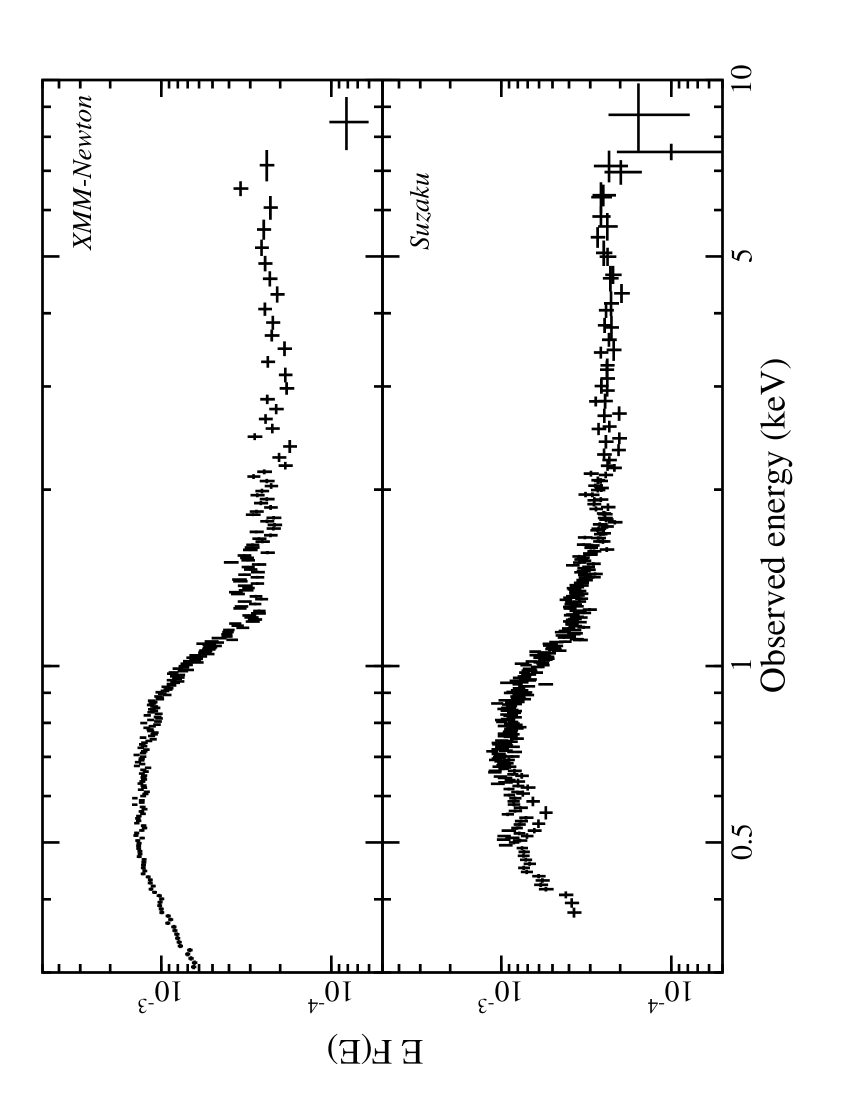
The XMM-Newton and Suzaku observations are separated by nearly five years, but nevertheless appear very similar both in terms of brightness and shape (see Fig. 1). This is interesting considering the extreme spectral variability this object experiences on short (hourly) time scales (e.g. Fig. 2). The XMM-Newton data show a clear feature in the Fe K band that can be reproduced by an absorption edge with energy E keV and (Boller et al. 2003). The sharp drop above 8 keV is difficult to detect in the Suzaku spectra as the source starts to become background dominated at those energies, however there are indications of it (, for the addition of 2 new parameters222We observe that the drop is better detected (, for the addition of 2 new parameters) when the spectra are extracted from a circular region with 2 arcmin radius (smaller than the standard 4.3 arcmin radius), in this way reducing the impact of the background. Nevertheless, in order to avoid calibration problems of the instrument effective area, in the following analysis we consider the results obtained with the standard 260 arcsec extraction radius. ; see also lower panel of Figure 1). Of certainty is that the feature has not shifted strongly downward in energy. The marginally detected keV emission line seen in the XMM-Newton observation (Boller et al. 2003) is not detected in the Suzaku spectrum with an upper limit on its intensity of ph cm-2 s-1 and on the equivalent width of 110 eV.
While the effective exposure was only three times longer during the Suzaku observation, the duration of the observations was substantially longer (over four days compared to three-quarters of a day for the XMM-Newton observation). Consequently, there was a possibility to examine variability on different time scales. Despite this, the XMM-Newton and Suzaku light curves look similar (Figure 2), displaying persistent variability with the largest outbursts being by a factor of . In addition, the shapes of the rms spectra (see Figure 3) are nearly identical with about a constant amount of variability in the 0.2-0.7 keV band, a peak between 1 and 2 keV and lower variability at higher energies, with a drop around 5-6 keV. This does suggest that the processes dominating the variability on short (hourly) time scales are likely the same as those which dominate on daily time scales. The main difference between the two rms spectra is tied to the amplitude of the drops. During the XMM-Newton observation the variability at low energy is about half that at the peak, while during the Suzaku pointing the drop is only of the order of 20 per cent. This difference can be explained by the presence of a stronger constant component during the XMM-Newton observation (see §5.2 and Fig. 11).
Noteworthy, is that the huge amplitude (factor of ) outbursts recorded by (Boller et al. 1996) have never been seen since (Dewangan et al. 2002; Gallo et al. 2004b; this paper).
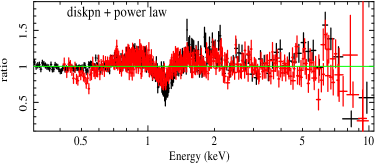
4 UV-soft X-ray emission: a standard disc black body component?
We first note that a simple power law model fails to reproduce the X-ray source emission because of the large soft excess. We thus add the contribution from a disc black body emission component (diskpn, Makishima et al. 1986; Gierlinski et al. 1999). Large residuals are still present at 1.3 keV and between 7 and 8 keV (see Fig. 4). The black body component is, however, able to reproduce the soft excess emission. The best fit inner disc temperatures (assuming an inner disc radius of 6 rg) are T keV and T keV for the XMM-Newton and Suzaku data, respectively. The best fit luminosity of the disc black body component is L and erg s-1.
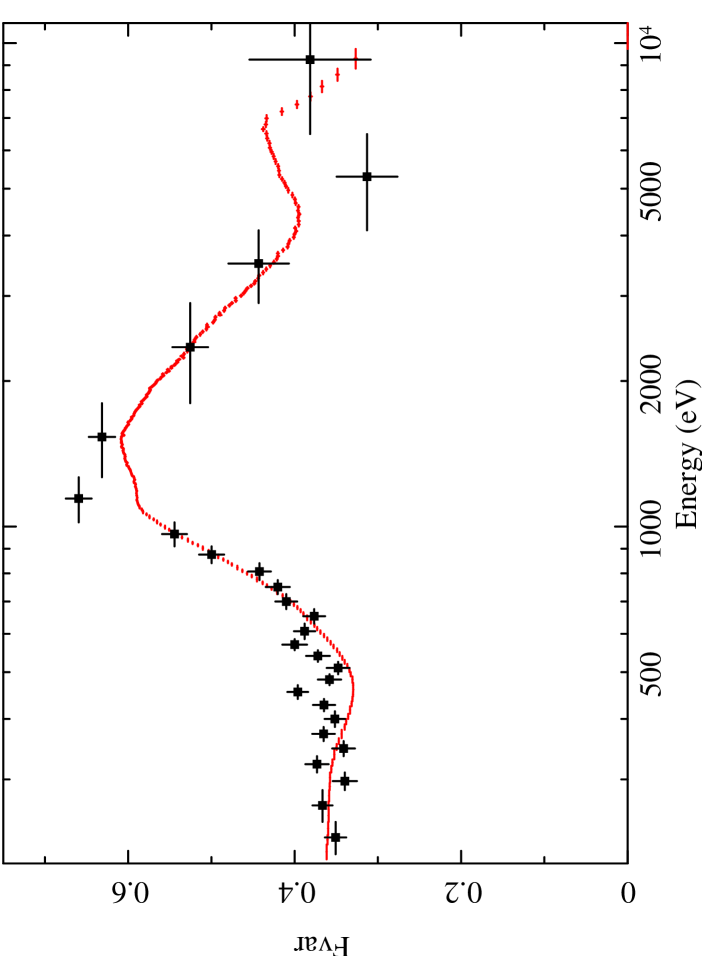
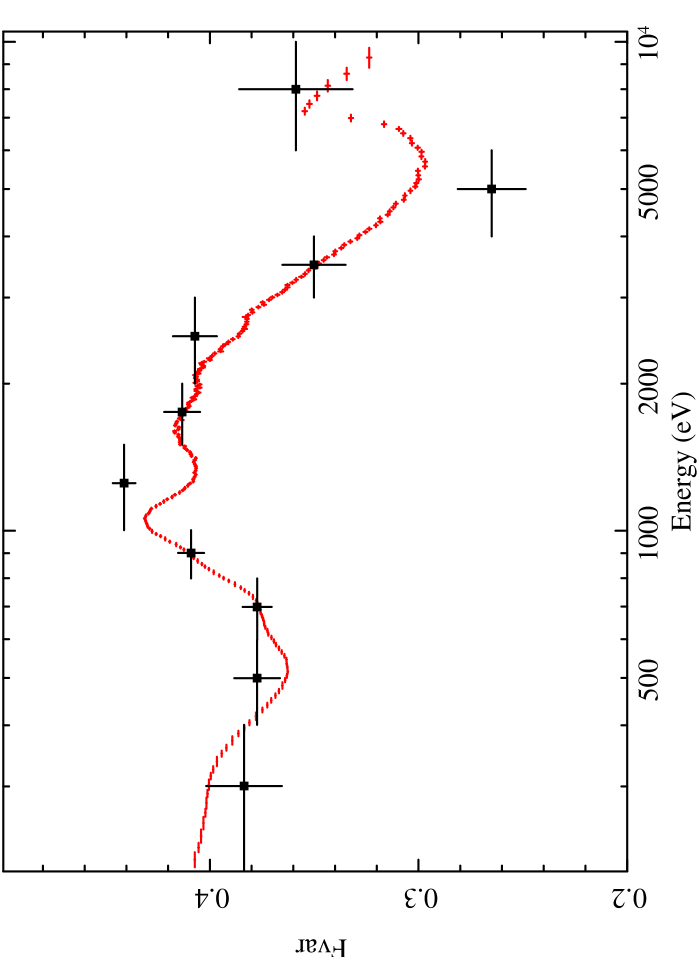
Figure 5 shows the XMM-Newton (EPIC-pn) and the simultaneous OM UVW2333 We also compared the OM data with the HST STIS, taken from Leighly & Moore (2004). The two UV data-sets agree well with each other, despite being acquired several years apart. We also note that the STIS spectrum shows a flattening at lower energies, where the strong starburst component becomes important (Leighly 2004). spectra. The solid line shows the un-absorbed disc black body component (diskpn) best fitting the soft X–ray excess emission. Once that this component is extrapolated in the UV band, it fails in reproducing the strong source UV emission. In other words, if the disc black body is responsible for the soft X–ray excess, the UV flux is severely underestimated and cannot be accounted for by the model.

We then fitted the UV and 2–10 keV data as described in Vasudevan & Fabian (2007; 2009)444The authors use a diskpn model assuming an inner radius of 6 rg.. The black hole mass of IRAS13224-3809 is not well known. The fast and high degree of variability suggests a small BH mass (M0.7-1 M⊙; Ponti et al. in prep.), while considerations based on the high source bolometric luminosity and the ultraviolet emission/absorption components suggest a MBH from about to M⊙ (Leighly & Moore 2004; Leighly 2004; Wang et al. 2004). To study the impact of the uncertainty associated with the poor knowledge of the BH mass, we consider three cases with BH masses of , and M⊙. The dotted lines in Fig. 5 show the best fit model reproducing the UV and 2-10 keV spectra555Similar results are obtained considering the power law emission in the 2-3 and 8-10 keV bands only. for the different BH masses. If a BH mass of 107 or 108 M⊙ is assumed, it is not possible to reproduce the soft excess with a standard disc black body component because the disc temperature is too low. On the other hand a lower BH mass, in order to fit the UV data, would imply an un-physically high Eddignton accretion rate (L/L for a 106 M⊙, L/L for a 107 M⊙).
The dashed line in Fig. 5 shows the best fit model assuming a BH mass of 5.6106 M⊙ (Wang et al. 2004). In this case a super-Eddington accretion is required (), however a still hotter black body temperature is required to fit the soft excess.
Modification to the disc black body emission due to atomic processes (in particular hydrogen and helium) are an interesting possibility. In fact in AGN, due to the low free-free and bound-free opacities in the soft X-ray regime (that allow the diffusion of photons from large Thomson depths below the disc surface), a high energy tail is generated in addition to the standard UV disk black body shape. However, this component, having a too low intensity and ”temperature” (the expected maximum temperature being 50-60 eV), can not explain the soft excess emission of IRAS 13224-3809 (Ross et al. 1992).
Alternatively, as already explored by Gierlinski & Done (2004), a second lower temperature Comptonization medium (with lower energy electrons compared to the ones producing the power law emission above 2 keV) may fit the soft excess spectral shape. IRAS13224-3809 makes no exception. Nevertheless, we obtain (fitting the soft excess with a Comptonization component compST in Xspec) an electron temperature T keV and an optical depth . These values fall within the narrow range of values observed by Gierlinski & Done (2004) analysing the soft excess of a large sample of AGN. They observed clustering of all the measured temperatures and optical depths to a narrow range of values that poses serious doubts on the second Comptonisation hypothesis for the soft excess (Gierlinski & Done 2004) and brought the authors to exclude this hypothesis. Thus, although the model can explain the soft excess in any single source, it seems to fail when the big picture is considered. Moreover, we stress that although soft state spectra of GBH can be modelled by two media of Comptonised electrons, the observed optical depth, in that case, is definitely smaller than (as required here) resulting in a far smoother shape of the soft excess, than the one observed here.
The main conclusion drawn from this exercise is that a unique disc black body component can not reproduce both the UV and soft X-ray data. The most likely situation is then that a thermal accretion disc component is responsible for most (if not all) of the UV emission, while the soft X-ray emission has a different physical origin.
This is in agreement with the observation that in AGN, in general, when the soft excess is fitted with a disc black body component, the resulting temperature is observed to be too high and with a too small scatter, compared with expectations (only in the smaller mass and higher accretion rate AGN the Wien tail of the disc emission is expected to be observed in the soft X-ray band). For this reason many works suggest that the real origin is tied to ionised absorbing/reflecting material (Gierlinski & Done 2004; Crummy et al. 2006). Furthermore, in observations allowing us to study the X–ray variability of this putative thermal component, the expected blackbody relationship is not recovered, casting further doubts on this interpretation (e.g. Ponti et al. 2006).
5 Ionised absorption
Alternatively to the disc black body emission (or cold Comptonization) thermal models, the entire soft excess may be attributed to the effect of partially ionized gas in the line of sight, absorbing the X–ray continuum which would be then intrinsically more intense and significantly steeper than observed in the 2–10 keV range. As shown by Boller et al. (2003), the high energy drop at about 8 keV can indeed be produced by a neutral outflowing absorber partially covering the source. Iron overabundance is required to fit the feature. Alternatively, a partial covering ionised absorber, similar to the one suggested for 1H0707-495 (Done et al. 2007), may explain the high energy feature of IRAS13224-3809, although the edge seems too sharp to be produced by partially ionized gas.
Nevertheless, we note that to fit the source spectrum below 2 keV two additional components are needed, an emission one (either a disc black body or a second power law) for the soft excess and another different absorption component to fit the 1.3 keV structure. We thus fit the spectrum with a power law plus a disc black body emission absorbed by two ionised partial covering components666We used the same grid of models as Zoghbi et al. (2010), generated through the XSTAR photoionisation code (Kallman et al. 1996). The models have abundances fixed to Solar and the illuminating flux has a steep power law index of 3. The fitting parameters are the absorber column density, ionisation parameter, covering factor and Fe abundance.. With one absorber roughly reproducing the high–energy drop as in Boller et al. (2003), while the second absorber can reproduce the low energy structure only if significant blue-shifting (0.15-0.3 c) is allowed (fitting the structure with either O VIII or Fe M UTA). No good fit was found with lower outflow velocities. The main reason is that the model tries to fit the apparent drop below 1 keV with an L-shell iron edge, requiring high iron abundances. However, as Fig. 6 shows, this predicts a drop between 0.7 and 0.9 keV due to the M-shell unresolved transition array (UTA) (Fabian et al. 2009; Zoghbi et al. 2010). This is a blend of numerous absorption lines arising from the photo-excitation of ions FeI -FeXVI mainly produced by 2p-3d transitions (Behar et al. 2001). Moreover the absorption-dominated model still requires a blackbody to model the soft excess.
As mentioned in 1, the purpose of this paper is not to fit the complex X–ray spectrum of IRAS 13224–3809 with all possible models and compare the best–fitting . Our goal is to seek the simplest possible solution that can explain both the spectral and variability properties with a minimal set of assumptions. We suspect that combining the soft blackbody and the power law with further layers of partial covering absorbers with different column densities, ionization stages, covering factors, and with unrelated outflowing velocities could easily provide a fair description of the X–ray spectrum. However, the model would be poorly constrained because of its complexity and would not improve our understanding of the source. We thus consider here a different interpretation of the X–ray properties of IRAS 13224–3809 with the goal of describing the data with a minimal set of physically connected model components.
6 Signatures of disc reflection?
The X-ray spectrum of 1H0707-495 shows similar features at 1.3 keV and in the Fe K band. Fabian et al. (2009), Zoghbi et al. (2010) and the results of the detailed analysis of the RGS spectra confirm that the origin of the 1 keV feature is not due to absorption (Blustin & Fabian 2009). On the other hand these structures and the timing properties of the source, are consistent with being produced by relativistic Fe L and K lines. Thus, we investigate here the consistency of the source emission with the reflection interpretation and its similarity with 1H0707-495.

We thus reproduce the phenomenology of the continuum emission as in Fabian et al. (2009) with a power law plus disc black body emission. This is a crude approximation of the continuum emission. In particular, as shown in 4, the black body component is not associated with the disc emission, being in this interpretation associated with the reflection continuum. This study is important to check the similarity with 1H0707-495. We observe that, as in the case of 1H0707-495, a significant improvement is achieved for all fits when two broad disc lines with energies of keV and keV (depending on the continuum model) are added to the continuum777A of 385 and 79 is observed when a broad Fe L and Fe K line is respectively added to the source spectrum. The strong statistical variation indicate the importance of these features in the spectrum.. The lines are broadened by the motion of the emitting material on the surface of an accretion disc and by the relativistic effects present in the vicinity of a black hole (in Xspec Laor profile, Laor 1991). The model parameters are the emitting energy (E), intensity (norm), disc inner and outer radii (rin, rout), disc inclination (i) and power law disc emissivity index (q). The energies are broadly consistent with those expected from Fe L and Fe K for a common ionisation parameter (; Kallman 1995; Kallman et al. 1996; 2004). It is also worth noting that the high- and low-energy Laor profiles are consistent with identical blurring parameters (see Tab. 1).
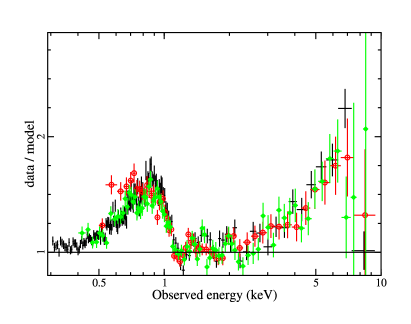
Fig. 7 shows the residuals to black body plus power law continuum fits after setting the normalisation of the Laor profiles to zero, clearly showing the large soft and hard residuals, both reminiscent of broad and skewed emission line profiles, as expected in the case of relativistic disc lines. The resemblance with 1H0707-495 is impressive (Fabian et al. 2009). We observe that the relativistic parameters associated with the low and high energy lines are consistent with each other (see Tab. 1). This suggests that the broadening of the low–energy feature due to the different lines of the Fe L complex and to other soft emission lines is likely negligible (although it is likely that these effects are one of the the causes of the inferred steep disc emissivity profile).
Given the consistency of the relativistic parameters for the two features, to better constrain the two broad line hypothesis, we impose the same disc inclination, emissivity index and inner disc radius. The line energies are still consistent with Fe L and K emission (see lower panel of Tab. 1). Moreover, the normalization of the Fe L and K are in the ratio , consistent with expectations from an ionised disc reflection (Ross & Fabian 2005; see also §5.2.1). The equivalent width of the Fe L (Fe K) line is 0.2 keV (2.8 keV) and 0.07 keV (0.5 keV) during the XMM-Newton and Suzaku observations, respectively. We point out that the inferred value of the Fe K line EW is extreme. Assuming Fe solar abundance, the Fe K line EW with respect to its own reflection continuum is not expected to be much larger than about 1 keV for spectra with . A 5-10Solar Fe abundance produces a factor 2-3 increase in the line EW (George & Fabian 1991) which is in principle able to account for the observed EW if the spectrum is reflection-dominated. However, it should be pointed out that the reflection continuum in the Fe K band is not a simple power law and has a skewed shape dropping sharply at the Fe edge. Hence a simple broad line plus power law fit is very likely to overestimate the line EW because a large part of the reflection continuum is erroneously accounted for by the broad line. We conclude by pointing out that the numerical results and parameters obtained with the phenomenological model presented above must be taken with caution and the model is presented here only as a guide for the more sophisticated and realistic reflection models that will be discussed in the following sections. We stress that, as in 1H0707-495, the two main features of the X-ray spectrum, the sharp drops at 1.1-1.2 keV and 8.2 keV (observed frame), can be reproduced by two emission lines with similar ratios in the two objects.
We note that, even if still too high, the inclusion in the model of the Fe L emission significantly lowers the temperature of the too hot disc component required to fit the soft excess, going from T keV to T keV. Basically, the Fe L feature well reproduces the high energy part of the soft excess emission. The inclusion of all the lines present in a disc reflection spectrum may explain the whole soft X-ray emission without having to invoke a thermal disc component.
| XMM-Newton | Suzaku | ||||
| TBB | TBB | ||||
| Independent disc parameters tied between Fe L and Fe K | |||||
| Fe L | Fe K | Fe L | Fe K | ||
| E | |||||
| q | |||||
| Rin | |||||
| Inc | |||||
| norm | |||||
| Disc parameters tied between Fe L and Fe K | |||||
| E | 0.2 | ||||
| q | 8.1 | ||||
| Rin | |||||
| Inc | |||||
| norm | |||||
6.1 Self-consistent ionised disc reflection
| ionised disc reflection + power law: (wabs*(kdblur*reflionz+powerlaw)) | ||||||||
| AbunFe | q | rin | rout | inc. | Flux3-10 | |||
| XMM-Newton | 2.450.01 | 50.2 | 537 | 5.93 | 1.235 | 400 | 521 | 3 |
| Suzaku | 2.380.02 | - | 349 | 4.85 | 1.235 | - | - | 3 |
An ionised reflection model (Ross & Fabian 2005) modified by the relativistic effects occurring on an accretion disc in the proximity of the black hole (e.g. Fabian et al. 2004; Crummy et al. 2006; Ponti et al. 2006; Petrucci et al. 2007; Larsson et al. 2008; Ponti et al. 2009) could potentially reproduce the mean spectrum. As shown in 4, the disc black body emission can explain the UV emission, but fails in reproducing the soft excess. A prominent broad Fe L line, alone, can fit the high energy tail of the soft excess, but still requires the presence of a blackbody disc component (although a slightly colder one). The inclusion of the emission lines associated with the other elements may entirely explain the soft excess emission. For this reason we fit the spectrum with a simple power law model plus ionised reflection.
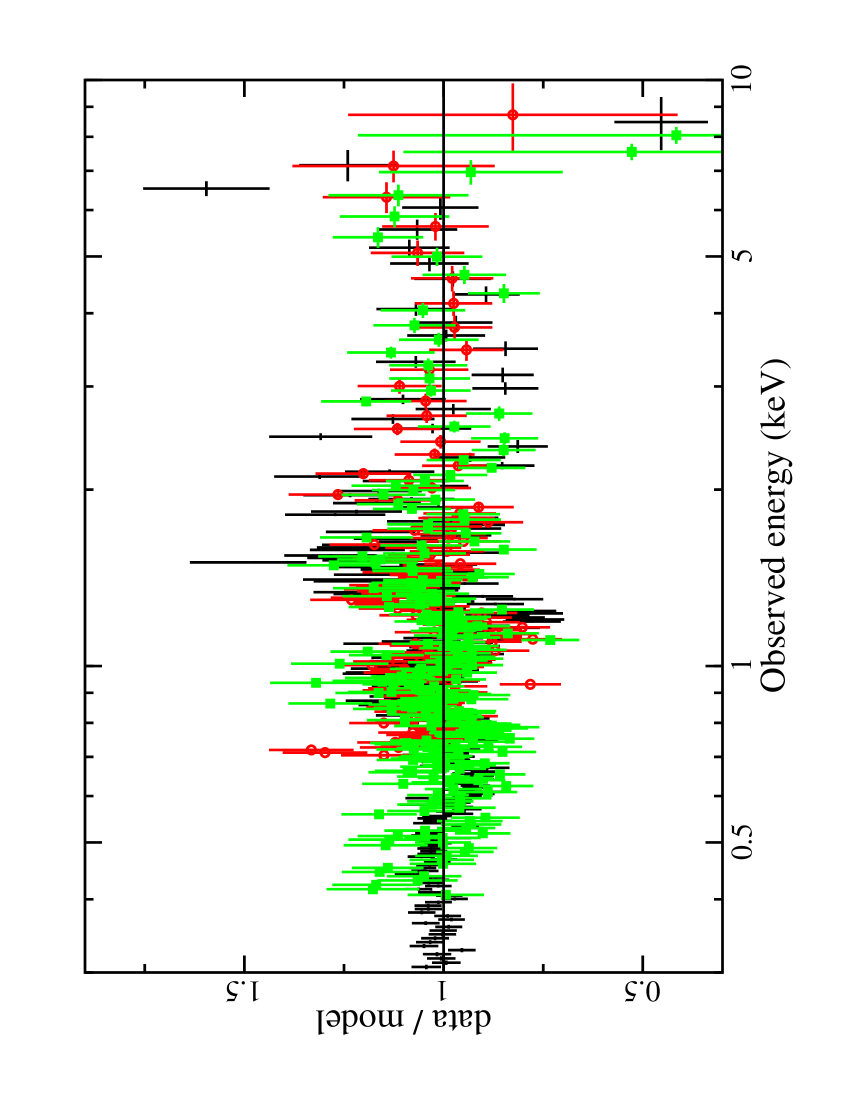
The XMM-Newton and Suzaku spectra are fitted simultaneously and in a self-consistent manner. Parameters that are not expected to change over time scales of a few years, for example: neutral absorption (but see Gallo et al. 2007); disc inclination; and iron abundance, are fixed between the data. All other parameters are free to vary. The best fit models and the residuals from such a fit are shown in Table 2 and in Figure 8.
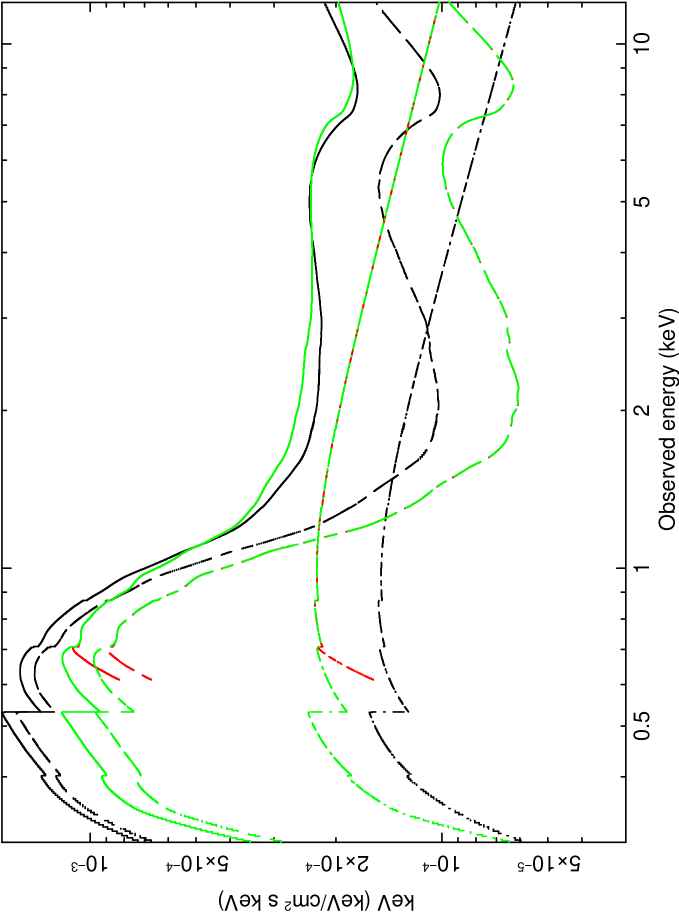
The model fits show a disc inclination of degrees; an inner and outer radius consistent with and () respectively, and an iron abundance times solar (Morrison & McCammon 1983). The disc emissivity profile is comparable at both epochs () as is the power law continuum photon index (). The ionisation parameter (defined as: ; Tarter, Tucker & Salpeter 1969, where F is the total illuminating flux and n is the hydrogen number density) changes only slightly between the two epochs: erg cm s-1 during the XMM-Newton observation compared to erg cm s-1 at the later epoch.
Assuming that the reflecting disc is truncated at the innermost stable circular orbit (ISCO) around the black hole, the inner disc radius depends only on the black hole spin (see i.e. Reynolds & Fabian 2008). The breadth of the lines in IRAS13224-3809 requires an inner radius smaller than 2 gravitational radii (90 % confidence level), indicating a spin parameter higher than .
The average keV flux at the two epochs is also comparable (erg cm-2 s-1). The main difference between the two observations is the ratio between the flux of the direct and reflected component, with the XMM-Newton spectrum being almost entirely reflection dominated (this is in agreement with the observed line equivalent width, see §4.1). The keV band is reflection dominated with a predicted flux of erg cm-2 s-1, and consistent with the lack of detection in the HXD. The fit is reasonably good () compared with other two-component continuum models, although some residuals are still present (Figure 8).
The advantage of the above interpretation is that the Fe L and Fe K are predicted features of the reflection model. Moreover the model reproduces the soft excess without the need to invoke a disc black body (negligible contribution is due to the extrapolation in the soft X-ray range of the disc black body emission fitting the UV data). In this case the strong UV emission would be due to the disc emission, while the soft X-ray by ionised reflection. Even forcing an additional hot disc black body component to the best fit model, we obtain a hot disc temperature of about 0.12 keV. This seems too high even for being the hard tail of the disc black body emission due to the low free-free and bound-free opacities present in the soft X-ray domain (Ross et al. 1992).
7 Source spectral variability
The XMM-Newton and Suzaku broadband light curves of IRAS 13224–3809 (see Figure 2) exhibit large amplitude count rate variations, typical of this source. We explore here the time–resolved spectroscopy on the shortest possible time scale (set by requiring good quality time-resolved spectra). The XMM-Newton and Suzaku source light curves were sliced into 10 and 13 time intervals, respectively (see Figure 2), and spectra were created for each time bin.
7.1 Phenomenological model
In order to gain insight on the source spectral variability and, in particular, to detail the variations of the Fe K and L lines, we fit the spectra with a phenomenological model composing of a power law plus a low energy disc black body continuum and two prominent broad lines representing the Fe K and Fe L emission. The disc black body component is required in order to approximately reproduce the effect of the ionised reflection continuum. The disc black body temperature is fixed to the best fit values from the mean spectra (TBB=118 and 122 eV for XMM-Newton and Suzaku, respectively). Similarly, the parameters of the relativistic line profiles and their emission energies (see Tab. 1) were fixed. The model reproduces well the spectra at all flux levels.
We observe that IRAS13224-3809 shows a correlation between the flux and the power law spectral index, with the spectrum becoming steeper with increasing flux. The spectral index shows a large variation during both observations, going from to about 3. This behaviour has been observed in many other sources (see e.g. Fig. 10 of Ponti et al. 2006) and it can be: i) either intrinsic due to changes in the parameters of the Comptonising phase, producing variations of the observed power law spectral index; ii) or spurious being due to the variations of the absorbing material that is dominating the spectral shape; iii) or due to a two component model comprising a steep power law varying in normalisation only and a harder and more constant component (McHardy, Papadakis & Uttley 1998; Shih, Iwasawa & Fabian 2002). The lack of a strong narrow component in the Fe K line (the upper limit on a neutral line being EW eV both for XMM-Newton and Suzaku and on a ionised being EW= eV, E= keV for XMM-Newton and eV for Suzaku), excludes a strong contribution from a constant reflection component from distant material. Thus, in this latter case the constant reflection must come from the inner disc.
Figure 9 shows the variations in the normalisation of Fe L and Fe K as a function of flux (for display purposes the intensity of Fe K has been multiplied by a factor of 30). The best fit values for the XMM-Newton observation are shown with filled blue and open light blue stars for Fe L and Fe K, respectively, while the Suzaku ones are shown with the filled red and open orange squares. The intensities of the two lines are well fitted by linear relations during both observations888Only for the Fe K line during the Suzaku observation a fit with a constant gives comparable results to the fit with a linear relation ( and 3.3, respectively), while during the XMM-Newton pointing a fit with a linear relation provides a better fit (for the same dof, and 2.7, respectively). The Fe L is always better fitted with a linear relation and 105 (for the same dof, and 7.2 during the Suzaku and and 7.2, during the XMM-Newton observation).. In fact, once the Fe K intensity is multiplied for a factor of 30 (see Tab. 1), we obtain the best fit linear relation for the Fe L and Fe K lines are: normFeL=aFlux0.5-10keV with aXMM=10.3107 and normFeK=bFlux0.5-10keV with bXMM=10107 ph. ergs-1 during the XMM-Newton observation. While the relations are: a=23.9107 and b=20107 ph. ergs-1 during the Suzaku one. The variations of the Fe L and K lines are thus consistent with being the same within each observation. This suggests that a unique reflection component can reproduce the two features at all flux states during the two observations. However, during the XMM-Newton observation the intensities of the lines (filled blue and open light blue stars) are higher than during the Suzaku observation (red filled and orange open squares) at the same flux level. This suggests that the reflection component (that is tracked by the emission lines) is correlated with the continuum within the single observations, while for the same continuum flux the XMM-Newton observation shows a higher amount of reflection. Nevertheless, the same ratio between Fe L and Fe K is always maintained.
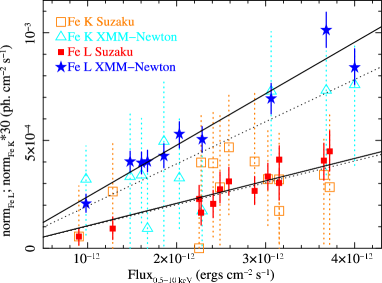
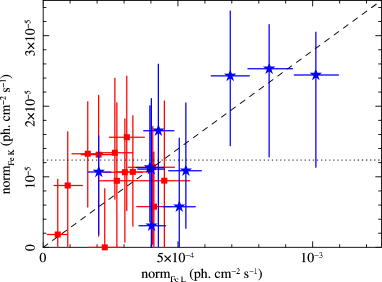
Figure 10 confirms this trend. In fact although we observe that a fit with a constant is acceptable ( for 22 dof), a linear correlation between the intensities of the two lines provides a better fit than a constant (=10.2 for the same dof; for 22 dof). This indicates that the two main spectral features at low (1.2 keV) and high (8 keV) energies are consistent with having a common origin. The best fit coefficient of the linear relation is: normFeK=anormFeL; with a=0.028 (see Fig. 8) indicating a ratio between Fe K and Fe L of 356, at all flux levels.
7.2 Ionized disc reflection
We fitted the spectra with a physically self-consistent model including a power law and an ionised disc reflection component. We assume that the inner and outer disc radius; inclination; and the elemental abundances do not vary and we fix them to the best fit values of the mean XMM-Newton and Suzaku models (consistent with being the same). We also fix the power law spectral index. Thus, the only free parameters are the normalisation of the two components, the disc ionisation and the emissivity index. This model reproduces well the spectra at all flux levels. From the best fit results of the time resolved spectra we simulated the expected rms spectra. The red line in Fig. 3 shows that this decomposition reproduces the source spectral variations during both observations. Despite some discrepancies, the general rms spectral shape is well reproduced by this minimal two component model. Further model complexity is required to accurately reproduce the rms features and it is beyond the scope of this paper which seeks a minimal-complexity solution.
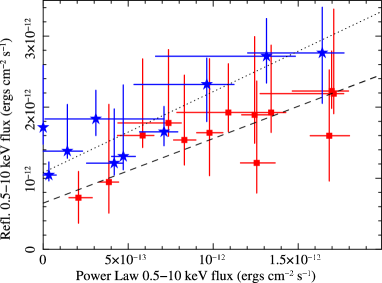
Fig. 11 shows the 0.5–10 keV flux of the ionised reflection versus the power law flux in the same band. During both observations a fit with a straight line is superior to a constant at a 99 % confidence level. The linear Pearson correlation coefficient is and for the XMM-Newton and Suzaku points, respectively. In both cases, the spectra appear to be reflection–dominated, most remarkably at low flux levels.
The correlation between the two spectral components requires a positive intercept in the y-axis. Physically this indicates the presence of an ionised disc reflection component even when the power law flux is null. In particular the main difference between the two observations is that in 2002 the amount of this residual reflection component was higher (1.110-12 ergs cm-2 s-1 instead of 610-13 ergs cm-2 s-1). The presence of this difference in the intensity of the residual reflection component explains also the difference in the shapes of the rms spectra (see Fig. 3).
Reflection–dominated spectra have been observed in many AGN and in particular in NLS1 accreting at a high rate (Zoghbi et al. 2008; Schartel et al. 2007; Fabian et al. 2004; Grupe et al. 2008). This can happen for example when disc instabilities break the accretion disc in rings of dense material and the primary source, inside these, is thus hidden from view leaving only a reflection component (Fabian et al. 2002). A reflection dominated spectrum is also expected when the nuclear source is situated only a few gravitational radii from the black hole. In this conditions light bending effects are strong, generating (as seen at infinity) a strong reflection and a dim primary source (Miniutti et al. 2003; Miniutti & Fabian 2004). In the most extreme cases (regime I in Miniutti & Fabian 2004) corresponding to strongly reflection–dominated spectra (which is the relevant case here) the light bending model implies steep emissivity profiles and correlated variability between the reflection and primary (power law) components. Although the latter is a prediction of the model for reflection–dominated states (as opposed to less reflection–dominated cases in which the model predicts a more contant reflection), correlated variability between the primary and reprocessed component is what is generally expected in any reprocessing model and cannot be associated unequivocally with the specific variability model of Miniutti & Fabian (2004).
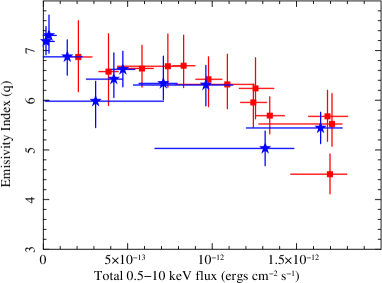
The upper panel of Fig. 12 shows the disc reflection emissivity index as a function of the 0.5–10 keV power law flux. The emissivity index appears to be weakly anti-correlated with flux (linear Pearson correlation coefficient of ), which is in line with the light bending model predictions in which low flux states are automatically associated with more centrally concentrated disc illumination profiles. However, even for the most extreme light bending effects, emissivity indices as steep as 6-7 are difficult to produce and hence somewhat suspicious. Here we point out only one possible reason: the relativistic blurring model we use is based on the Laor (1991) code and assumes limb darkening, while numerical simulations would in fact suggest that mild limb brightening is more appropriate for disc reflection (Svoboda et al. 2009). In fact, Svoboda et al. (2009) have shown that, by applying a limb brightning model to the best-studied broad line case of MCG-6-30-15, the inner emissivity index can be reduced from 5.3 to 3.7 for similar inclination and black hole spin. The emissivity index may thus be generally overestimated, especially at relatively high inclination angles such as the one inferred in the present case.
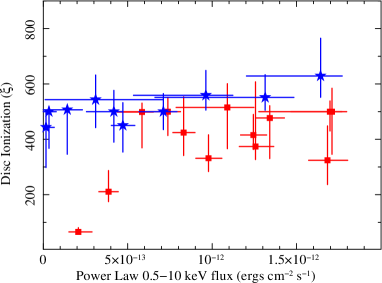
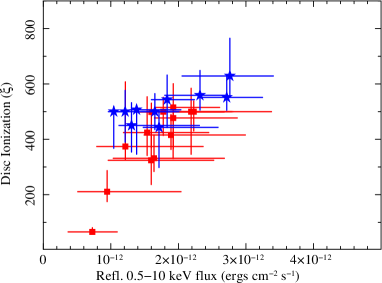
The lower panel of Fig. 12 shows the disc ionisation parameter as a function of the direct (power law) flux. In this case the correlation is very poor () meaning that the variations of the disc ionisation parameter do not closely follow the variations of the source flux (a similar behaviour is present in other sources, i.e. MCG-6-30-15; Ballantyne et al. 2003). We point out that, if light bending really plays a role in shaping the general spectral and variability properties of the source, the observed flux cannot be directly connected to the flux illuminating the accretion disc (which is the one to which the ionization should be associated with). This is because, due to light bending, the disc sees a different flux than the observer at infinity. On the other hand, both the disc ionization state and the reflection intensity should be directly correlated with the flux irradiating the accretion disc. Hence a correlation between reflection intensity and ionization state is generally expected, especially if the bulk of the reflection component comes from a limited region (e.g. the innermost accretion disc). Such a trend is indeed observed in our data (see Fig. 13), and represents a sanity check for our reflection interpretation ().
IRAS13224-3809 is not the only source where the nuclear emission is thought to originate from within the regions where strong gravity effects are not negligible (Fabian & Miniutti 2005). Long uninterrupted exposures of such AGN have demonstrated that the relation between direct emission and the disc reflection component is complex. The cases of MCG-6-30-15 and NGC4051 show that the disc reflection component is approximately constant at medium/high fluxes and correlated with the power law at low fluxes where the spectrum becomes more reflection–dominated (Ponti et al. 2006; Larsson et al. 2007). This is the expected behaviour when the intrinsic luminosity variations of the X-ray source are negligible and most of the flux variability is due to general relativistic effects. A longer observation of IRAS13224-3809 is required to fully address this issue.
7.2.1 Fe L / K energies and ratio
The ratio between Fe L and Fe K depends on many physical parameters, primarily on the power law index of the illuminating source and on the physical properties of the reflecting material. Kallman (1995) simulated the expected ratio assuming a slab of optically thin gas with Solar abundances photo-ionised by a X-ray power law source with an energy index of -1.5. In such conditions the Fe L/ FeK ratio is expected to be about 3 for an ionisation parameter . To measure the ratio in the case of an optically thick accretion disc with a high Fe abundance, we computed extensive simulations of accretion disc in the same scenario used to compute the ionised reflection model (Ross & Fabian 2005). In particular the primary X-ray source illuminating the accretion disc has a power law spectral index of , the disc has a Fe abundance 5 times higher than solar and ionisation erg cm s-1. The ratio between the intensities of Fe L and K has been calculated considering the Fe L region extending from 0.71 keV to 1.08 keV, and the Fe K region to extend from 6.31 keV to 7.07 keV (where the smeared Fe K-edge begins). The continuum has been fitted with a simple straight-line continuum in these two regions and then added up the line photons (how much the emergent spectrum exceeded the continuum fit) for each of these regions. We found a Fe L to Fe K photon ratio of 44.6 for this model. The reason that the L line dominates so strongly in this model is that Fe XVII dominates over most of the outermost Thomson depth, while the K line is suppressed by Auger destruction during resonance trapping. We also observe that, varying the ionisation parameter between 200 and 600 erg cm s-1, the FeL/K ratio has values of a few tens. These computations depend on the assumption of the straight line continuum and thus do not provide the precise FeL/K ratio. Nevertheless, they should provide reasonable values to compare with the phenomenological broad lines model where the continuum is also a straight line. We, in fact, observe that these values are roughly in agreement with the ones obtained from the fit with broad lines (see 6).
8 Frequency dependent lags
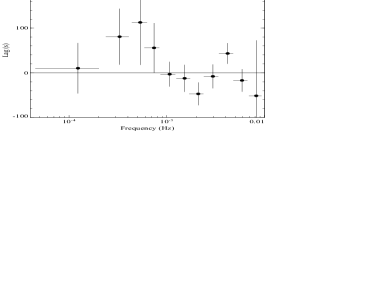
IRAS13224-3809 is well known to present a high degree of complex variability (see Fig. 2 and 3). Gallo et al. (2004) studied the timing properties investigating the correlations and showing a complex pattern of lags and leads between the 0.3-0.8 and 3-10 keV band (see Fig. 4 of Gallo et al. 2004). In combination with the spectral information, we performed a time-lag study (of the uninterrupted XMM-Newton data) separating the energy regions dominated by the power law and ionised reflection emission. Figure 14 shows the frequency dependent lags between the reflection-dominated 0.3-1 keV and the power law-dominated 1-4 keV bands (see Fig. 8). Negative lags indicate that the hard (power law dominated) components leads the reflection emission. The shape of the frequency dependent lags closely resembles the one of 1H0707-495, where for the first time a reverberation lag of 30 s between the continuum and the energy band of the Fe L reflection line is detected (Fabian et al. 2009). In the present case a significant detection of the lag is prevented by the short exposure (60 ks, about ten times lower than 1H0707-495). A long uninterrupted observation of IRAS13224-3809 will clarify this issue and serve to scrutinise the reflection dominated interpretation proposed here.
9 Discussion
We have studied the X–ray spectral variability of IRAS 13224–3809 analyzing the XMM-Newton and Suzaku data. The source shows very similar behaviour during the two observations taken 5 years apart. In particular it exhibits: i) a strong soft excess with a sharp feature around 1.2 keV; ii) an impressive drop in flux at 8.2 keV (the drop has not shifted in energy and no narrow component of the Fe K line is detected).
These features may be reproduced by either absorption or ionized reflection. In the absorption interpretation the two features imply at least two distinct absorption components, while in the reflection interpretation a single reflection component can explain all the major spectral features. Moreover, the reflection model naturally accounts also for the soft excess, while additional soft (e.g. blackbody) components must be included in the absorption–dominated models we have considered. In fact when the spectrum is fitted with two broad lines, the energies of the lines are consistent with coming from Fe L and Fe K, the shapes are consistent with being produced by the same broadening profile and the ratio between the intensity broadly consistent with expectations from a dominant Fe XVII contribution. This result is very similar to what has been recently reported for a similar object 1H0707-495 (Fabian et al. 2009). In that case the reflection interpretation is strengthened by the detection of a time lag between the soft band (0.3-1 keV, dominated by the Fe L emission) and the power law, hampered here by the shortness of the XMM-Newton observation. Longer uninterrupted observations are required to study the timing characteristics of IRAS 13224–3809 in detail.
We stress, however, that ionised disc reflection not only gives a reasonable fit to the mean spectrum, but also reproduces the source spectral variability. In particular the variability can be described by a variable power law with constant spectral shape and a reflection component following the power law variations, with residual reflection dominating the spectrum at low fluxes. During the XMM-Newton observation this residual ionised disc reflection component is more prominent even if the source flux is similar.
The reflection component is affected by relativistic effects, strongly suggesting that it originates in the innermost regions of the accretion disc around a rapidly rotating Kerr black hole. The best fit inner radius of the accretion disc is of the order of 1.2 rg with a 90% upper limit of 2 rg, implying an almost maximal black hole spin . The disc illumination radial profile is consistent with a steep power law (q5–7). A weak anti-correlation between the illumination profile and the source direct flux is observed. This indicates that at lower fluxes the primary emission is likely closer to the back hole. During the low flux states most of the reflection is produced within a few gravitational radii from the black hole. In such conditions strong relativistic effects must be at work.
Despite being an illustrative toy model, which most likely represents the zeroth-order approximation of the full relativistic cases, the light bending model proposed by Miniutti & Fabian (2004) seems to capture the main characteristics of IRAS 13224–3809. In particular the model predicts the existence of a regime in which the spectrum is strongly reflection-dominated, as we observe here. Within this regime, the reflection and continuum components are expected to correlate well, while the disc emissivity is anti–correlated with the direct flux (the power law flux in this case). Although we observe both trends, we point out that correlated variability between the primary and reprocessed component is a general prediction of any reflection model. However, the light bending model associates this behaviour only with reflection–dominated states, while in more standard cases, the reprocessed component is predicted to vary less than the primary. Future X–ray observation catching the source in less reflection–dominated states may be important to test the model predictions.
Both the strong soft excess and the extreme Fe K lines, when fitted with a disc ionised reflection component, require an extremely high level of reflection, near to have a reflection dominated spectrum (see Fig. 8). We measure a ratio between the ionised reflection to the power law flux of 1.7 and 0.75 over the 0.001-1000 keV band (the entire band over which the reflection model is computed), while the ratio is 3.7 and 1.6 in the observed 0.5-10 keV band for the XMM-Newton and Suzaku observations, respectively. We note that the high energy part of the reflected spectrum is less affected by ionisation, thus we estimated the reflection fraction comparing the extrapolated best fit ionised reflection to power law flux ratio in the 20-60 keV band (that results to be about 4.9 and 2.1) with the one expected by neutral reflection (using a pexrav component). A reflection fraction of 7 and 4 are thus estimated in this way.
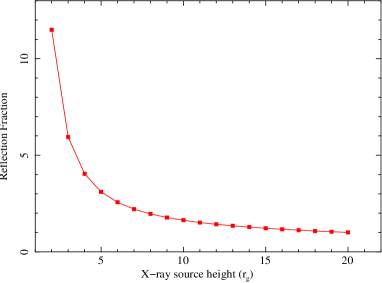
Are such high reflection fractions consistent with the picture described in the light bending model? As shown in Figure 15 the observed values are rather extreme, however, they are expected when the primary X-ray source is less than 3-4 rg above the central black hole (regime I, see Miniutti & Fabian 2004). We estimate that, in this condition, only about 10–20 % of the primary X-ray source is detected at infinity in the form of the power law emission. Thus, the measured 2-10 keV power law luminosity of erg s-1 would correspond to an intrinsic luminosity (in the frame of the source) of the order of a few times erg s-1. This value is not too large if compared to the bolometric luminosity (L erg s-1), even assuming a rather extreme bolometric correction (Elvis et al. 1995; Vasudevan et al. 2007; 2009). Also in agreement with such a scenario, we observe that the reflection fraction and the broadness of the line increase lowering the flux, passing from the Suzaku to the XMM-Newton observations.
We also observe a poor correlation between disc ionization and observed power law flux. In the framework of the light bending model, this is not highly surprising since the disc sees a different continuum than the observer precisely because of light bending. However, the disc ionization and the reflection intensity track each other reasonably well, which is consistent with our reflection interpretation since they both respond to the flux irradiating the disc.
The strong ionised reflection interpretation requires a very high value of the disc illumination parameter, but also of the iron abundance (5 times solar). Nevertheless it is important to stress that an even higher iron abundance is required in the partial covering interpretation (Boller et al. 2003). Moreover supersolar metal abundances of the environment around supermassive black holes seem to be the rule, more than the exception. For example, the quasar environments are metal-rich with typically gas abundances several times Solar at all redshifts (Hamann et al. 2007). In fact, several methods based on optical-UV broad and narrow emission and absorption lines agree in observing supersolar metal abundances in large samples of quasars. The typical metallicity is observed to be roughly 2-4 times Solar (Dietrich et al. 2003a,b; Nagao et al. 2006; Groves et al. 2006; D’Odorica et al. 2004), in agreement with the value observed in IRAS13224-3809. Our Galactic Centre, even if it is not hosting, at the moment (Ponti et al. 2010), an accreting black hole, contains large molecular clouds with Fe abundances higher than Solar. The Fe K line emitted by Sgr B2, for example, suggest a Fe over abundances of the order of 2, maybe more (Revnivtsev et al. 2004; Terrier et al. 2010). Abundances studies in samples of NLS1 suggest that the metals are about 2-3 times higher than Solar in these sources (ses Nagao et al. 2002). In particular, a five times Solar metallicity has been measured in other nearby Narrow Line Seyfert galaxies (i.e. Mrk 1044, Fields et al. 2005). The optical/UV spectrum of IRAS13224-3809 presents some of the strongest Fe emission lines of the NLS1 class. The Fe overabundance requires a high rate of explosion of type Ia supernovae that produce much more iron (more than an order of magnitude) than type II ones (Nomoto et al. 1997a,b). This may happen in the presence of a nuclear star cluster that formed white dwarfs that, through close interactions, become part of close binaries, enriching the environment with Iron through many SN Ia explosions (Shara & Hurley 2002; Fabian et al. 2009).
10 Conclusions
IRAS 13224–3809 is a remarkable source, with one of the strongest soft excesses observed, and two prominent features at 1.2 and 8.2 keV.
-
•
These features can be reproduced by 2 broad lines, in particular: i) the best fit energies of the lines are consistent with emission from Fe L and Fe K; ii) the same relativistic profile can explain the shape of both lines; iii) the ratio between the intensities of the lines is broadly in agreement with expectations.
-
•
A single ionized disc reflection model (produced in the inner accretion disc) can reproduce the main features of the spectrum, implying a iron abundance of 5 times solar.
-
•
The main spectral variations can be reproduced by a steep power law varying in normalisation and a reflection component from the inner accretion disc varying in a correlated way, but with a residual component, dominating at low fluxes.
-
•
The spectral features may, in an alternative interpretation, be associated with absorption components. Nevertheless in this scenario the two main features require at least two physically different absorbing components in highly relativistic outflow and without a clear physical link. A high iron abundance is also required. Moreover, absorption-dominated models over–predict Fe M absorption in the soft X–rays, and they still require a likley unphysical additional blackbody component to describe the soft excess, casting further doubts on the overall interpretation.
Acknowledgments
The work reported here is based on observations obtained with XMM-Newton, an ESA science mission with instruments and contributions directly funded by ESA Member States and NASA, and with Suzaku, a collaborative mission between the space agencies of Japan (JAXA) and the USA (NASA). GP thanks Fabio Mattana, Michael Mayer, Massimo Cappi and Mauro Dadina for many useful comments, suggestions and technical help. GP thanks ANR for support (ANR-06-JCJC-0047). ACF thanks the Royal Society and RRR thanks the college of the Holy Cross for support. GM thanks the Spanish Ministerio de Ciencia e Innovación and CSIC for support through a Ramón y Cajal contract and the Spanish Ministerio de Ciencia e Innovación for partial support through project ESP2006–13608–C02–01. WNB thanks NASA for support through LTSA grant NAG5-13035.
References
- Ballantyne et al. (2003) Ballantyne, D. R., Vaughan, S., & Fabian, A. C. 2003, MNRAS, 342, 239
- Behar et al. (2001) Behar, E., Sako, M., & Kahn, S. M. 2001, ApJ, 563, 497
- Blustin & Fabian (2009) Blustin, A. J., Fabian, A. C. 2009, MNRAS, 399, L169
- Boller et al. (1996) Boller, T., Brandt, W. N., & Fink, H. 1996, A&A, 305, 53
- Boller et al. (2002) Boller, T., et al. 2002, MNRAS, 329, L1
- Boller et al. (2003) Boller, T., Tanaka, Y., Fabian, A., Brandt, W. N., Gallo, L., Anabuki, N., Haba, Y., & Vaughan, S. 2003, MNRAS, 343, L89
- Brandt et al. (1997) Brandt, W. N., Mathur, S., & Elvis, M. 1997, MNRAS, 285, L25
- Crummy et al. (2006) Crummy, J., Fabian, A. C., Gallo, L., & Ross, R. R. 2006, MNRAS, 365, 1067
- Dewangan et al. (2002) Dewangan, G. C., Boller, T., Singh, K. P., & Leighly, K. M. 2002, A&A, 390, 65
- Dietrich et al. (2003) Dietrich, M., Hamann, F., Shields, J. C., Constantin, A., Heidt, J., Jäger, K., Vestergaard, M., & Wagner, S. J. 2003a, ApJ, 589, 722
- Dietrich et al. (2003) Dietrich, M., Appenzeller, I., Hamann, F., Heidt, J., Jäger, K., Vestergaard, M., & Wagner, S. J. 2003b, A&A, 398, 891
- Fabian et al. (2002) Fabian, A. C., Ballantyne, D. R., Merloni, A., Vaughan, S., Iwasawa, K., & Boller, T. 2002, MNRAS, 331, L35
- Fabian et al. (2004) Fabian, A. C., Miniutti, G., Gallo, L., Boller, T., Tanaka, Y., Vaughan, S., & Ross, R. R. 2004, MNRAS, 353, 1071
- Fabian & Miniutti (2005) Fabian, A. C., & Miniutti, G. 2005, arXiv:astro-ph/0507409
- Fields et al. (2005) Fields, D. L., Mathur, S., Pogge, R. W., Nicastro, F., Komossa, S., & Krongold, Y. 2005, ApJ, 634, 928
- Gallo et al. (2004) Gallo, L. C., Boller, T., Tanaka, Y., Fabian, A. C., Brandt, W. N., Welsh, W. F., Anabuki, N., & Haba, Y. 2004a, MNRAS, 347, 269
- Gallo et al. (2004) Gallo, L. C., Tanaka, Y., Boller, T., Fabian, A. C., Vaughan, S., & Brandt, W. N. 2004b, MNRAS, 353, 1064
- Gallo (2006) Gallo, L. C. 2006, MNRAS, 368, 479
- Gallo et al. (2007) Gallo, L. C., Brandt, W. N., Costantini, E., Fabian, A. C., Iwasawa, K., & Papadakis, I. E. 2007, MNRAS, 377, 391
- Gierliński & Done (2004) Gierliński, M., & Done, C. 2004, MNRAS, 349, L7
- Gierliński et al. (2008) Gierliński, M., Middleton, M., Ward, M., & Done, C. 2008, Nature, 455, 369
- Groves et al. (2006) Groves, B. A., Heckman, T. M., & Kauffmann, G. 2006, MNRAS, 371, 1559
- Grupe et al. (2008) Grupe, D., Komossa, S., Gallo, L. C., Fabian, A. C., Larsson, J., Pradhan, A. K., Xu, D., & Miniutti, G. 2008, ApJ, 681, 982
- Haardt et al. (1997) Haardt, F., Maraschi, L., & Ghisellini, G. 1997, ApJ, 476, 620
- Hamann et al. (2007) Hamann, F., Warner, C., Dietrich, M., & Ferland, G. 2007, The Central Engine of Active Galactic Nuclei, 373, 653
- Kalberla et al. (2005) Kalberla, P. M. W., Burton, W. B., Hartmann, D., Arnal, E. M., Bajaja, E., Morras, R., Poumlppel, W. G. L. 2005, A&A, 440, 775
- Kallman (1995) Kallman, T. R. 1995, ApJ, 455, 603
- Kallman et al. (1996) Kallman, T. R., Liedahl, D., Osterheld, A., Goldstein, W., & Kahn, S. 1996, ApJ, 465, 994
- Kallman et al. (2004) Kallman, T. R., Palmeri, P., Bautista, M. A., Mendoza, C., & Krolik, J. H. 2004, ApJS, 155, 675
- Laor (1991) Laor, A. 1991, ApJ, 376, 90
- Larsson et al. (2007) Larsson, J., Fabian, A. C., Miniutti, G., & Ross, R. R. 2007, MNRAS, 376, 348
- Larsson et al. (2008) Larsson, J., Miniutti, G., Fabian, A. C., Miller, J. M., Reynolds, C. S., & Ponti, G. 2008, MNRAS, 384, 1316
- Leighly (1999) Leighly, K. M. 1999, ApJS, 125, 317
- Makishima et al. (1986) Makishima, K., Maejima, Y., Mitsuda, K., Bradt, H. V., Remillard, R. A., Tuohy, I. R., Hoshi, R., & Nakagawa, M. 1986, ApJ, 308, 635
- Martocchia et al. (2002) Martocchia, A., Matt, G., & Karas, V. 2002, A&A, 383, L23
- McHardy et al. (1998) McHardy, I. M., Papadakis, I. E., & Uttley, P. 1998, The Active X-ray Sky: Results from BeppoSAX and RXTE, 509
- Middleton et al. (2007) Middleton, M., Done, C., & Gierliński, M. 2007, MNRAS, 381, 1426
- Miniutti et al. (2003) Miniutti, G., Fabian, A. C., Goyder, R., & Lasenby, A. N. 2003, MNRAS, 344, L22
- Miniutti & Fabian (2004) Miniutti, G., & Fabian, A. C. 2004, MNRAS, 349, 1435
- Miniutti et al. (2007) Miniutti, G., et al. 2007, PASJ, 59, 315
- Nagao et al. (2002) Nagao, T., Murayama, T., Shioya, Y., & Taniguchi, Y. 2002, ApJ, 575, 721
- Nagao et al. (2006) Nagao, T., Marconi, A., & Maiolino, R. 2006, A&A, 447, 157
- Nomoto et al. (1997) Nomoto, K., Hashimoto, M., Tsujimoto, T., Thielemann, F.-K., Kishimoto, N., Kubo, Y., & Nakasato, N. 1997, Nuclear Physics A, 616, 79
- Nomoto et al. (1997) Nomoto, K., Iwamoto, K., Nakasato, N., Thielemann, F.-K., Brachwitz, F., Tsujimoto, T., Kubo, Y., & Kishimoto, N. 1997, Nuclear Physics A, 621, 467
- Petrucci et al. (2007) Petrucci, P. O., et al. 2007, A&A, 470, 889
- Ponti et al. (2004) Ponti, G., Cappi, M., Dadina, M., & Malaguti, G. 2004, A&A, 417, 451
- Ponti et al. (2006) Ponti, G., Miniutti, G., Cappi, M., Maraschi, L., Fabian, A. C., & Iwasawa, K. 2006, MNRAS, 368, 903
- Ponti et al. (2006) Ponti, G., Miniutti, G., Fabian, A. C., Cappi, M., & Palumbo, G. G. C. 2006, Astronomische Nachrichten, 327, 1055
- Ponti et al. (2009) Ponti, G., et al. 2009, MNRAS, 394, 1487
- Ponti et al. (2010) Ponti, G., Terrier, R., Goldwurm, A., Belanger, G., & Trap, G. 2010, arXiv:1003.2001
- Revnivtsev et al. (2004) Revnivtsev, M. G., et al. 2004, A&A, 425, L49
- Reynolds & Fabian (2008) Reynolds, C. S., & Fabian, A. C. 2008, ApJ, 675, 1048
- Ross et al. (1992) Ross, R. R., Fabian, A. C., & Mineshige, S. 1992, MNRAS, 258, 189
- Ross & Fabian (2005) Ross, R. R., & Fabian, A. C. 2005, MNRAS, 358, 211
- Shara & Hurley (2002) Shara, M. M., & Hurley, J. R. 2002, ApJ, 571, 830
- Shakura & Sunyaev (1976) Shakura, N. I., & Sunyaev, R. A. 1976, MNRAS, 175, 613
- Schartel et al. (2007) Schartel, N., Rodríguez-Pascual, P. M., Santos-Lleó, M., Ballo, L., Clavel, J., Guainazzi, M., Jiménez-Bailón, E., & Piconcelli, E. 2007, A&A, 474, 431
- Shih et al. (2002) Shih, D. C., Iwasawa, K., & Fabian, A. C. 2002, MNRAS, 333, 687
- Suebsuwong et al. (2006) Suebsuwong, T., Malzac, J., Jourdain, E., & Marcowith, A. 2006, A&A, 453, 773
- Sobolewska & Done (2007) Sobolewska, M. A., & Done, C. 2007, MNRAS, 374, 150
- Tanaka et al. (2004) Tanaka, Y., Boller, T., Gallo, L., Keil, R., & Ueda, Y. 2004, PASJ, 56, L9
- Tanaka et al. (2005) Tanaka, Y., Boller, T., & Gallo, L. 2005, Growing Black Holes: Accretion in a Cosmological Context, 290
- Tarter et al. (1969) Tarter, C. B., Tucker, W. H., & Salpeter, E. E. 1969, ApJ, 156, 943
- Titarchuk (1994) Titarchuk, L. 1994, ApJ, 434, 570
- Vasudevan & Fabian (2007) Vasudevan, R. V., & Fabian, A. C. 2007, MNRAS, 381, 1235
- Vasudevan & Fabian (2009) Vasudevan, R. V., & Fabian, A. C. 2009, MNRAS, 392, 1124
- Zoghbi et al. (2008) Zoghbi, A., Fabian, A. C., & Gallo, L. C. 2008, MNRAS, 391, 2003
- Zoghbi et al. (2010) Zoghbi, A., Fabian, A. C., Uttley, P., Miniutti, G., Gallo, L. C., Reynolds, C. S., Miller, J. M., & Ponti, G. 2010, MNRAS, 401, 2419