Self-organized composites of multiwalled carbon nanotubes and
nematic liquid crystal 5CB:
Optical singularities and percolation behavior in electrical conductivity
Abstract
This work discusses optical singularities and electrical conductivity behavior in a thin electrooptical cell filled with composites including multi-walled carbon nanotubes (MWCNTs) and nematic liquid crystal (LC). The MWCNTs with high aspect ratio and nematic LC 5CB (4-pentyl-4-0-cyanobiphenyl) were used. The composites were prepared by introduction of MWCNTs ( % wt) into LC solvent with subsequent sonication. The increase of MWCNT concentration (between % wt) resulted in self-organization of MWCNTs and formation of micron-sized aggregates with fractal boundaries. The visually observed formation of spanning MWCNT networks near the percolation threshold at 0.025 % wt was accompanied with transition from non-conductive to conductive state and generation of optical singularities. The observed effects were explained by the strong interactions between MWCNTs and LC medium and planar orientation of 5CB molecules near the lateral surface of MWCNTs. It was speculated that optical singularities arose as a results of interaction of an incident laser beam with LC perturbed interfacial shells covering the MWCNT clusters. Behavior of the interfacial shell thickness in external electric field and in the vicinity of the nematic to isotropic transition was discussed.
pacs:
02.40.-k, 42.25.Ja, 42.30.Ms, 61.30.-v, 61.46.-w, 73.63.Fg, 73.22.-fI INTRODUCTION
Nanoscience and nanotechnology are popular slogans of modern science and technique. Nowadays, the most ’hot points’ are related mainly to development of composites including carbon nanotubes (CNTs). The typical CNTs have nanometer scale diameter and very high aspect ratio (length-to-diameter ratio) a 1000. During the last decade, a great interest was also attracted by the liquid crystalline (LC) composites doped with CNTs Zakri ; Lagerwall2008 ; Trushkevych ; Zhao ; Rahman2009 . These materials display many unique properties and integrate the rod-like particles (LC and CNTs) with huge difference in aspect ratios. The CNT+LC nanocomposites are very attractive as objects for investigation because the highly anisotropic excluded-volume interactions may result in unique self-organization and new unexpected effects.
The introduction of CNTs inside LC media may produce many unexpected effects Saito2001 ; Lebovka2008 ; Lysetski2009 , influence the phase transitions in LC Russell2006 ; Duran2005 and enhance the alignment of LC Dierking2004 . Enhancement of CNT ordering inside LC media Lynch2002 ; Dierking2005 ; Lagerwall2007 and sensible responses of CNTs+LC composites to the shear, external electric or magnetic field, were also reported Baik ; Wang ; Srivastava ; Shah ; Dierking2008 . It allowed construction of promising electrically or magnetically steered switches Dierking2004 ; Dierking2005 . Nowadays, the interest to the electro-optical properties of CNT+LC composites is continuously growing Lebovka2008 ; Lu . The CNTs essentially affect the spatial distribution of charges inside LC cells and, as a result, change their electro-optic response Lee ; Huang . Different time scales, associated with reorientation of the LC texture (the short timescale) and with reorientation of the carbon nanotubes (the long timescale), were identified in the external electric fields Dierking2008 . The electrical conductivity and the dielectric constant of LCs doped with carbon nanotubes demonstrate extraordinary large changes in electric and magnetic field driven reorientation experiments Dierking2008 ; Jayalakshmi .
However, in spite of these vast investigations, the main mechanism governing structure formation and optical and physical properties of LC+CNTs composites remained unclear. Particularly, the typical micrometer scale length of isolated CNTs (or their aggregates) dispersed in LC cells is a subject of classical optics. Contrary, the nm-scale diameter of CNTs belongs to the area of nanooptics. The nano- and micro-heterogeneities in CNT+LC composites can produce optical singularities and drastically chance optical properties of these systems. The optical singularities exist in variety of natural systems and appear as excellent tool for investigation of their basic properties Nye ; Soskin2001 . From other side, self-organization in CNT + LC composites at different concentrations of CNTs can be easily monitored by means of different experimental techniques, including singular optics and polarization microscopy methods and measurements of electrical conductivity.
This work studies optical and electro-physical properties of multiwalled carbon nanotubes (MWCNTs) and nematic LC 5CB composites in the concentration range C between 0.0001 and 0.1 % wt of MWCNTs. The behavior of optical singularities, percolation threshold from non-conductive to conductive state and electric field driven effects, are also investigated and discussed in details.
II MATERIALS AND EXPERIMENTAL TECHNIQUES
II.1 Liquid crystal
The commercially available nematic LC, 5CB (Merck, Germany) was used as a LC host matrix. An 5CB molecule consists of a rigid moiety of linked two benzene rings: C5H11-Ø-Ø-C N. It has a considerable dipole moment, D concentrated on CN group, polarizability 33.1, positive dielectric anisotropy , and exists in nematic phase within the temperature range from 295.5 to 308.5 K diMatteo . In the nematic and isotropic phases 5CB molecules form dipole -dipole bound dimers about 2.3 nm long and 0.5 nm thick Luckhurst . The deep integration between CNTs and nematic LC and strong anchoring of LC molecules to the lateral surface of the CNTs Park2007 ; vanderSchoot2008 is expected owing to the to strong ?-stacking hexagon-hexagon interactions between benzene rings and hexagon cells of carbon lattice Jeon2007 .
II.2 Multiwalled carbon nanotubes
The MWCNTs were produced from ethylene by CVD method, involving using of FeAlMo as a catalyst (SpecMash Ltd., Ukraine, Fax: 380 44 5010620) Melezhyk2005 . The MWCNTs were further treated by alkaline and acidic solutions and washed by distilled water until reaching of distilled water pH in the filtrate. The residual mass content of the mineral additives was 0.1%. The specific surface area of the tubes was 190 m2/g.
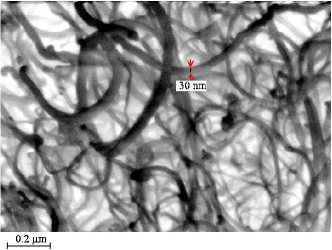
Fig. 1 shows the scanning electron microscopy (SEM) images of the MWCNTs in the powder state. High resolution environmental SEM images were obtained at room temperature using an XL30 ESEM-FEG instrument (Philips International, Inc., Washington, USA), operating at the voltage of 15 kV and the pressure of 1.4-3.0 Torr.
Typically, such MWCNTs have a mean outer diameter of nm and a length m Melezhyk2005 . The MWCNTs are presumably metallic-like due to their large diameters. The specific electric conductivity of a powder of compressed MWCNTs (at a pressure 15 of TPa) is about 10 S.cm along the axis of compression. As we will see, this influences essentially the optical properties and electroconductivity of MWCNT+5CB composites.
II.3 Preparation of MWCNT+5CB composites
The MWCNT+5CB composites were obtained by addition of the relevant quantities of MWCNTs to liquid 5CB (T=298 K). The weight concentration of MWCNTs C varied within % wt. Ultrasonication was used for preparation of homogeneous mixture of MWNTs. The MWNT suspensions were sonicated for 5 min at a frequency of 22 kHz and an output power of 150 W using ultrasonic disperser UZDN-2T. Ultrasonication is an accepted technique for dispersing the highly entangled or aggregated nanotube samples Cheol2002 , but longer times of high-energy sonication can introduce defects and decrease the lengths of nanotubes Hilding2003 .
II.4 Sandwich-type LC cells
The various techniques were previously used for characterization of the physical properties of a CNT+LC system Trushkevych . in a sandwich-like LC cell, including electrical conductivity Lebovka2008 , optical Lysetski2009 and electrooptical Lysetski2009 ; Dolgov2008 measurements. In this work, the sandwich-type cells with different thickness were used in optical and electrical conductivity measurement experiments. The thickness of a cell for optical/electrooptical measurements h was typically 20 and 100 m to obtain the high quality optical images in the investigated range of weight concentration of MWCNTs ( % wt). Construction of the used sandwich-type electro-optical LC cell for optical measurements is shown (Fig.2).
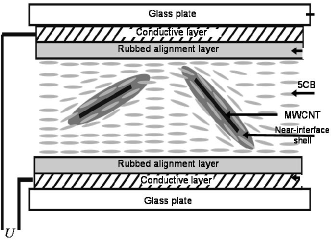
The interfacial shell, formed by 5CB molecules covering the MWCNT surface is shown schematically. The conductive TiO2 layers, covered by polyimide, were used. The thickness of the cells was set by glass spacers. The polyimide SE150 (Nissan, Japan) layers were rubbed by a fleecy cloth in order to provide a uniform planar alignment of LC in the field-out state. The cells were filled by MWCNT+5CB composite, assembled so that the rubbing directions of the opposite aligning layers were anti parallel, and then sealed.
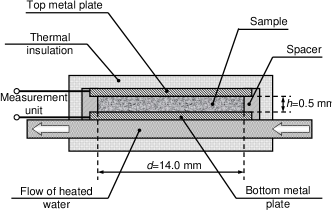
Contrary, large 500 m gold-covered cells were used for electrical conductivity measurements (Fig.3). The large thickness of a cell allows to eliminate direct electrical contacts between the electrodes through the MWCNT compact bungles and clusters. Moreover, in the thin cells (m), the size of the compact clusters is comparable with the size of the cell. Therefore, electrical conductivity and percolation characteristics can reflect the crossover behavior Lebovka2002 . No special orienting agents were used in experiments with thick cells, because they can influence the accuracy of electrical conductivity measurements. We did not use capillarity method for filling the cell, because this method may result in size selectivity of MWCNT clusters and unpredictability of MWCNT concentration inside the cell.
II.5 Optical microscopy investigations
The polarization microscope BX51 (Olympus, USA) was used in optical microscopy investigations. It was equipped by modern compound microobjectives with micro size focal area and long enough effective focal length, permitting high-resolution measurements of optical structure inside a LC cell through 1 mm thick glass cover sheet. The microscope construction admitted translation of microscope stage along the optical axis with precision up to 1 micrometer. This has allowed precise choosing of the best plane for optical measurements. Moreover, it is useful for testing the interfacial micro-size shells surrounding MWCNT aggregates and their 3d structures. The structure of interfacial shells, surrounding the aggregates, was studied in the quasi monochromatic regime using the interference filters with 10 nm FWHM (full width at half maximum). The AC voltage (up to 11V) at frequency of 10 kHz was applied to electrooptical cells (Fig.2). The 10 kHz AC was used to prevent undesired polarization phenomena near the electrodes.
II.6 Optical singularities
Ramified structure of LC interfacial shells is promising for appearance of optical singularities, born in zero-amplitude points of a light field full destructive interference Nye ; Soskin2001 . Singularities appear in a natural way in optical speckle fields with random amplitude and phase distribution Freund2002 ; Vasil'ev2008 .
It was reasonable to search for them in speckles created in a laser beam propagating through MWCNT +5CB cell. There are two types of optical singularities: optical vortices (OVs) in scalar fields and polarization singularities Nye ; Soskin2001 . Main polarization singularities are C-points.
The arbitrary polarized elliptic light fields possess simultaneously three kinds of actual OVs:
(i) the Stokes vortices S12 located in the intersection point of Stokes zero lines S1 and S2;
(ii) the opposite circularly polarized ordinary vortex underlying each C-point; and
(iii) the component vortices of any scalar component of the field.
It was reasonable to search for C-points in the speckle structure created in a laser beam propagating through 5CB +MWCNT. Their appearance was checked by the two-arm scheme (Fig.4a).
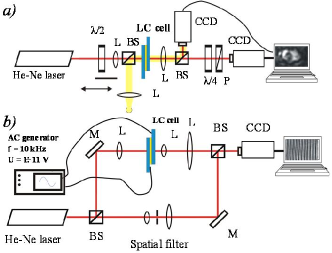
The beam was projected on the subsidiary CCD1 camera. A needed fragment of MWCNT structure was chosen by transverse translation of the cell. The 5x microobjective projected the laser beam transmitted through the cell to the camera CCD2, and Stokes components were measured.
Optical vortices were detected by the usual two-beam scheme with plane reference beam (Fig.4b) Soskin2001 . Mirror M2 was inclined at a small angle to the beam axis for creation of interference pattern between the reference beam and the object beam. OVs were detected by well known ”fork fringes” Soskin2001 .
II.7 Electrical conductivity measurements
The electrical conductivity was measured for unaligned samples by the inductance, capacitance and resistance (LCR) meter 819 (Instek, 12 Hz-100 kHz) in a cell (Fig. 2) equipped with two horizontal gold electrodes (diameter mm, inter-electrode space m). The applied external voltage was V. The measuring frequency was chosen within Hz. In typical experiments, the voltage and frequency dependences at MWCNT concentrations below the percolation threshold ( % wt) (tunneling/hopping regime) and above it (multiple contacts regime) were investigated.
II.8 Computer assisted image analysis of multiwalled carbon nanotubes
The binary images were analysed using the box-counting method, with the help of the image analysis software. The ’capacity’ fractal dimension was obtained from dependence of the number of boxes necessary to cover the boundary of an aggregate versus the box size , Feder1988 ; Smith1996 . The estimated fractal dimension depicts the morphology of a checked aggregate in 2d projection. Its value varies between 1 (corresponding to a linear aggregate) and 2 (corresponding to a compact aggregate). The fractal dimension corresponding to three-dimensional aggregates can be estimated as Feder1988 .
II.9 Statistical analysis
Each measurement was repeated, at least, five times to calculate the mean value of the experimental data.
III RESULTS AND DISCUSSIONS
III.1 Aggregation of MWCNTs
Typically, the concentration of MWCNTs in investigated composites varied in a wide interval from up to few % wt Zakri . Ultrasonication allowed good dispersion of MWCNTs to the isolated small bundles.
The strong aggregation tendency of MWCNTs, related to van der Waals attraction, increases with increase of . The typical micro photos of MWCNT+5CB composites at different MWCNT concentrations between % wt., along with data of fractal analysis, are shown in Fig. 5.
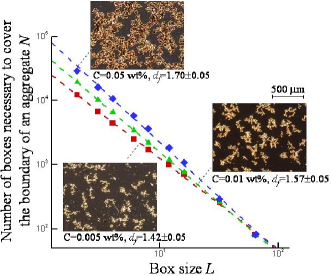
At small concentrations of MWCNTs ( % wt), the separated islands of aggregates in a ”sea” of nematic 5CB are realized. These aggregates become thicker and capture sometimes small nematic ”lakes” when weight percentage grows (See pattern for % in Fig.5). The mean aggregate size and distance between aggregates are of order of m. They are distributed randomly in space, which corresponds to the random distribution of aggregation seeds, formed in initially homogeneous composite.
Taking into account 3d structure of these aggregates and dimensions of individual MWCNT, nm and m, each aggregate contains in average up to the million of nanotubes. At percolation threshold, visually observed near the concentration % the aggregates formed the span network. At larger concentration of MWCNTs (See pattern for % wt in Fig.5), the individual aggregates disappeared and MWCNTs formed dense networks with inner isolated 5CB ”lakes”. Borders of aggregates were extremely ramified and fractal analysis of 2d contours of the aggregates was made (Fig.5). It was performed on twenty random fragments for each concentration of nanotubes. The most smooth and most fractal (the highest fractal dimension ) were inner borders of 5CB ”lakes” inside nanotube networks at largest concentration of MWCNTs, wt %. However, the fractal dimension decreased with decrease of : and for aggregates at concentrations of 0.01 and 0.005 wt %, respectively.
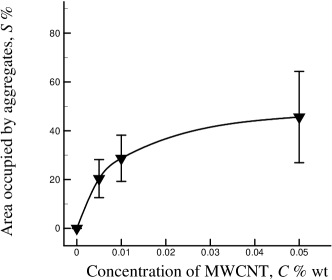
Fig.6 presents projected area versus the concentration of MWCNTs in m cells, where the solid line corresponds to the least square fitting of the experimental points (filled gradients, ) to the power function, i.e., , with . Note, that for pure 2d filling, the linear dependence between and should be fulfilled both for fractal and compact objects, i.e., . For 2d projection of unconfined 3d compact objects, , while empirical estimates give for fractal objects; as example, for soot aggregates and Koylu1995 . The observed anomalous behavior with , possibly, reflects the effects of spatial confinements in small 20 m cells. The slow growth of with increasing () reflects formation of stacked compact aggregates in lateral direction to the cell wall with small projected area.
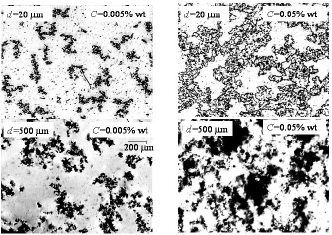
Fig.7 compares the aggregate structures formed in the cells with small (m) and large (m) thickness. Note that aggregate dimensions can reach multimicrometer size even at small concentration of MWCNTs, below the percolation threshold. For example, at % wt, the linear dimensions of aggregates exceed m (Fig.5). So, even at small concentration of MWCNTs, the spatial confinements in a small thickness cell, m, can seriously affect the aggregate structure and bring to formation of a stacked compact aggregate. For larger cell with thickness of m, such effects become weaker. Nevertheless, difference in a visual perception of the structure of aggregates for % wt in both cells was not very significant. The important difference in the structure of aggregates, formed in the cells with small (m) and large (m) thickness, was observed at large concentration of MWCNTs % wt that exceeded the percolation threshold. The clusters were visually thicker in a cell with small thickness, m.
III.2 Induced polarization singularities and optical vortices
Fig.8 shows two qualitatively different examples of near- and far-field structures: mainly clean laser beam core area (Fig.8a) and pronounced nanotube aggregates (Fig.8c).
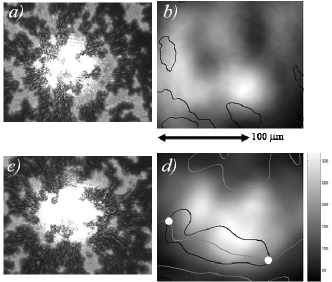
As expected, no singularities exist in the clean area (Fig.8b) in contrary to the pair of C-points appearing on two interception points of the Stokes S1 and S2 zero-lines on slopes of the intensity distribution Freund2002 (Fig.8d).
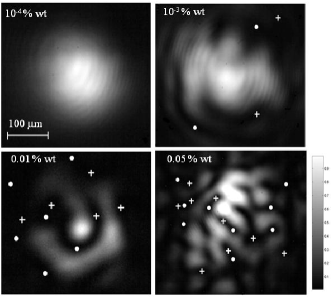
The induced optical vortices in MWCNT+5CB cells (Fig.9) at different concentrations were checked using the far-field microscopy scheme (Fig.4b). At very small concentration of MWCNTs wt %, the optical vortices were absent. They started to appear at wt% in the periphery of a beam core (Fig.9b). Further increase of in the interval between 0.01 and 0.05 wt% resulted in more speckle structuring of the beam core and generation of new optical vortices between them (Fig.9c,d). Enhanced generation of optical vortices in the vicinity of percolation threshold reflects appearance of spanning networks. Evidently, such fractal structure of MWCNT aggregates and highly anisotropic random structure of LC interfacial shells initiate complicated polarization microstructure of a propagating light beam. However, direct relation between concentration of optical vortexes and percolation characteristics is still unclear and requires more thorough study in future.
III.3 Percolation behavior of electrical conductivity
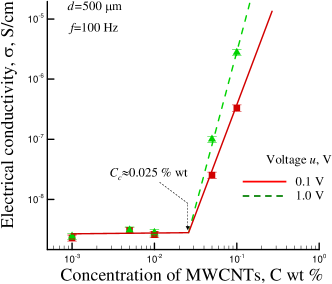
The electrical conductivity of MWCNT+5CB composites was within S/cm at small concentration of MWCNTs C (below 0.01 % wt) and was close to the electrical conductivity of pure 5CB ( S/cm). With increase of MWCNT concentration C within 0.01 and 0.1%, an abrupt growth of by several orders of magnitude was observed. It evidently reflected the percolation transition from non-conducting to conducting state at the percolation threshold concentration % wt.
Formation of the percolating structures at % wt was supported also by the observed optical microscopy images. Namely, at this concentration of nanotubes, the MWCNT aggregates start to touch and formation of the spanning networks occurs. This demonstrates close relation between direct optical observations and behavior of electrical conductivity in MWCNT+5CB composites.
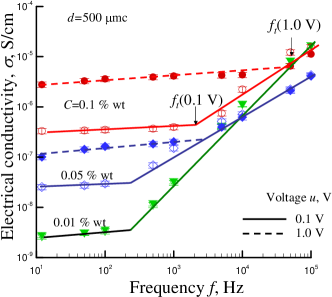
The electrical conductivity in the studied MWCNT+5CB composites was the increasing function of applied voltage and frequency (Fig.10). The non-ohmic behavior was also observed in current-voltage characteristics of MWCNT+EBBA composites Lebovka2008 . It can be explained on the basis of hopping-tunneling model of transport disruption across the insulating LC regions between the MWCNTs Mott1971 .
An increase of with increase evidenced capacitive nature of electric conductivity. It is specific for behavior of the electrical conductivity of a MWCNT composite. Note that the frequency dependence of became essential above some transition frequency value, , where the scaling law of type was observed. The value of was an increasing function of MWCNT concentrations . The observed scaling law of type evidenced the presence of the hopping/tunneling mechanism of charge transfer for high frequencies above . Above percolation threshold at % wt, dependence of vs the applied voltage was also observed (Fig.11). For example, Hz and Hz at % wt and Hz and Hz at % wt.
III.4 Electric field driven effects
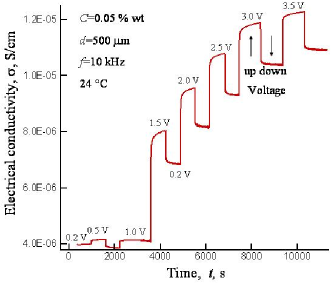
The demonstrated dependence of versus the applied voltage (Fig.11) evidences the presence of field contribution to the conductivity mechanism, related with the structure of LC medium between different MWCNTs. The presence of such electric field driven effect to the electrical conductivity is supported by the observed transient behavior of electrical conductivity after abrupt changing of the applied voltage.
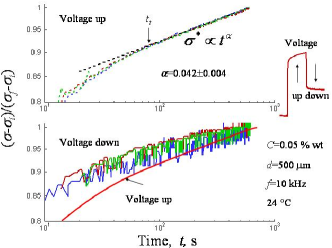
Fig.12 shows time dependence of electrical conductivity in the experiments with abrupt increase of voltage from initial value 0.2 V up to 0.5 ( mode) during the time of exposure s, followed by it abrupt decrease to the initial value of 0.2 V ( mode) during the time of exposure s and further cyclic voltage increase up to the final value of 3.5 V in the last up-down voltage cycle. The electrical conductivity continually increased and the transient behavior was observed after each such up-down voltage cycle.
Fig.13 demonstrates such transient behavior of electrical conductivity in the scaled coordinates vs , where is the initial conductivity (before abrupt change of voltage), is the final conductivity after exposure time of s, and time t is counted after the abrupt change of voltage.
It is interesting, that for all the studied processes with jumps to different values of during the separate voltage cycles, the transition curves were falling into the universal master curves for and modes, and the curves were smoother for mode than for mode. Two different time processes were evidently present for the studied system: the faster (at 100 s) and slower power law process at long exposure times: with for mode and for mode. The fast process, possibly, reflects the time relaxation evolving 5CB and MWCNT coupling, and the slow process may be related with structural reorganization of MWCNT networks driven by electric field. The presence of such changes is supported by the observed irreversible increase of electrical conductivity after the voltage on/off circles.
The explanation of the electric field driven transient effect requires the appropriated physical model. The similar transient behavior in response of electrical conductivity to on/off switching of the electric field was previously observed in suspensions of MWCNTs in distilled water, ethanol, and isopropanol Liu2004 . The observed electric field driven effects can be related to migration of CNTs and their alignment by electric fields Yamamoto1998 ; Chen2001 ; Nagahara2002 ; Krupke2003 ; Peng2008 . The AC electric charging induces MWCNTs movement in gradient directions of electric intensity, well known as dielectrophoresis electrokinetic flow. Consequently, the CNTs can be rotated and aligned in the LC media by dielectrophoretic force. This phenomenon occurs, when the complex permittivity of the suspended CNTs differs from that of the medium.
The strong electric field gradient is also expected near the surface of ramified MWCNT aggregates. So, dielectrophoresis mechanism may be appropriate for explanation of the observed transient phenomena. It was previously shown that MWCNTs were not only aligned along the field, but they were also migrating laterally, adding thickness to MWCNT shells, and these processes were the function of magnitude, frequency, and time of electric field application Wang2008 .
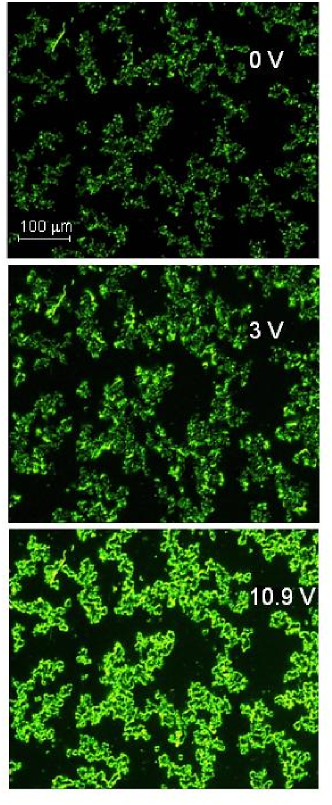
The strong electric field gradient near the surface of MWCNT aggregates can noticeably perturb the LC structure in the interfacial shells surrounding the MWCNT aggregates. This effect can be directly demonstrated by analyzing the optical microscopy images of aggregates at different values of applied voltage .
The examples of such images for 0.05 % MWCNT +5CB composite at different are presented in Fig.14. The presence of enlightenment shells near the surface of MWCNT aggregates clearly reflected the strong anchoring of 5CB molecules to the surface of MWCNTs Goncharuk . The strong anchoring between 5CBs and lateral surface of MWCNTs is the result of the similarity of carbon hexagons in 5CB and MWCNTs. The observed enlightenment shells can be explained by the presence of complicated 3d fields of elasticity strength inside the layers of anchored 5CBs that results, in turn, in perturbation of refractive index distribution near the surface of MWCNTs. The thickness of interfacial shells, surrounding the MWCNT aggregates, was dramatically dependent upon the applied voltage U (Fig.15).
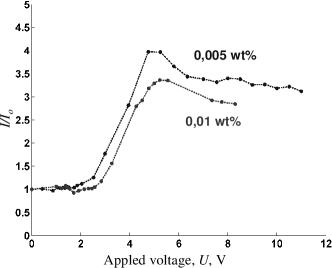
In order to quantify this effect, the integral image intensity was calculated by integration of the local image intensity over the whole image area:
. Fig.15 presents dependence of for two MWCNT+5CB composites. The value of reached the maximum near some threshold value of V, and at high voltages it decreased insignificantly. The qualitatively similar dependences were observed also for other investigated concentrations of MWCNTs in the vicinity of the percolation threshold. The observed effect of the field on the thickness of interfacial LC shells surrounding the MWCNT aggregates, possibly, reflects the electric field driven enhancement of LC structure perturbation in the interfacial shells and influence of MWCNT loading on the Frederick’s transition inside nematic matrix Blinov .
III.5 Nematic to isotropic phase transition driven effects
The phase state of LC matrix may play essential role in determination of the structure of the interfacial LC shells surrounding the MWCNT aggregates, their thickness and electrophysical properties of MWCNT+5CB composites.
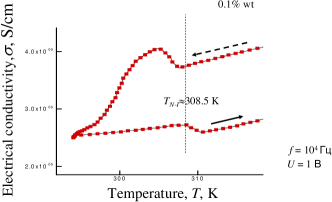
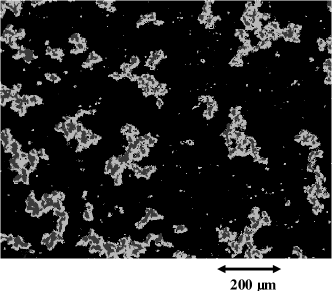
Fig. 16 presents the electrical conductivity versus the temperature for 0.1 % wt MWCNT+5CB composites. The temperature was initially increased up to 330 K and then decreased to the room temperature. The electrical conductivity data demonstrated the presence of distinct non-monotonous behavior in the vicinity of nematic-isotropic transition (K) for both thermal heating and cooling regimes. The electrical conductivity was dropped to lower level at transition from nematic to isotropic state, and it evidently reflects the effects of interfacial LC shells, surrounding the MWCNT aggregates.
It is expected that thickness of interfacial LC shells can noticeably decrease in the vicinity of phase transition in isotropic phase, K. Fig. 17 compares the structure of MWCNT aggregates in nematic state at 297 C (white grey) and in the pre-transition state at 305.5 C (dark gray).
Two pronounced changes were shown by comparison of the visual patterns of aggregates:
(i) ”disappearance” of the small islands of MWCNTs, and
(ii) essential shrinkage of area, occupied by the aggregates of nanotubes (nearly twice shrinkage of their visible dimensions) with temperature increase.
Both effects can be explained accounting for the decrease of thickness of the interfacial LC shells, surrounding the MWCNTs. As a result, single CNTs and their subwavelength bundles are below resolution of usual optical microscopes.
IV CONCLUDING REMARKS
Up to now, no adequate theories exist for description of optical and electro-physical properties of MWCNT+LC composites. The obtained results allow formulation of some physical model for description of these properties. The essential property of MWCNT+5CB composites is the presence of a high level self-organization, formation of MWCNT aggregates and the interfacial shells (of micrometer thickness), surrounding the MWCNTs. In particular, in the studied MWCNT+5CB composites, the strong planar anchoring of 5CB molecules on MWCNT lateral surfaces was realized by attraction of two benzene carbons to carbon hexagons of the lateral surface of nanotubes. It induces elastic strains, including torsion in the neighboring layers of 5CB host, and produces irregular birefringence, which forms micro size optical cladding, easily observed through good quality polarization microscope. Application of the crossed electric field causes the Frederick’s transition of nematic molecules, which rotate in the plane of incident. The nanotubes tried to align along E also, which leaded to growth of the cladding dimensions. The fractal structure of MWCNT aggregates and highly anisotropic random structure of interfacial LC shells, surrounding the aggregates, initiates a complicated polarization microstructure of the propagating light beam and appearance of optical singularities.
Obtained results can be summarized as follows:
1. The homogenized MWCNT +5CB composites transform in LC cell into system of volume aggregates of hundreds of thousand nanotubes with fractal boarders for limited range of MWCNTs content %wt.
2. 5CB molecules are planar oriented on lateral surface of each MWCNT. As a result, the macroscopic birefringent irregular interfacial shell appears. It defines decisively singular and electrooptical properties of MWCNT +5CB composites. The interfacial shells surrounding MWCNT disappeared at isotropic phase what made the small MWCNT clusters invisible in optical microscope.
3. Laser beam is strongly speckled during the propagation through heterogeneous birefringent LC interfacial shells and diffraction on fractal borders of MWCNT aggregates. As a result, polarization singularities and all types of optical vortices were nucleated. Electric field influenced strongly the optical singularities nucleation through the change of LC interfacial shell’s birefringent structure.
4. The studied MWCNT +5CB composites exhibited three known regimes of electrical conductivity:
(i) tunneling-hopping at C=0.005
(ii) percolation at C=0.025 wt %; and
(iii) multiple-contacts at C=0.05 wt %.
The electrical conductivity grew drastically in the vicinity of percolation threshold, when the gaps between different clusters disappeared. The electrical conductivity was an increasing function of the applied voltage U. The frequency dependences of were also observed for all the C values within 0-0.1 % wt and frequency f within 10-105 Hz. This behavior evidences the hopping/tunneling nature of the mechanism of charge transfer through LC the interfacial shell, surrounding the MWCNTs.
5. The optical microscopy data evidenced that increase of voltage U resulted in a drastic increase of thickness of the interfacial LC shells, surrounding the MWCNT aggregates, and this effect was most pronounced at U 5 V in 20 m cell. The presence of electric field driven effects was also supported by the transient behavior of electrical conductivity. The two different time processes were activated by electric field in the voltage on/off circles. The fast and slow processes presumably reflected the time relaxation in interfacial shells evolving coupling of MWCNTs and 5CB and the reorganization of MWCNT network structure, respectively. Moreover, the thickness of LC interfacial shells, surrounding the aggregates, was sensitive to phase state of 5CB matrix. This resulted in a distinct non-monotonous behavior of electrical conductivity in the vicinity of nematic-isotropic transition (TNI 308.5) and was supported by visually observed essential shrinkage of area, occupied by interfacial shells and MWCNT aggregates, with temperature increase.
6. Totality of obtained results started singular optics of CNT+LC composites.
V ACKNOWLEDGEMENT
Authors are thankful to Profs. Yuri Reznikov and Victor Reshetnyak for useful consultations on LC physics, Dr. Vasil’ Nazarenko for polarization microscope Olympus, computer controlled oven and useful LC discussions, PhD Alex Shumelyuk for electrical generator and oscillograph. The work was partially supported by project STCU No. 4687, projects 2.16.1.4, 2.16.1.7 (NAS of Ukraine) and F28.2/058 (FFS, Ministry of Education & Science of Ukraine).
References
- (1) Zakri, C., ”Carbon nanotubes and liquid crystalline phases,” Liq. Cryst. Today 16, 1-11 (2007).
- (2) Lagerwall, J. P. F., Scalia, G., ”Carbon nanotubes in liquid crystals,” J. Mater. Chem. 18, 2890-2898 (2008).
- (3) Trushkevych O. et al. ”Characterization of carbon nanotube-thermotropic nematic liquid crystal composites,” J. Phys. D: Appl. Phys. 41, 125106-125117 (2008).
- (4) Zhao, W. et al. ”Preparation and characterization of carbon nanotubes/monotropic liquid crystal composites,” Appl. Surf. Sci. 255, 6589-6592(2009).
- (5) Rahman, M., and Lee, W., ”Scientific duo of carbon nanotubes and nematic liquid crystals,” J. Phys. D: Appl. Phys. 42, 063001-12 (2009).
- (6) Saito, R., Dresselhaus, G., and Dresselhaus, M. S., [Physical Properties of Carbon Nanotubes], Imperial College Press, London (2001).
- (7) Lebovka, N., Dadakova, T., Lysetskiy, L., Melezhyk, O., Puchkovska, G., Gavrilko, T., Baran, J., Drozd, M., ”Phase transitions, intermolecular interactions and electrical conductivity behavior in carbon multiwalled nanotubes/nematic liquid crystal composites,” Journal of Molecular Structure 877, 135-143 (2008).
- (8) Lysetski, L. N., Minenko, S. S., Fedoryako, A. P., and Lebovka, N. I., ”Dispersions of multiwalled carbon nanotubes in different nematic mesogens: The study of optical transmittance and electrical conductivity,” Phys. E 41, 431-435 (2009).
- (9) Russell J. M., et al. ”Alignment of nematic liquid crystals using carbon nanotube films,” Thin Solid Films 509, 53 - 57 (2006).
- (10) Duran, H., Gadzeski, B., Yamasita, A., and Kyu, T. ”Effect of carbon nanotubes on phase transitions of nematic liquid crystals,” Liquid Crystals 32 (7), 815-821 (2005).
- (11) Dierking, I., Scalia, G., Morales, P., and. LeClere, D., ”Aligning and Reorienting Carbon Nanotubes with Nematic Liquid Crystals,” Adv. Mater. 16, 865-869 (2004).
- (12) Lynch M. D., and Patrick, D. L., ”Organizing carbon nanotubes with liquid crystals,” Nano Lett. 2 (11) 1197-1201 (2002).
- (13) Dierking, I., Scalia, G., Morales, P., ”Liquid crystal-carbon nanotube dispersions,” J. Appl. Phys. 97, 044309 (2005).
- (14) Lagerwall, J. P. F., Dabrowski, R., Scalia, G., ”Antiferroelectric liquid crystals with induced intermediate polar phases and the e?ects of doping with carbon nanotubes,” J. Non-Crystalline Solids 353, 4411-4417 (2007).
- (15) Baik, I.-S., et al. ”Electrical-?eld effect on carbon nanotubes in a twisted nematic liquid crystal cell,” Appl. Phys. Lett. 87, 263110 (2005).
- (16) Wang H., et al. ”Shear-SANS study of single-walled carbon nanotube suspensions,” Chem. Phys. Lett. 416, 182-186 (2005).
- (17) Srivastava, A. K., et al. ”Temperature dependent physical properties and electro-optical studies of carbon nanotubes doped nematic liquid crystal mixture,” Poster 4-NAN22, The 22nd International Liquid Crystal Conference, Jeju, Korea (2008).
- (18) Shah, H. J., et al. ”Field controlled nematic-to-isotropic phase transition in liquid crystal-carbon nanotube composites,” J. Appl. Phys. 103, 064314 (2008).
- (19) Dierking, I., Casson, K., and Hampson, R., ”Reorientation Dynamics of Liquid Crystal-Nanotube Dispersions,” Japan. J. Appl. Phys. 47 (8), 6390-6393 (2008).
- (20) Lu, S.-Y., and Chien L.-C. ”Carbon nanotube doped liquid crystal OCB cells: physical and electro-optical properties,” Opt. Express 16, 12777 (2008).
- (21) Lee, W.; Wang, Chun-Yu & Shih, Yu-Cheng, ”Effects of carbon nanosolids on the electro-optical properties of a twisted nematic liquid-crystal host,” Appl. Phys. Lett. 85, 513-515, (2004). DOI: 10.1063/1.1771799.
- (22) Huang, C.-Y., Hu, C.-Y., Pan, H.-C., and Lo, K.-Y., ”Electrooptical Responses of Carbon Nanotube-Doped Liquid Crystal Devices,” Japan. J. Appl. Phys. 44, 8077-8081 (2005).
- (23) Jayalakshmi, V.; Prasad, S. Krishna, ”Understanding the observation of large electrical conductivity in liquid crystal-carbon nanotube composites,” Applied Physics Letters 94 (20) 202106 (2009).
- (24) Nye, J. F., [Natural Focusing and Fine Structure of Light], Institute of Physics Publishing, Bristol, (1999).
- (25) Soskin, M. S., Vasnetsov, M. V., ”Singular optics,” Progr. Opt. 42, 219-276 (2001).
- (26) di Matteo, A., Ferrarini, A., ”A molecular based continuum approach for the dielectric permittivity of liquids and liquid crystals,” The Journal of Chemical Physics 117 (5), 2397-2414 (2002).
- (27) Luckhurst, G., Stephans, R., Phippen. R., ”Computer simulation studies of anisotropic systems. XIX. Mesophases formed by the Gay-Berne model mesogen,” Liq. Cryst. 8, 451 (1990).
- (28) Park, K. A., ”Anchoring a Liquid Crystal Molecule on a Single-Walled Carbon Nanotube,” J. Phys. Chem. C 111, 1620-1624 (2007).
- (29) van der Schoot, P., Popa-Nita, V., and Kralj, S., ”Alignment of Carbon Nanotubes in Nematic Liquid Crystals,” J. Phys. Chem. B 112, 4512-4518 (2008).
- (30) Jeon, S. Y., ”Effects of carbon nanotubes on electro-optical characteristics of liquid crystal cell driven by in-plane ?eld,” Appl. Phys. Lett. 90, 121901 (2007).
- (31) Melezhyk, A. V., Sementsov, Yu. I. & Yanchenko, V. V., ”Synthesis of fine carbon nanotubes co-deposited at metallic oxide catalysts,” Appl. Chem. 78, 938-943 (2005). (in Russian)
- (32) Cheol, P., Zoubeida, O., Watson, K. A., Crooks, R. E., Smith, J., Lowther, S. E., Connell, J. W., Siochi, E. J., Harrison, J. S., Clair, T. L., ”Dispersion of single wall carbon nanotubes by in situ polymerization under sonication,” Chem. Phys. Lett. 364, 303 (2002).
- (33) Hilding, J, Grulke, E. A., Zhang, Z. G., and Lockwood, F., ”Dispersion of carbon nanotubes in liquids,” J. Dispers. Sci. Technol. 24, 1-41 (2003).
- (34) Dolgov, L.; Yaroshchuk, O. & Lebovka, M. ”Effect of electro-optical memory in liquid crystals doped with carbon nanotubes,” Mol. Cryst. Liq. Cryst. 496, 212-229 (2008).
- (35) Lebovka, N. I., Manna, S. S., Tarafdar, S., and Teslenko, N., ”Percolation in Models of Thin Film Depositions,” Phys. Rev. E 66, 066134-066138 (2002).
- (36) Freund, I., Soskin, M. S., Mokhun, A. I., ”Elliptic critical points in paraxial optical fields,” Opt. Commun. 208, 223-253 (2002).
- (37) Vasil’ev, V., Soskin, M., ”Topological and morphological transformations of developing singular paraxial vector light fields,” Optics Communications. 281 (22), 5527-5540 (2008).
- (38) Feder, J., [Fractals], Plenum, New York (1988).
- (39) Smith, T. G., Jr, Lange, G. D., and Marks, W. B., ”Fractal Methods and Results in Cellular Morphology,” J. Neurosci. Methods 69, 1123-1129 (1996).
- (40) Koylu, U. O., Faeth, G. M., Farlas, T. L., and Carvalho, M. G., ”Fractal and Projected Structure Properties of Soot Aggregates” Combustion and Flame 100,621-633 (1995).
- (41) Mott, N. F., & Davis, E. A., [Electronic processes in Non-Crystalline Materials], Clarendon Press, Oxford, (1971).
- (42) Liu, L., Yang, Y., Zhang, Y., ”A study on the electrical conductivity of multi-walled carbon nanotube aqueous solution,” Phys. E 24, 343-348 (2004).
- (43) Yamamoto, K., Akita, S., Nakayama, Y., ”Orientation and purification of carbon nanotubes using ac electrophoresis, ” J. Phys. D: Appl. Phys. 31, L34 (1998).
- (44) Chen, X. Q., Saito, T., Yamada, H., Matsushige, K., J. Appl. Phys. Lett. 78, 3714 (2001).
- (45) Nagahara, L.A., Amlani, I., Lewenstein, J., Tsui, R. K., J. ”Directed Placement of Suspended Carbon Nanotubes for Nanometer-scale Assembly,” Appl. Phys. Lett. 80, 3826 (2002).
- (46) Krupke, R., Hennrich, F., Leohneysen, H.V., Kappes, M.M., ”Simultaneous Deposition of Metallic Bundles of Single-walled Carbon Nanotubes Using Ac-dielectrophoresis, ” Sci. 301, 344 (2003).
- (47) Peng, N., Zhang, Q. and Sun, Y., ”Motion of Carbon Nanotubes in suspension under AC electric field,” Int. J. Nanomanufacturing, 2, Nos. 1/2, (2008).
- (48) Wang, M.-W., Hsu, T.-C. and Weng, C.-H., ”Alignment of MWCNTs in polymer composites by dielectrophoresis,” Eur. Phys. J. Appl. Phys. 42, 241-246 (2008).
- (49) Goncharuk, A. I., Lebovka, N. I., Lisetski, L. N., and Minenko, S. S., ”Aggregation, percolation and phase transitions in nematic liquid crystal EBBA doped with carbon nanotubes, ” J. Phys. D: Appl. Phys. 42, 165411-165419 (2009).
- (50) Blinov, L. M. and Chigrinov, V. G., [Electrooptic Effects in Liquid Crystal Materials] Springer, Singapore, (1994).