Quantitative measure of evolution of bright cluster galaxies at moderate redshifts
Abstract
Using archival data from the Hubble Space Telescope, we study the quantitative morphological evolution of spectroscopically confirmed bright galaxies in the core regions of nine clusters ranging in redshift from to . We use morphological parameters derived from two dimensional bulge-disk decomposition to study the evolution. We find an increase in the mean bulge-to-total luminosity ratio as the Universe evolves. We also find a corresponding increase in the fraction of early type galaxies and in the mean Sérsic index. We discuss these results and their implications to physical mechanisms for evolution of galaxy morphology.
keywords:
galaxies: photometry — galaxies: formation — galaxies: evolution — galaxies: fundamental parameters1 Introduction
Clusters serve as laboratories for investigating the dependence of galaxy morphology on the density of the environment. Dressler (1980) found that the fraction of early type galaxies increases with local density of galaxies. He also found that around 80% of galaxies in nearby clusters are of the early type. In recent years, deep, high resolution imaging by the Hubble Space Telescope (HST) has helped to extend the study of galaxy morphology as a function of the environment to . The observed fraction of different morphological types can be explained in terms of both ’nature’ and ’nurture’ scenarios. The former argues that a galaxy’s morphological type is determined by initial conditions at formation (e.g. Eggen, Lynden-Bell & Sandage, 1962), while the latter depends on the influence of the environment and of secular evolution for determining the final morphological type (e.g. Toomre, 1977). Numerical simulations play an important role in investigating the relative importance of the two scenarios under different physical conditions.
Following Dressler’s pioneering work, many observational studies have been done to measure and understand the morphology density relation (MDR), and the dependence of morphological type on distance of the galaxy from the cluster centre (Dressler et al., 1997; Goto et al., 2003; Smith et al., 2005; Postman et al., 2005; Holden et al., 2007; Treu et al., 2003; Capak et al., 2007). Smith et al. (2005) found that the early type fraction is constant in low density environments over the last 10 Gyr, but there is significant evolution in this fraction in higher density regions. According to Smith et al. (2005), this suggests that most of the ellipticals in clusters formed at high redshift, and the increase in the fraction of early type galaxies is because of the physical processes in dense regions which transform disk galaxies with ongoing star formation to early types. Dissipationless merging of cluster galaxies may also be responsible for this increase.
There is increasing evidence to show that massive ellipticals formed by dissipationless (dry) merger of two or more systems. Such ellipicals must have formed at later times than their low luminosity counterparts (de Lucia et al., 2006). van Dokkum (2005) analysed tidal debris of elliptical galaxies and concluded that of the bulge dominated galaxies have experienced a merger. The analysis of nearby bulge dominated galaxies has shown that the gas to stellar mass ratio is very small and these mergers are mostly ’dry’. Using a semi-analytic model for galaxy formation, Naab, Khochfar & Burkert (2006) found that both the photometric and kinematic properties of massive elliptical galaxies are in agreement with the scenario where massive elliptical galaxies are produced by mergers of lower mass ellipticals. They suggested that the merger of two spiral galaxies alone cannot reproduce the observed properties, and that the large remnant mass () implies that they must have undergone elliptical - elliptical mergers. They found that this process is independent of the environment and redshift, which means that dry mergers can occur at low redshift as well. By analysing spirals from cluster and group environments at intermediate redshift (), Moran et al. (2007) found that the Tully-Fisher relation shows larger scatter for cluster spirals than for those in the field. They also found that the central surface mass density of spirals in clusters is small beyond the cluster virial radius, and argued that these observations provide evidence for merger/harrasment.
Mergers are not common in clusters, as the velocity dispersion of virialized clusters is large. So if ellipticals in clusters have formed by mergers, that most likely happened during the early stage of cluster collapse (Roos & Aarseth, 1982). There is some observational evidence to support this idea; van Dokkum et al. (1999) showed that there is a large fraction of ongoing mergers in a cluster at . The observation of the unvirialized cluster at revealed many ongoing dissipationless mergers of galaxies (van Dokkum et al., 2001). These observations go against the view of monolithic collapse where all the ellipticals formed at the same time, at very high redshift.
In this letter we report on the evolution of galaxies in the core region of clusters, measured using bulge-disk decomposition. We show that in the case of brightest cluster galaxies, the fraction of galaxies with and evolved significantly over the redshift range 0.31 to 0.83. Throughout the paper we use the standard concordance cosmology with , and km s-1 Mpc-1.
2 Cluster sample and Decomposition Technique
We have exclusively used archival Hubble Space Telescope (HST) data in this work. All of the observations used by us were obtained with either the ACS or WFPC2 cameras on-board the HST. We constructed our sample of clusters by an extensive literature survey of HST observations of moderate redshift clusters. The clusters we study span the redshift range 0.31 to 0.837. The clusters were selected such that they each had at least 15 spectroscopically confirmed cluster members listed in the literature (Couch et al., 1998; Smail et al., 1997; Dressler et al., 1999; Williams et al., 1999; Halliday et al., 2004; Demarco et al., 2005). We restricted our study only to those clusters whose second brightest member galaxy has an absolute magnitude between -25.0 and -27 in rest-frame B-band. Here the magnitudes are corrected for the cosmological surface brightness dimming. This criterion allows us to restrict ourselves to clusters of roughly comparable luminosity. Further, we only included clusters with imaging data around the rest-frame filter i.e. in filters where the central wavelength of the filter corresponded to a rest frame wavelength in the range 350-550 nm. This has the advantage that the k-correction for transformation from or filters in the observer frame, to the filter in the rest frame, has only a weak dependence on galaxy spectral type in the redshift range (Böhm & Ziegler, 2007). Incompleteness of the spectroscopy is a potential problem; since our data are drawn from a heterogeneous set of observations, it is not possible to correct for incompleteness in a completely consistent way. However, for the five clusters in our sample which are part of the ESO Distant Clusters Survey (EDisCS), Halliday et al. (2004) have shown that incompleteness does not introduce a significant bias. The level of incompleteness is also relatively small because they (like us) restrict themselves to the brighter cluster members. Nine clusters satisfied our selection conditions at the time of commencing this study; the basic data for these clusters are given in Table 1.
The images we downloaded from the HST data archive were processed in a standard way using the On-the-Fly Reprocessing (OTFR) pipeline at STScI. The processed images were dark and bias subtracted and flat-fielded by the OTFR pipeline. We combined them using the Multidrizzle package (Koekemoer et al., 2002) to flag and remove cosmic rays and to correct for geometric distortion and produced a single coadded image. For some clusters, multiple disjoint pointings have been used; in such cases we obtained multiple multidrizzled images. The correlated pixel noise introduced by the drizzle process, was corrected for, using the prescription of Casertano et al. (2000).
We computed the center of each cluster as the centroid of the brightest cluster galaxy. We then selected all galaxies with a spectroscopic redshift confirming their cluster membership and located within a 1 Mpc projected distance from the cluster center. Our study is therefore restricted to galaxies lying (mostly) within the core region of the clusters. Note that for three clusters – AC 114, CL 0303+17, and 3C 295 – the HST imaging is not complete for the 1 Mpc projected distance.
Galaxies are known to undergo luminosity evolution, to account for which we adopted the following simple scheme: , where is the redshift of the object and (Postman et al., 2005). The magnitude cutoff in the observed HST filter was then calculated using
| (1) |
where DM is the distance modulus, is the rest-frame color between and the observed HST filter and is the k-correction in the observed HST filter. The k-correction for each cluster was computed using the elliptical SED provided by Poggianti (1997). All magnitudes are in the Vega system.
With all the above constraints, we obtained a sample of 379 galaxies in nine clusters. We used the GALFIT (Peng et al., 2002) program for 2D bulge disk decomposition of the galaxy images. To fit the galaxies, we have developed an automated pipeline (Vinu et al. 2010, in preparation) which completely automates the fitting procedure and organizes the results into a database, supplemented by a number of diagnostic plots to detect anomalies. The basic steps in performing the 2D decomposition are: (1) make a cut-out image for each galaxy, including neighbouring galaxies. (2) estimate starting values of fitting parameters using the parameters measured by Sextractor (3) make masks to exclude stars, faint galaxies and other artifacts and (4) Run GALFIT. Bright neighboring galaxies were fitted simultaneously with the target galaxy. We modeled each galaxy as a linear sum of a Sérsic (for the bulge) and an exponential (for the disk) component. The centers, position angles, ellipticities and central surface brightnesses of bulge and disk were fitted simultaneously. The Sérsic index was left unconstrained. The estimation of galaxy parameters, particularly the Sérsic index, may be systematically affected if the sky or PSF are incorrectly estimated. To test for the effect of using an incorrect PSF, we ran the decomposition for each galaxy using two stellar PSFs, one constructed using the nearest star and the other using the second nearest star and compared the fitted values of and for every galaxy. To test for incorrect sky, we ran the decomposition in two modes: one in which the sky was left as a free parameter and one in which it was fixed to the local sky value as determined by Sextractor. In both tests, % of galaxies showed random changes in the extracted parameters at % level, with no obvious systematics. Our simple tests are consistent with the extensive simulations of Häussler et al. (2007) which showed that GALFIT estimates parameters accurately for HST data, even at relatively shallow depths. As an additional precaution, we examined the fit results, by eye, for every galaxy. The fit diagnostic plots were used to evaluate the quality of the fit. We used the reduced given by GALFIT to identify galaxies with large residuals. A large residual in the central part of the galaxy may be caused by improper estimation of the point spread function (PSF). Also, simultaneous fitting with neighbor galaxies needs special care as the number of free parameters is significantly larger. For galaxies that show a large residual, we took these caveats into consideration and refit the galaxies until the residual became small. We then assigned a quality factor for each galaxy based on the magnitude of the residual and the deviation of fitted position angle from the galaxy position angle estimated by eye. If a fit was below a threshold quality, we excluded that galaxy from further analysis. We found that most of the galaxies that failed the quality check, either have peculiar morphology or strong spiral arms. We successfully fit 337 out of 379 galaxies in our sample. Unless otherwise stated, all further discussion in this letter only applies to these 337 galaxies. The cluster-wise breakup of galaxies with a good fit is given in Table 1.
| Cluster | RA | Dec | z | Camera | Filter | Reference | |||
|---|---|---|---|---|---|---|---|---|---|
| AC 114 | 22 58 48.4 | -34 48 60 | 0.31 | WFPC2 | F702W | 20.77 | 72 | 68 | Couch et al. (1998) |
| CL 0303+17 | 03 06 15.9 | +17 19 17 | 0.42 | WFPC2 | F702W | 21.64 | 28 | 26 | Smail et al. (1997) |
| 3C 295 | 14 11 19.5 | +52 12 21 | 0.46 | WFPC2 | F702W | 21.93 | 37 | 32 | Smail et al. (1997) |
| CL 1232-1250 | 12 32 30.3 | -12 50 36 | 0.54 | ACS | F814W | 21.66 | 46 | 41 | White et al. (2005) |
| CL 1054-1146 | 10 54 24.4 | -11 46 19 | 0.697 | ACS | F814W | 22.44 | 30 | 25 | White et al. (2005) |
| CL 1040-1155 | 10 40 40.3 | -11 56 04 | 0.704 | ACS | F814W | 22.47 | 25 | 19 | White et al. (2005) |
| CL 1054-1245 | 10 54 43.5 | -12 45 51 | 0.75 | ACS | F814W | 22.68 | 29 | 28 | White et al. (2005) |
| CL 1216-1201 | 12 16 45.3 | -12 01 17 | 0.794 | ACS | F814W | 22.89 | 50 | 43 | White et al. (2005) |
| RX J0152.7-1357 | 01 52 27.4 | -13 55 01 | 0.837 | ACS | F775W | 23.50 | 62 | 55 | Blakeslee et al. (2006) |
: Faint magnitude cutoff in the observed HST filter, : Total number of galaxies, : Number of galaxies with good fit
3 Results
3.1 Evolution of mean bulge-to-total luminosity ratio () and Sérsic index
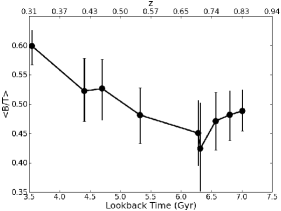
In Table 2 we list mean and median values of a few parameters of interest for all the nine clusters. Note that the bulge-to-total luminosity ratio is computed using the parameters of the best fit model. We find the of cluster galaxies in the central 1 Mpc of the clusters changes from 0.59 at redshift z = 0.31 to 0.48 0.03 at z = 0.837 (Figure 1). Errors were measured using the bootstrap resampling method (Efron & Tibishirani, 1993), in this and subsequent figures. The increase in ratio has been found qualitatively (i.e. using visual morphological classification) by previous studies (Dressler et al., 1997; Fasano et al., 2000; Smith et al., 2005); the present work obtains the result quantitatively using bulge-disk decomposition. It must be noted that, if our sample is somewhat biased towards luminous red galaxies at high-z, and if such galaxies are early type even at those redshifts, then our estimated value represents an upper limit at . In addition, incompleteness will also tend to make our estimate of too high because at fainter magnitudes we would preferentially miss low late-type galaxies (Desai et al., 2007). This leads to our estimated to be the upper limit for these clusters. So the selection bias, if any, will lead to an apparent weaker evolution. So our estimation of evolution of may be an underestimate.
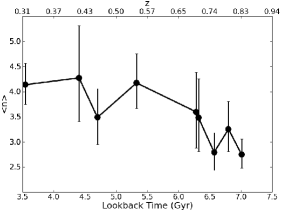
We also find that the mean value of Sérsic index decreases with lookback time over this redshift range. The value changes from 4.13 to 2.74 from to . Figure 2 shows the evolution of Sérsic index against lookback time.
| Cluster | ñ | |||
|---|---|---|---|---|
| AC 114 | ||||
| CL 0303 | ||||
| 3C 295 | ||||
| CL 1232-1250 | ||||
| CL 1054-1146 | ||||
| CL 1040-1155 | ||||
| CL 1054-1245 | ||||
| CL 1216-1201 | ||||
| RX J0152.7-1357 |
: mean value of bulge-to-total luminosity ratio, : mean value of Seŕsic index, ñ : median value of Seŕsic index, : fraction of bulge-like galaxies (see text for definition)
3.2 Evolution of bulge-like galaxy fraction
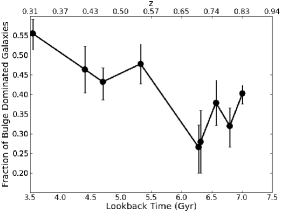
Since the decreases significantly with lookback time, one expects to see a simultaneous decrease in the fraction of early-type galaxies with a bulge-like morphology. We classify a galaxy as bulge-like if its and . The second condition is required to exclude galaxies with a very strong disk which can, on occasion, be incorrectly modeled as a bulge with (an exponential), with a correspondingly high luminosity ratio. With this definition, we are able to compute a bulge-like galaxy fraction for each cluster. In figure 3 we plot this fraction against lookback time. Note that the fraction is normalized by the total number of galaxies in the cluster, not the number of galaxies with a successful fit. The galaxies that are poorly fit are dominated by galaxies of irregular morphology. We see a near monotonic decrease with lookback time in the bulge dominated fraction of galaxies. We find 40.0 % of galaxies at redshift z = 0.837 are bulge-like. This increases to 55 % within 3.5 Gyr.
3.3 Discussion
In the last decade, several studies have reported evolution of the morphological content of galaxy clusters by a visual study of galaxy morphology (Smail et al., 1997; Couch et al., 1998; Fasano et al., 2000; Desai et al., 2007). Other studies focused on the evolution of the morphology-density relation (MDR), where morphology changes were studied as a function of redshift and galaxy density (Dressler et al., 1997; Treu et al., 2003; Postman et al., 2005; Smith et al., 2005).
In this work, we have taken the first approach; however, we have used quantitative measures of galaxy morphology rather than a qualitative morphological classification by eye. We decompose the galaxy light into bulge and disk components and study the evolution of morphology of galaxies in clusters. We find that the bulge component of the bright galaxies in clusters is, on average, becoming stronger as the Universe evolves. The fraction of bulge-like galaxies, defined as having and also increases from 40% to 55%. There is also a significant increase in the mean value of the Sérsic index as the Universe ages.
Our results on the evolution of morphological fraction are consistent with previous work on the subject (Dressler et al., 1997; Postman et al., 2005; Smith et al., 2005). However, Desai et al. (2007), using ACS observations of galaxy clusters with found no evolution of morphological fraction. At first glance, this seems to contradict our results. However, it must be noted that in our study, we are only including bright, spectroscopically confirmed cluster galaxies. If fainter galaxies are included, as was done in the sample of Desai et al. (2007), the % change we see in the morphological fraction may easily be washed out. This explanation also agrees with the results of Holden et al. (2007) who showed that there is evolution in the early type fraction with redshift if a luminosity limited sample is used.
Postman et al. (2005); Desai et al. (2007); Poggianti et al. (2009) found that the E+S0 fraction correlates with the velocity dispersion of the cluster. The fraction is large for clusters with high dispersion. This effect would be consistent with the evolution we see, provided velocity dispersion systematically decreases with redshift. We see no systematic dependence of velocity dispersion with redshift except that the two highest redshift clusters in our sample have high velocity dispersions ( km/s). This high value, which implies higher is consistent with the mild increase of and the fraction of bulge dominated galaxies for the two high clusters. But the dominating effect seems to be morphological evolution.
The of a cluster may increase either due to an increase in the strength of the bulge component of galaxies or by the fading of disk component. The increase in average bulge strength may be caused by merging which tends to produce a elliptical like morphology (van Albada, 1982; Barnes, 1992; Hernquist, 1992; Bournaud et al., 2005). On the other hand, the fading of the disk could be a by-product of the morphological transformation of galaxies. In clusters, a variety of mechanisms such as galaxy harassment (Moore et al., 1996; Moore, Lake & Katz, 1998; Moore et al., 1999), minor mergers and ram pressure stripping (Gunn & Gott, 1972; Abadi, Moore & Bower, 1999) may contribute to the disk fading.
The increase in the mean Sérsic index with cosmic time seems to indicate that mergers play a role (Scannapieco & Tissera, 2003). Merger events are common at intermediate redshift (Dressler et al., 1994). The increase in the fraction of galaxies with high and Sérsic index is possible if galaxies gradually evolve into a phase where the spheroidal component increasingly dominates. The end point of such evolution is an elliptical galaxy.
It has recently been suggested that the bright S0 population has likely formed through monolithic collapse or major mergers (Barway et al., 2007, 2009). Numerical simulations have also shown that dissipative merger of two unequal mass disk galaxies (Bekki, 1998; Bekki et al., 2005) can produce lenticulars. Recent observations of low redshift clusters suggest that a majority of the infall population is merging or interacting (Moss, 2006). Coupled with the constraints from Carlberg (1986), it is becoming increasingly clear that formation of spheroidal (mostly lenticular) galaxies through mergers is the dominant mechanism behind systematic changes in galaxy morphology.
It must be noted that the trends we see are weak and statistical in nature; they are only visible when averaged over a large number of galaxies in a large number of clusters over a wide range of redshift. The detailed physics operating in each cluster, doubtless modifies the morphological evolution of galaxies in that cluster. Nevertheless, the fact that we see trends indicates that they are real and strong enough not to be drowned by the different physical conditions and processes operating in individual clusters. Using the large database of bulge/disk decomposition results we have obtained, we are attempting to disentangle cluster specific effects from cosmological ones.
Acknowledgments
Vinu Vikram acknowledges financial support from the Council of Scientific and Industrial Research (CSIR). We thank the referee for insightful comments and suggestions that greatly improved this paper.
References
- Abadi, Moore & Bower (1999) Abadi, M. G., Moore, B. & Bower, R. G., 1999, MNRAS, 308, 947
- Barnes (1992) Barnes, F. J., 1992, ApJ, 393, 484
- Barway et al. (2007) Barway, S. et al., 2007, ApJ, 661, L37
- Barway et al. (2009) Barway, S. et al., 2009, MNRAS, 394, 1991
- Bekki (1998) Bekki, K., 1998, ApJ, 502, L133
- Bekki et al. (2005) Bekki, K., 2005, MNRAS, 359, 949
- Blakeslee et al. (2006) Blakeslee, J. P. et al., 2006, ApJ, 644, 30
- Böhm & Ziegler (2007) Böhm, A. & Ziegler, B. L., 2007, ApJ, 668, 846
- Bournaud et al. (2005) Bournaud, F. et al., 2005, A&A, 437, 69
- Capak et al. (2007) Capak, P. et al., 2007, ApJS, 172, 284
- Carlberg (1986) Carlberg, R. G., 1986, ApJ, 310, 593
- Casertano et al. (2000) Casertano, S., et al., 2000, AJ, 120, 2747
- Couch et al. (1998) Couch, W. J. et al., 1998, ApJ, 497, 188
- de Lucia et al. (2006) De Lucia, G. et al., 2006, MNRAS, 366, 499
- Demarco et al. (2005) Demarco, R. et al., 2005, A&A, 432, 381
- Desai et al. (2007) Desai, V. et al., 2007, ApJ, 660, 1151
- Dressler (1980) Dressler, A., 1980, ApJ, 236, 351
- Dressler et al. (1994) Dressler, A. et al., 1994, ApJ, 430, 107
- Dressler et al. (1997) Dressler, A. et al., 1997, ApJ, 490, 577
- Dressler et al. (1999) Dressler, A. et al., 1999, ApJS, 122, 51
- Efron & Tibishirani (1993) Efron, B. & Tibishirani, R. An Introduction to the Bootstrap New York: Chapman & Hall, 1993.
- Eggen, Lynden-Bell & Sandage (1962) Eggen, O. J., Lynden-Bell, D., Sandage, A. R., 1962, ApJ, 136, 748
- Fasano et al. (2000) Fasano, G. et al., 2000, ApJ, 542, 673
- Goto et al. (2003) Goto, T. et al., 2003, MNRAS, 346, 601
- Gunn & Gott (1972) Gunn, J. E. & Gott, J. R., 1972, ApJ, 176, 1
- Halliday et al. (2004) Halliday, C. et al., 2004, A&A, 427, 397
- Häussler et al. (2007) Häussler, B., et al., 2007, ApJS, 172, 615
- Hernquist (1992) Hernquist, L., 1992, ApJ, 400, 460
- Holden et al. (2007) Holden, B. P. et al., 2007, ApJ, 670, 190
- Koekemoer et al. (2002) Koekemoer A., Fruchter, A., Hook, R. & Hack, W., 2002 HST Calibration Workshop, p. 337
- Moore et al. (1996) Moore, B. et al., 1996, Nature, 379, 613
- Moore, Lake & Katz (1998) Moore, B., Lake, G., Katz, N., 1998, ApJ, 495, 139
- Moore et al. (1999) Moore, B. et al., 1999, MNRAS, 304, 465
- Moran et al. (2007) Moran, S. M., Miller, N., Treu, T., Ellis, R. S., Smith, G. P., 2007b, ApJ, 659, 1138
- Moss (2006) Moss, C., 2006, MNRAS, 373, 167
- Naab, Khochfar & Burkert (2006) Naab, T., Khochfar, S., Burkert, A., 2006, ApJ, 636, L81
- Peng et al. (2002) Peng et al., 2002, AJ, 124, 266
- Poggianti (1997) Poggianti, B. M., 1997, A&AS, 122, 399
- Poggianti et al. (2009) Poggianti, B. M. et al., 2009, ApJ, 697, L137
- Postman et al. (2005) Postman, M. et al., 2005, ApJ, 623, 721
- Roos & Aarseth (1982) Roos, N., Aarseth, S. J., 1982, A&A, 114, 41
- Scannapieco & Tissera (2003) Scannapieco, C. & Tissera, P. B., 2003, MNRAS, 338, 880
- Smail et al. (1997) Smail et al., 1997, ApJS, 110, 213
- Smith et al. (2005) Smith, G. P. et al., 2005, ApJ, 620, 78
- Toomre (1977) Toomre, A., 1977, The Evolution of Galaxies and Stellar Populations. Yale Univ. Press, p. 401
- Treu et al. (2003) Treu, T. et al., 2003, ApJ, 591, 53
- van Albada (1982) van Albada, T. S., 1982, MNRAS, 201, 939
- van Dokkum et al. (1999) van Dokkum, P. G. et al., 1999, ApJ, 520, L95
- van Dokkum et al. (2001) van Dokkum, P. G. et al., 2001, ApJ, 552, L101
- van Dokkum (2005) van Dokkum, P. G., 2005, AJ, 130, 2647
- White et al. (2005) White et al., 2005, A&A, 444, 365
- Williams et al. (1999) Williams, L. L. R. et al., 1999, ApJ, 527, 535