Discovery of Candidate H2O Disk Masers in AGN and Estimations of Centripetal Accelerations
Abstract
Based on spectroscopic signatures, about one-third of known H2O maser sources in active galactic nuclei (AGN) are believed to arise in highly inclined accretion disks around central engines. These “disk maser candidates” are of interest primarily because angular structure and rotation curves can be resolved with interferometers, enabling dynamical study. We identify five new disk maser candidates in studies with the Green Bank Telescope, bringing the total number published to 30. We discovered two (NGC 1320, NGC 17) in a survey of 40 inclined active galaxies ( km s-1). The remaining three disk maser candidates were identified in monitoring of known sources: NGC 449, NGC 2979, NGC 3735. We also confirm a previously marginal case in UGC 4203. For the disk maser candidates reported here, inferred rotation speeds are 130–500 km s-1. Monitoring of three more rapidly rotating candidate disks (CG 211, NGC 6264, VV 340A) has enabled measurement of likely orbital centripetal acceleration, and estimation of central masses (2–7 M⊙) and mean disk radii (0.2–0.4 pc). Accelerations may ultimately permit estimation of distances when combined with interferometer data. This is notable because the three AGN are relatively distant ( km s-1), and fractional error in a derived Hubble constant, due to peculiar motion of the galaxies, would be small. As signposts of highly inclined geometries at galactocentric radii of –1 pc, disk masers also provide robust orientation references that allow analysis of (mis)alignment between AGN and surrounding galactic stellar disks, even without extensive interferometric mapping. We find no preference among published disk maser candidates to lie in high-inclination galaxies. This provides independent support for conclusions that in late-type galaxies, central engine accretion disks and galactic plane orientations are not correlated.
1 INTRODUCTION
Extragalactic H2O maser emission from active galactic nuclei (AGN) in spiral galaxies in some cases traces highly inclined disk structures at radii –1 pc from the central engines. Cases established by direct interferometric imaging that resolves position-velocity structure include NGC 4258 (e.g., Miyoshi et al., 1995; Argon et al., 2007), NGC 1068 (Greenhill & Gwinn, 1997), NGC 3079 (Yamauchi et al. 2004; Kondratko, Greenhill, & Moran 2005), Circinus (Greenhill et al., 2003a), UGC 3789 (Reid et al., 2009), and NGC 6323 (Braatz et al., 2007). These “disk masers” have common spectroscopic characteristics, highly red- and blueshifted emission lines, called “high-velocity” emission lines, that more or less evenly bracket the systemic velocity, and emission close to the systemic velocity, called “low-velocity” emission lines. Both are defined in the frame of the rotating disk, projected along the line of sight. We use this terminology of “high-” and “low-” velocity lines throughout this paper. This template is also observed in other H2O masers for which imaging data are not available, and it can be a powerful diagnostic. In total, at least 30 published masers (out of 107 known) share these characteristics (e.g., Greenhill, Tilak, & Madejski, 2008, and references therein). The high-velocity red- and blueshifted emission has been observed to be offset on the order of – km s-1, among sources. We note that very long baseline interferometric (VLBI) imaging is essential to confirm the identity of disk masers. Hence, we have used the terminology “disk maser candidates” for sources with spectroscopic identification only. We also note that VLBI imaging of some disk masers shows signs of additional maser emission arising in outflows (e.g., Circinus) and jets (e.g., NGC 1068).
H2O disk masers highlight structures oriented edge-on, or nearly so, and in close proximity to central engines. This is plausible because large reservoirs of molecular gas along lines of sight are required to generate detectable emission (Elitzur, 1982). Among all H2O masers in AGN, exhibit X-ray absorption column densities cm-2 (Greenhill et al. 2008). Among disk masers, the fraction is nearly as high, and the distribution of obscuring column densities peaks above cm-2. For thin disks, maser emission is beamed narrowly about the midplane, into a solid angle , as dictated by requisite velocity coherence along lines of sight (e.g., Miyoshi et al., 1995). Geometry limits observable emission to disks that are highly inclined. Although common association has been well recognized with optical type-2 and partly obscured type-1 objects (e.g., Braatz, Wilson, & Henkel, 1997b), disk maser emission is a sharper indicator of (inclination) orientation for nuclear structure than optical classifications are. In addition, it is a more direct indicator than, e.g., models of Fe K emission from hot accretion disks (Nandra et al., 1997), the differential brightness of radio jets, and models of kiloparsec-scale ionization structures. Comparisons of inclination complement analyses of position angles and naturally enable analyses of relative 3-D orientation (Clarke, Kinney, & Pringle, 1998; Pringle et al., 1999; Nagar & Wilson, 1999).
We conducted a survey of AGN to detect new disk masers, selecting galaxies with inclined stellar disks (inclination angle ). We detected two disk maser candidates and one unclassified maser (Section 3.1). We also conducted deep integrations to identify indicators of disk maser emission among previously known sources, detecting another three (Section 3.2), and monitored another three known disk maser candidates to measure centripetal acceleration due to disk rotation (Section 3.3). We discuss estimation of black hole masses and disk radii in Section 4 as well as the distribution of inclinations among disk maser candidate hosts and misalignment between central engines and galactic stellar disks.
2 OBSERVATIONS
The survey was conducted during 2004–2005 with the Green Bank Telescope (GBT) of the NRAO,111The National Radio Astronomy Observatory is operated by Associated Universities Inc., under cooperative agreement with the National Science Foundation. using two 200-MHz IFs configured to overlap by 50 MHz, in each polarization. We tuned the center of the resulting 350-MHz instantaneous bandwidth to the systemic velocity of each target source (350 MHz km s-1 for a representative recessional velocity of 5000 km s-1, assuming the optical definition of Doppler shift). The spectrometer delivered a channel spacing of 24.4 kHz. The dedicated observation of known H2O maser sources was conducted between 2003 and 2006 with the same setup, except for galaxy CG 211 (2003 December 08), where the two IFs were configured to overlap by 20 MHz and the IF at the lower velocity was centered on the systemic velocity of the galaxy.
To obtain total-power spectra, we nodded the telescope by every 2 minutes between two positions on the sky so that each target was always present in the on-axis or off-axis beam. System temperatures () were measured against a calibrated noise source injected at the receiver and ranged from to K depending on elevation and weather conditions. To calibrate the spectra to flux density units, we used the gain curve obtained by the GBT staff based on measurements of opacity-corrected antenna temperature for NGC 7027 at cm (R. Maddalena, private communication). By comparing maser line amplitudes among beams and polarizations, we estimate that the calibration of the is accurate to within , an uncertainty that dominates the error budget for the flux density scale (and is probably due to calibration uncertainties for the noise sources). In comparison, antenna pointing corrections were obtained every minutes and were typically , which corresponds to a loss less than 8% in source flux density for a beamwidth (FWHM) at 1.3 cm. Additional losses due to pointing errors induced by varying wind conditions were less than 20%, which we estimate using the error model of Condon (2003) and the bottom 90% of measured wind speeds at GBT weather station 2, for each observation. (Our estimated losses are conservative, considering that wind speeds on the feed arm itself were typically lower.)
Data were reduced using custom scripts written in the Interactive Data Language. We subtracted a running boxcar average of width MHz to remove systematic baseline structure from the total-power spectra, excluding velocity intervals with signal that was detectable above the structure seen in raw integrations. The resulting noise levels attained in an integration of minutes and corrected for atmospheric opacity estimated from tipping scans (from 0.03 to 0.2) were 4–14 mJy in a 24.4-kHz channel. The spectra presented here have been Hanning smoothed (multiple times) to a resolution of 108 kHz, though channel spacing of 24.4 kHz is shown in the figures.
3 RESULTS
3.1 Survey—Three New Masers
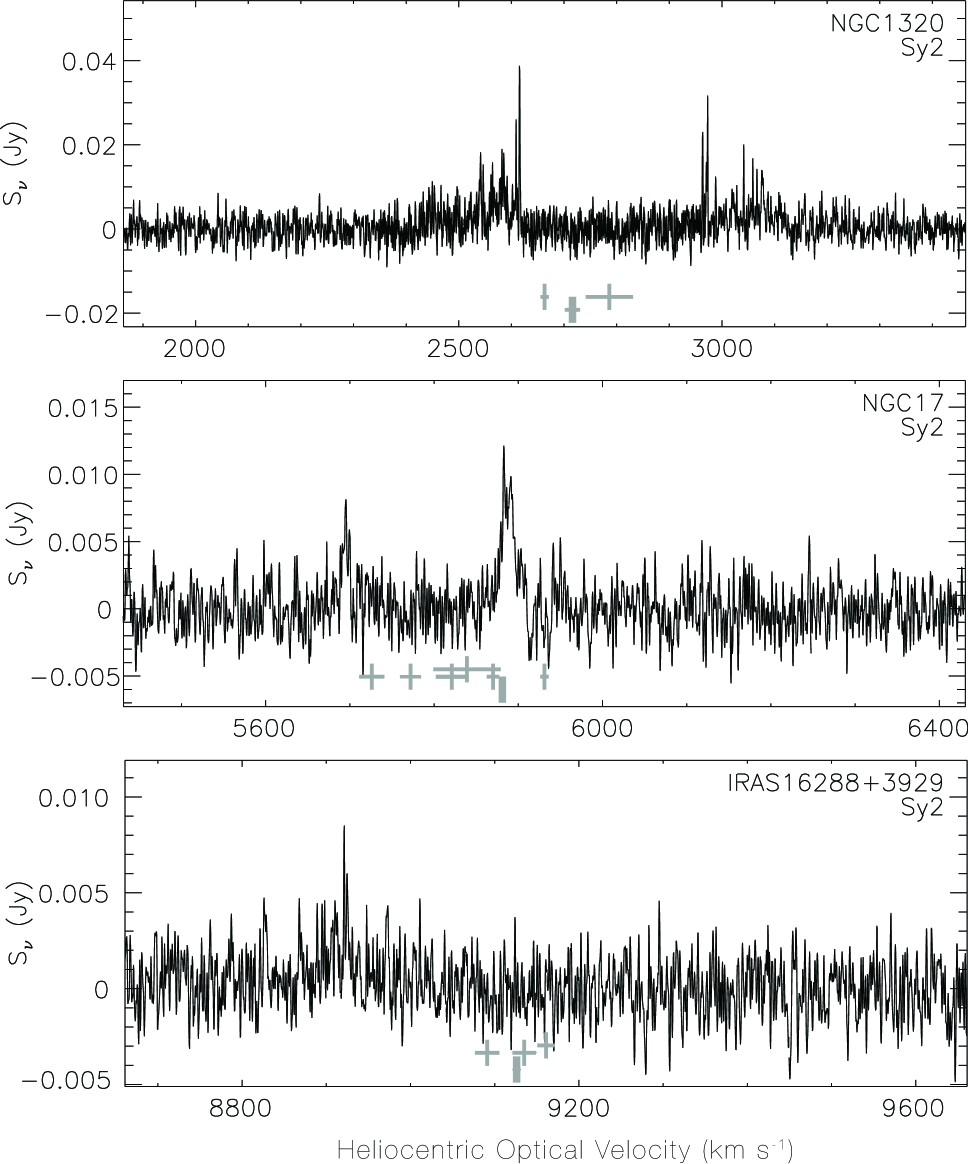
In a survey of 40 inclined () AGN with km s-1 selected from the NED (Table 1), we have detected three new H2O maser sources in Seyfert 2 systems: NGC 1320, NGC 17222Duplicate designation, NGC 34, originates from a suspected observer error recorded in Dreyer (1881) and corrected by Howe (1900). Dual designation does not stem from NGC 17 being a merger with a complicated brightness distribution. However, see discussion of NGC 17/34 in Hopkins et al. (2008)., and IRAS 16288+3929 (Figure 1). The three discoveries were subsequently confirmed with the Very Large Array (VLA) of the NRAO using a 6.25-MHz observing bandwidth and 97.7-kHz channels (NGC 1320, IRAS 16288+3929) or with the GBT on a different day but using the same spectrometer configuration (NGC 17, IRAS 16288+3929). Each of the masers is probably associated with nuclear activity. The NGC 1320 and IRAS 16288+3929 maser positions measured with the VLA lie from the optical positions of the nuclei (Table 1), or less than 300 pc. The NGC 17 maser is three to four times more distant than the farthest H2O maser known to be associated with star formation (Arp 244; Darling, Brogan, & Johnson, 2008), yet it is comparably bright.
Spectroscopic classification of sources as disk maser candidates is most suggestive when three line complexes are detected, one close to the systemic velocity and two bracketing it, with similar but opposite velocity offsets. Approximate symmetry in this respect is indicative of a disk, and a minimum offset on the order of 200 km s-1 is reasonable to exclude misidentification of emission driven by nonnuclear star formation (Greenhill, 2007). However, detailed geometry of the underlying accretion disks, orientation with respect to the line of sight, and sensitivity limitations may result in fewer than three detectable line complexes. In these cases, interpretation of the spectra depends critically on estimates of systemic velocity.
The spectrum of NGC 1320 is relatively symmetric about a mean of km s-1 (Figure 1), with emission extending outward km s-1 from peaks at 2614 and 2969 km s-1. However, the mean velocity is offset km s-1 from the most precise optical systemic velocity (Huchra et al., 1993), though agreement appears to be good with the estimate of Bottinelli et al. (1992). The approximate mirror symmetry and breadth of the line complexes is suggestive of 150–180 km s-1 rotation velocity, though it would be twice as great if one of the detected line complexes were to correspond to systemic emission. Time monitoring might distinguish between scenarios if a third, blueshifted, variable line complex is detected or if secular drift in velocity is detected in one of the known complexes.
Classification of NGC 17 is somewhat less certain because of a spread in systemic velocity estimates that spans the separation of the two detected line complexes km s-1 (Figure 1). However, we note that the most precise estimate (Rothberg & Joseph, 2006), obtained from dynamical modeling of the galaxy, corresponds well to the peak of the stronger of the two line complexes. We infer from this circumstance that NGC 17 is likely to be a disk maser, with rotation velocity km s-1. As for NGC 1320, monitoring may increase certainty should a blueshifted line complex or secular drift be detected. Nonetheless, because NGC 17 is a merger (e.g., Vorontsov-Vel’Yaminov, 1977; Mazzarella & Boroson, 1993; Hunt et al., 1999; Schweizer & Seitzer, 2007), interpretation of the spectrum requires some caution. The velocity offset between the two spectral features is comparable to the stellar velocity dispersion, km s-1 (Rothberg & Joseph, 2006), and the maser lines may arise in different compact structures within the system.
For IRAS 16288+3929, classification is problematic because only a single spectral feature is evident ( km s-1), and it is displaced km s-1 from available optical systemic velocities (Figure 1). The emission may represent high-velocity blueshifted emission or activity unrelated to any accretion disk. An alternative origin could be jet activity driven by the central engine. We note comparable velocity offsets for known “jet masers” (NGC 1068, NGC 1052, Mrk 348, and M 51; Gallimore et al., 1996, 2001; Claussen et al., 1998; Kameno et al., 2005; Peck et al., 2003; Hagiwara, 2007). On the other hand, in these cases, spectral features are characteristically at least 50 km s-1 wide, at least an order of magnitude broader than the linewidth for the known maser feature in IRAS 16288+3929.
NGC 1320 and NGC 17 were targeted but not detected in previous surveys for maser emission. Braatz, Wilson, & Henkel (1996) and Kondratko et al. (2006a) report observation of NGC 17 with noise levels of 73 and 16 mJy in 0.66 and 1.3 km s-1 spectral channels, respectively. These correspond to signal-to-noise ratios (SNR) of for the observed line flux of mJy (peak) over 1.5 km s-1. In the case of NGC 1320, these earlier studies obtained noise levels of and mJy in and km s-1 spectral channels, respectively. The SNR for the observed line flux of mJy, at km s-1 resolution, would have been less than two.
3.2 Three New Disk Maser Candidates (NGC 449, NGC 2979, and NGC 3735) among Known Sources
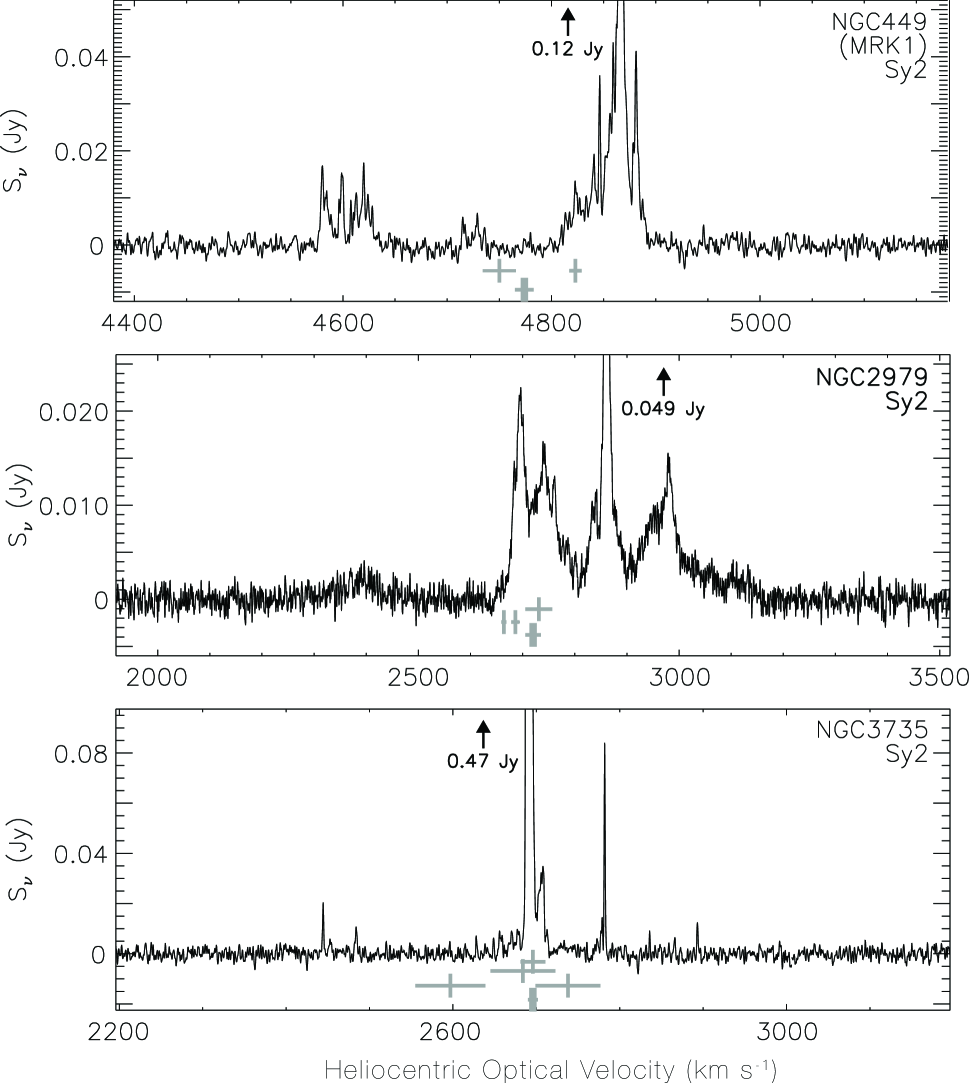
Through deep integration, we detected new features in the spectra of masers not previously recognized to have high-velocity emission and evidence for origins in accretion disks (Figures 2, 3, 4; Table 2). Noise levels were 2–4 mJy () referenced to outside the atmosphere. We comment on individual systems below. The first three we discuss are the new disk maser candidates.
NGC 449 (Mrk 1) (Figure 2). We detected an emission complex at km s-1, a mJy component at km s-1, and a new weak line complex (7 mJy peak in a km s-1 spectral channel) at km s-1. The complex at km s-1 has been present in the spectrum of the source since its discovery (Braatz et al., 1996; Braatz et al., 2003) while the component at km s-1 was marginally detected first by Braatz et al. (2003). The newly detected emission is approximately halfway in velocity between the two previously known spectral complexes. Although the position of the maser emission with respect to the nucleus has not been measured, the spectrum shows the archetypical spectral signature of emission from a highly inclined accretion disk. In particular, considering the uncertainty on the systemic velocity of the galaxy (Figure 2; Table 2), we associate the complex near 4720 km s-1 with low-velocity disk emission and infer an orbital velocity (which we take to be the maximum velocity with respect to the systemic velocity) of km s-1. It is notable that the suggested systemic velocity of the galaxy would be blueshifted by a few times 10 km s-1 from optical measures and km s-1 from the estimate obtained from HI data.
NGC 2979 (Figure 2). Emission was newly detected at a level of mJy at 2390 km s-1 (cf. Greenhill et al., 2003b), which is blueshifted by km s-1 from estimates of the systemic velocity. The new spectrum is approximately centered on the optical systemic velocity estimate of km s-1 (Fisher et al., 1995), which is suggestive of emission from a highly inclined disk with km s-1 orbital velocity, though extended line wings may suggest a somewhat more rapid rotation. This interpretation is consistent with the known coincidence of the maser source position and the active nucleus (Greenhill et al., 2003b). Asymmetry in the maser spectrum is pronounced but difficult to explain without imaging data that would enable geometric modeling of the disk. However, we note that the archetypal disk maser in NGC 4258 exhibits about a 10 times imbalance in the flux densities of red- and blueshifted emission. In the new spectrum, the velocity range of emission mJy is consistent with a weak plateau observed in the 6 times lower sensitivity discovery spectrum (Greenhill et al., 2003b).
NGC 3735 (Figure 2). We detected narrow lines at 2444, 2484, 2784, and 2896 km s-1 that were not observed in previous spectra (Greenhill et al., 1997b; Braatz et al., 2003). An additional complex of weak lines may be present between 2830 and 2870 km s-1. Doppler shifts from systemic velocities derived from HI data are 200–250 km s-1 (Staveley-Smith & Davies, 1988). This bracketing of systemic emission and known angular coincidence of the maser and nucleus (Greenhill et al., 1997b) are suggestive of emission from a close-to edge-on accretion disk.
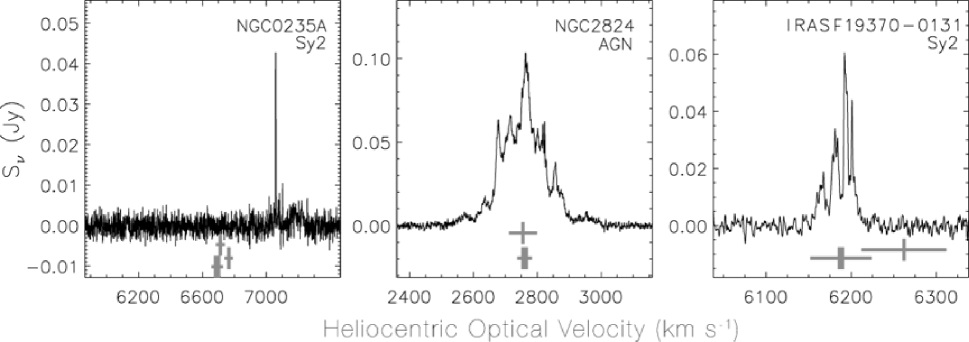
UGC 4203 (Mrk 1210) (Figure 3). We detected line complexes bracketing the systemic velocity, at 3755–3861 km s-1 and 4190–4350 km s-1 (Figure 3), as well as isolated narrow lines distributed between these, at 4106 km s-1 ( mJy), 4134 km s-1and 3992 km s-1 (5–10 mJy). The peaks of the red- and blueshifted complexes were detected with lower signal-to-noise ratio previously (Braatz et al., 1996; Braatz et al., 2003), though the symmetry of the spectrum around the systemic velocity (Table 2) and suggestion of emission from an inclined disk were less pronounced. The inferred orbital velocity is km s-1, depending on the adopted systemic velocity.
Arp 299 (NGC 3690) (Figure 3). The spectrum contains a broad feature with FWHM km s-1 and overlying narrow Doppler components that were not evident in the previous spectra of the source obtained with km s-1 channels (Henkel et al., 2005). Maser emission is known to arise from three regions in this merging system, the nuclei of NGC 3690 and IC 694 and an internuclear radio continuum “hotspot” (Tarchi et al., 2007). Both nuclear maser sources are km s-1 wide, which is notable because large widths have been associated at least circumstantially with jet activity (see Tarchi et al., 2007), as exemplified in three AGN where maser and radio continuum emission have been mapped relative to one another interferometrically: NGC 1052, NGC 1068, Mrk 348 (Claussen et al., 1998; Gallimore et al., 2001; Peck et al., 2003; Kameno et al., 2005, also review by Greenhill 2007). Notable time variability has been observed toward these masers, and position-resolved monitoring of Arp 299 may offer useful diagnostics.
NGC 4293 (Figure 3). The spectrum exhibits emission distributed over km s-1 but that unevenly brackets the most precise estimate of systemic velocity (di Nella et al., 1995). An additional emission feature at km s-1 may be present at the level. The case for origin in a disk is marginal due to uncertainty in the full velocity range of emission and the degree of symmetry.
NGC 0235A (Figure 4). Dominated by a single spectral feature redshifted by km s-1 from the systemic velocity, interpretation of the spectrum is difficult. Goals of further monitoring should include a search for blueshifted emission.
NGC 2824 (Figure 4). As observed in the case of Arp 299, the NGC 2824 maser exhibits narrow Doppler components overlying a broad component (FWHM km s-1). This is consistent with the discovery spectrum (Greenhill et al., 2003b), though the newly recognized zero-intensity width is substantially broadened, km s-1. The maser emission is associated in position with the AGN (Greenhill et al., 2003b), and the spectrum is suggestive of jet activity, but the interpretation is uncertain.
3.3 New Centripetal Accelerations for Three Disks
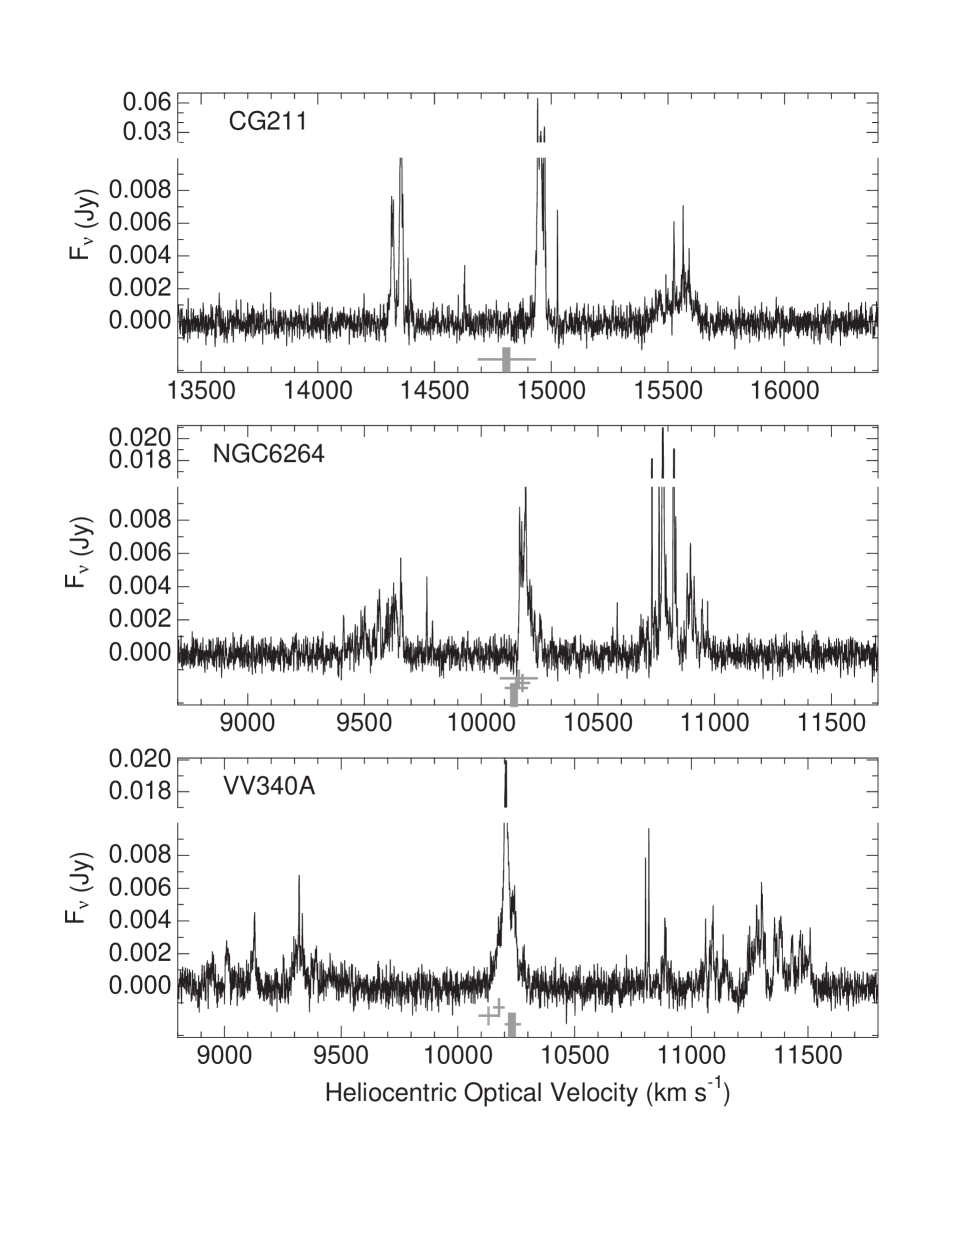
Deep integrations were also used in monitoring three masers reported by Kondratko, Greenhill, & Moran (2006b), which display among the largest Doppler shifts for high-velocity emission: CG 211, NGC 6264, and VV 340A (Table 3; Figure 5). We detected secular drifts in low-velocity features, which probably reflect centripetal acceleration due to disk rotation (Table 4, Figs. 6 and 7). For each source, we used an iterative least-squares technique, adopted from Humphreys et al. (2008), to decompose the time-series spectra into Gaussian components, solving simultaneously for the light curve, time-varying line width, velocity at a reference epoch, and velocity drift of each component. (Each component was assumed to have its own fixed drift rate.) We constrained the widths of most Gaussian components to be km s-1, motivated by empirical observation. A first-order polynomial and a wide ( km s-1) stationary Gaussian component were used to model the broad low-velocity plateaus in VV 340A and CG 211, respectively. The fitted accelerations were not sensitive to inclusion of the broad components, though reduced estimates were improved. We obtained drifts of 0.1–1.9 km s-1 yr-1 with uncertainties of 0.005–0.09 km s-1 yr-1, 1.2–2.1 km s-1 yr-1 with uncertainties of 0.1–0.6 km s-1 yr-1, and km s-1 yr-1 for CG 211, NGC 6264, and VV 340A, respectively (Table 4).
4 DISCUSSION
4.1 Black Hole Masses, Disk Radii, and Their Implications
Mean measured centripetal acceleration, , combined with mean orbital velocity inferred from single-dish spectra, , can be used to estimate central-engine gravitational masses and accretion disk radii. The mean acceleration among low-velocity features may be expressed as , where is an effective mean rotational velocity and is the effective mean radius, both for material contributing low-velocity emission. The mean rotational velocity inferred from spectra may be expressed as , where is the gravitational constant, is black hole mass, and is the effect mean radius for material contributing high-velocity emission. For edge-on orientation, we obtain . Unfortunately, without VLBI, we cannot determine and independently or, therefore, and independently. Hence, for the purpose of calculation, we assume that the low- and high-velocity emission arise at the same effective mean radii () and that the effective mean rotation velocity of accelerating low-velocity material is the same as the measured mean rotational velocity, . We then obtain and . These values are reported in Table 5. VV 340A may have the largest central mass among known maser galaxies.
We note that the scatter in the velocity drift measurements for CG 211 is substantially larger than the individual formal uncertainties. Since for low-velocity material and hence , the scatter in the measured accelerations of might be due to low-velocity emission that populates a wide range of radii within the accretion disk, i.e., . In our simple model, the radial spread among high-velocity material might be expected to be . The observed value of in the high-velocity components is about 0.3 (see Figure 5). This suggests that the radial spread is about the same for both high- and low-velocity masers. For NGC 6264, , so , and for the high-velocity masers is expected to be about 0.1. However, inspection of the spectrum (Figure 5) suggests that . Hence, the high-velocity masers probably occupy a larger range of radii than the low-velocity masers. Note that the case of NGC 6264 may be similar to that of NGC 4258, where the radial range of the high-velocity features is also greater than that of the low-velocity features (Herrnstein et al., 2005)
In each case where we report centripetal acceleration, it has been positive, i.e., spectral components drift towards larger velocities. This is consistent with the emission being from material on the near side of the disks. Material behind a dynamical center, which would exhibit negative centripetal accelerations, has not been detected toward any known disk maser or disk maser candidate. Although the relatively low signal-to-noise achieved for CG 211, NGC 6264, and VV 340A would make recognition of “back-side” emission relatively difficult, we can exclude the possibility that flux densities are equivalent to the front-side emission. It is difficult to know whether the apparent absence of back-side emission may be due to a maser radiation propagation effect (e.g., competitive gain diminishes inward-directed beams) or differential absorption (e.g., inward-directed beams pass through regions of enhanced scattering or absorption in the vicinity of a central engine; inward-directed beams cross the full breadth of a disk and are attenuated by high emission-measure material at large disk scale heights, as in Herrnstein, Greenhill, & Moran 1996).
The three masers in Table 5 are priority targets for interferometric programs that are intended to estimate geometric distances (e.g., Herrnstein et al. 1999) and (in combination with distances for other maser targets) a combined Hubble constant, H0. For a sample of anchor galaxies, uncertainty in H0 scales as (for uniform uncertainties) because errors for individual distance measurements are largely uncorrelated; they depend principally on the distribution of Doppler components across the disk face and details of disk geometries, which differ from galaxy to galaxy.
To provide substantive independent constraint on additional cosmological parameters, such as a time-variable equation of state (EOS) for dark energy and curvature, estimates of H0 need to achieve on the order of 1% uncertainty, matching the growing accuracy of other measurements, e.g., Cosmic Microwave Background (CMB) fluctuations and Baryon Acoustic Oscillations (Hu, 2005; Ichikawa & Takahashi, 2008; Olling, 2007; Greenhill et al., 2009, and references therein). In combination with CMB data alone, a 1% estimate of H0 would enable a 5% constraint on a presumed-constant EOS, for a flat universe (Figure 14, Riess et al., 2009). A sample on the order of 100 disk masers would be required to achieve 1% accuracy in H0, if each distance is accurate to 10%. At present, this is at least an order of magnitude beyond the number of disk masers apparently suitable for distance measurement. However, a three-year survey of 3000 galaxies at the GBT, achieving RMS noise mJy over 1 km s-1 (4 sources per hour for ), would result in the detection of 150 masers, assuming a conservative detection rate of one-half that reported by Kondratko et al. (2006b) for AGN at 10000–15000 km s-1. For a disk maser fraction of one-third, and a further one-quarter that appear suitable for distance measurement (as suggested in the currently known population), it would be possible to assemble a sample on the order of 25 objects. For 10% distance uncertainty per maser, this would enable estimation of H0 with 2% accuracy in the near term. Prospects are improved by better individual distances as may be achievable with the VSOP-2 space-VLBI mission and larger target samples made accessible by the Square Kilometer Array (Greenhill, 2004; Morganti et al., 2004).
However, peculiar radial motions of galaxies increase scatter in the Hubble relation and introduce partial correlation among recessional velocities. The estimate of the Hubble constant from any particular galaxy measurement is . The sample size needed to achieve a given total uncertainty grows as the quadrature sum of and fractional peculiar motion, , so that the uncertainty in a sample of galaxies is . If , and we require that the uncertainty in peculiar motion raises the error by less than 10%, then . Outside of clusters, km s-1 is typical (Springob et al., 2007). We take this to be an RMS value and infer that km s-1 is needed. For maser hosts inside rich clusters, barycenter velocities can be estimated with uncertainty km s-1 (e.g., Crook et al., 2007) and used in place of individual galaxy recessional velocities, though cluster peculiar motions would still deserve attention.
It would be desirable to target relatively nearby galaxies that are in “quiet” portions of the Hubble flow, to reduce statistical and nonstatistical errors (e.g., UGC 3789; Masters, 2005; Reid et al., 2009). However, a broad distribution of sample members in velocity and angle on the sky is needed. Subtraction of cosmic flow models to at least partially correct for reduces the lower limit on acceptable and admits galaxies in not so quiet regions. Using Tully-Fisher distances to estimate peculiar velocities and construct a multi-attractor model inside 6000 km s-1, Masters (2005) obtained a km s-1 RMS residual. Erdoğdu et al. (2006) report a somewhat less direct error estimate, a scatter of 100–150 km s-1 around a flow model derived from galaxy recessional velocities (as opposed to peculiar velocities), up to km s-1. Adopting a characteristic 160 km s-1 uncertainty, the lower limit in is 3200 km s-1, for maser distances good to 10% and the nominal limit of contribution by peculiar motions to the error budget. The technique works for maser hosts away from the Great Attractor and the galactic plane (; Masters 2005), where flow models are not well constrained.
4.2 Accretion Disk and Host Galaxy Misalignments
In studies of the relative orientation of AGN central engines and host galaxies, radio jet position angles at parsec and kiloparsec scales are used to infer the orientations of the accretion disks that launch them. Ionization cone position angles are used to infer the orientations of larger scale, dusty, geometrically thick structures at larger radii. Comparisons of position angles suggest that accretion disks are not aligned with galactic spiral disks (Ulvestad & Wilson, 1984; Nagar & Wilson, 1999; Kinney et al., 2000; Schmitt et al., 2003; Middelberg et al., 2004). At the same time, the accretion disks appear reasonably well aligned with the structures that collimate ionization cones (Schmitt et al., 2003), though the sample is small.
Because interferometric mapping has demonstrated that disk maser emission marks molecular structures that are oriented close to edge-on, the emission provides a relatively precise indicator of orientation, via inclination rather than position angle, as is otherwise the case principally for radio jets and ionization cones. Thus, estimation of stellar disk inclination in spiral galaxies that host disk masers enables immediate estimation of (mis)alignment between parsec-scale and kiloparsec-scale structures. The approach complements other techniques, in terms of orientation angle (position angle vs inclination) and of radius, where the range of radii for maser emission lies outside the zone where accretion disks act to collimate radio jets. Perhaps the fullest case studies would be possible for galaxies with observable radio jets, disk maser emission, well-resolved ionization cones, accurate B-band isophotal radii (for detection of spiral arms), and a reasonably firm morphological type. Among nearby galaxies, inclinations could be obtained from detailed modeling of spectroscopic data for well-resolved stellar disks and circumnuclear molecular rings (e.g., Curran, 2000).
A suitable sample for study may be compiled directly from lists of known disk maser candidate hosts that are spirals. The spectroscopic identification of masers that trace underlying disk structure is sufficient. Galactic inclinations, to first order, may be inferred directly from axial ratios, , though detailed dynamical modeling would be preferred to obtain the most accurate values.
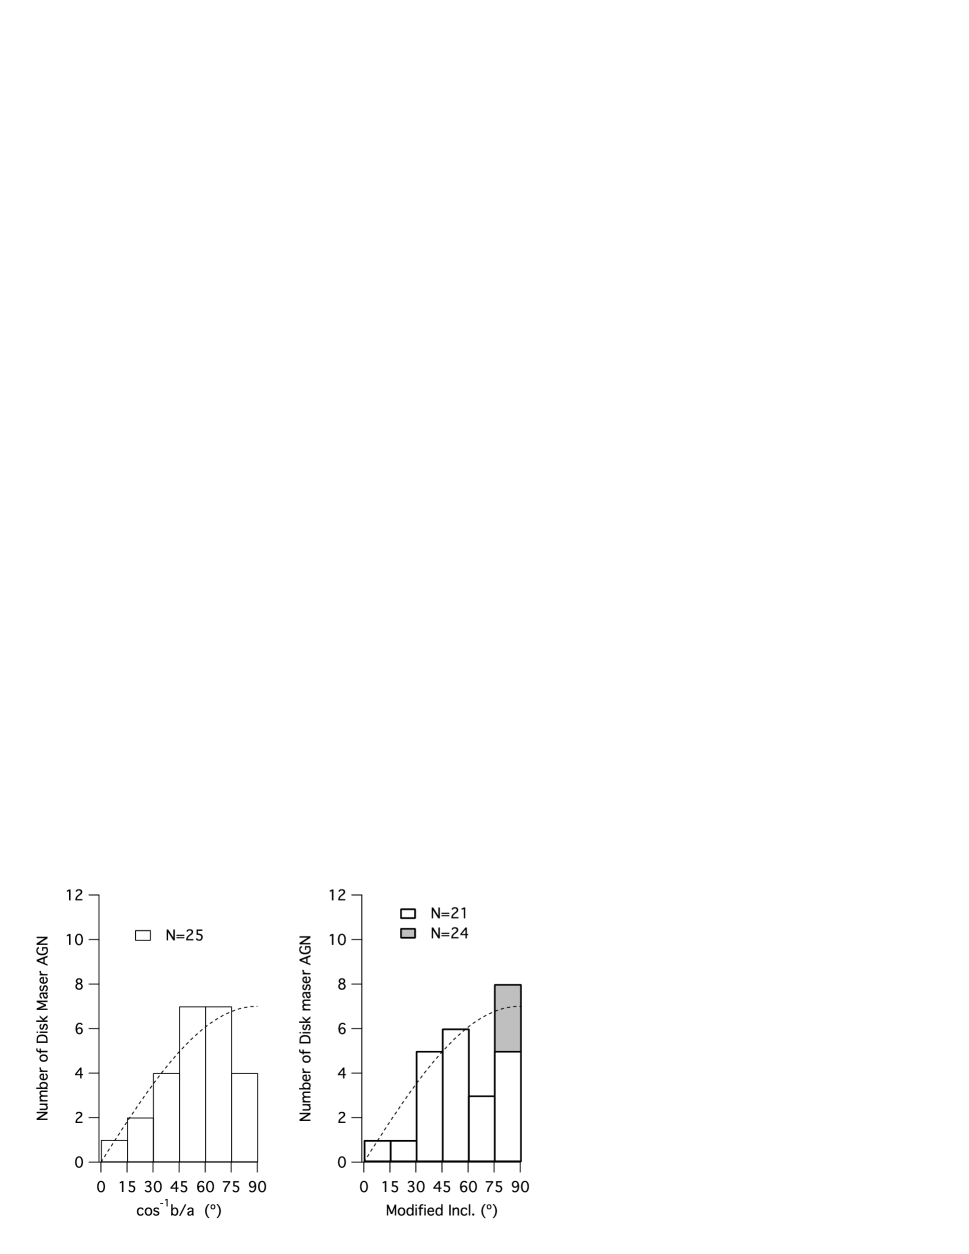
Assuming the spectroscopic identifications are accurate, then there is no apparent preponderance of edge-on galactic disks among disk maser candidate hosts. For inclinations 70–80∘, the distribution of orientations for the disk maser candidate matches what would be anticipated for random galaxy orientations (Figure 8). To make the comparison, we assembled a sample of axial ratios for published disk maser candidates, defined with respect to surface brightness of per sec-2, for S0 and later systems (Table 6). Axial ratios were taken from the Third Reference Catalogue of Bright Galaxies (de Vaucouleurs et al., 1991).
The apparent undercount among high-inclination systems in Figure 8 is probably due to overestimation of disk minor axes due to galactic bulges, which is anticipated to be greatest for nearly edge-on massive systems (i.e., morphologies from S0 to Sa). Fouque et al. (1990) describe an empirical correction that is dependent on galaxy morphology, quantified in the parameter (e.g., de Vaucouleurs et al., 1991). Determination of morphologies is strongly dependent on image quality and may be affected by subjective bias (e.g., see methodology discussion of Fukugita et al., 2007). Corrected inclinations are particularly sensitive to uncertainty in for highly inclined systems, where forbidden values of may result. We estimate corrected inclinations using catalogued morphological types (de Vaucouleurs et al., 1991; Malkan, Gorjian, & Tam, 1998; Lauberts & Valentjin, 1989). For galaxies with forbidden values of (NGC 1386, NGC 4388, NGC 3735), we increment by 0.6, which is approximately the catalogued uncertainty for these systems. We obtain inclinations that are within a few degrees of . (In light of the chosen coarse binning, the precise values are not critical.) As a result, agreement with what is expected for random galactic disk orientations is obtained over the whole range (Figure 8). For an intensively studied sample that includes well-characterized inclination uncertainties for each object, formal statistical comparison would be possible using a Monte Carlo analysis.
No correlation of misalignment with morphological type or mass is apparent. Disk maser candidate hosts span a range of almost two orders of magnitude in black hole mass and a broad range of apparent morphological type, from S0 () to Sc (), excluding the merger system NGC 17. The median type is 2.7, with for the middle quartiles (Table 6). Masses are inferred from VLBI or acceleration measurements: NGC 4258 (e.g., Miyoshi et al., 1995; Herrnstein et al., 2005), NGC 1068 (Greenhill & Gwinn, 1997), Circinus (Greenhill et al. 2003a), NGC 3079 (Yamauchi et al., 2004; Kondratko et al., 2005), UGC 3789 (Reid et al., 2009), NGC 6323 (Braatz et al., 2007), IC 2560 (Ishihara et al., 2001), Mrk 1419 (Henkel et al., 2002), and CG 211, NGC 6264, and VV 340A (this work).
Comparison of galactic plane misalignments inferred for disk masers and for accretion disks at smaller radii thus far is statistical. Direct comparison would require disk masers that have been mapped with VLBI, but that sample is comparatively small. In several examples, the position angles for jets (or lobes) and ionization cones are well aligned with disk maser rotation axes, projected on the sky: NGC 3393 (Kondratko, Greenhill, & Moran 2008), NGC 4258 (Cecil et al., 2000), and NGC 4945 (Greenhill, Moran, & Herrnstein, 1997c). However, misalignment between a jet and disk maser has also been observed in the case of NGC 3079 (Kondratko et al., 2005), and skewing of ionization cone orientation by shadowing from a warped disk has been observed in Circinus (Greenhill et al., 2003a), both at radii pc. Misalignment on the order of is also observed in NGC 1068, between the position angle of the disk maser and the major axis of ionized material just inside the inner radius for molecular emission (Gallimore et al., 2004). If these examples are representative, counterparts may contribute to scatter in the alignment of jets and ionization cones noted by Schmitt et al. (2003) but ascribed to signal-to-noise and projection effects. Warping as observed among disk masers and larger nuclear structures (e.g., Schinnerer et al., 2000) may also be responsible, where fueling of central engines does not depend on conveyance of material along galactic planes to ever smaller radii and vertical heights until it is concentrated into a coplanar accretion disk.
5 CONCLUSIONS
In a survey with the GBT of 40 inclined AGN, we have detected three new water maser sources (NGC 1320, NGC 17, and IRAS 16288-3929; Figure 1). We classify two of these (NGC 1320 and NGC 17) as disk maser candidates based on their spectra. Three more cases of disk maser candidates were discovered through deep integrations toward known masers (NGC 449, NGC 2979, and NGC 3735; Figure 2). One previously marginal case was confirmed (UGC 4203; Figure 3). Inferred rotation speeds are –300 km s-1. At present, the details of interpretation are sensitive to estimates of systemic velocity at optical wavelengths and 21 cm (the HI line). These show significant scatter for some galaxies, and in general, comprehensive study is mandatory for each new maser detection to resolve uncertainties in classification. Interferometric follow-up of discoveries reported here will enable confirmation studies of disk geometry (e.g., radii, warping) and estimation of central engine mass, at least for the sources with large numbers of maser Doppler components. In general, systematic velocities that result from disk models may provide the best estimates of systemic velocity, and these might usefully be compared to the results of pointed optical and molecular line studies that include dynamical modeling.
For three additional maser sources exhibiting high-velocity maser emission (CG 211, NGC 6264, VV 340A), we report secular drift in multiple low-velocity features—a probable manifestation of centripetal acceleration due to disk rotation. Combined with rotation velocities inferred from spectra, these centripetal accelerations suggest central engine masses of a few times M⊙ and mean disk radii of a few times pc. Measurable accelerations of 1–3 km s-1 yr-1 and large recessional velocities ( km s-1) make these three sources particularly attractive for interferometric study in pursuit of robust estimates of geometric distances and H0.
As beacons of highly inclined structures in AGN, at radii of –1 pc, disk masers also highlight those galactic nuclei in which we can define a reference plane with high accuracy and study (mis)alignment with surrounding kiloparsec-scale stellar disks. We find no preponderance of edge-on galactic disks among published disk maser candidate hosts. The comparison is in agreement with studies that infer orientations of accretion disks and geometrically thick tori from radio jets and ionization cones, though the maser data refer to a unique range of radii and probe inclination rather than position angle on the sky.
Our studies provide more candidates for the quest to measure H0 with disk masers. The best available estimate of H0 is uncertain by 5% and achieved with a composite analysis of Cepheid and supernova data, with a zero point provided by the disk maser distance to NGC 4258 (Riess et al., 2009). Ultimately, accuracy on the order of 1% would match accuracies anticipated for CMB and other data sets in the near future and add a new independent constraint in cosmological parameter estimation. However, achieving this accuracy for H0 will be challenging, probably requiring detailed study of a disk maser sample at least three times larger than what is available today, assuming maser distances with 10% accuracy as the norm. The minimum sample recessional velocity would be km s-1, though objects as nearby as 3200 km s-1 may be useful where peculiar motions are known with uncertainties as small as 160 km s-1. Difficulty in accurately estimating peculiar motions in some volumes may restrict this extended sample, e.g., near the Great Attractor or where uncertainty in Tully-Fisher or Fundamental Plane distances are large.
References
- Abazajian et al. (2005) Abazajian, K., et al. 2005, AJ, 129, 1755
- Adelman-McCarthy et al. (2007) Adelman-McCarthy, J. K., et al. 2007, ApJS, 172, 634
- Argon et al. (2007) Argon, A. L., Greenhill, L. J., Reid, M. J., Moran, J. M., & Humphreys, E. M. L. 2007, ApJ, 659, 1040
- Beers et al. (1995) Beers, T. C., Kriessler, J. R., Bird, C. M., & Huchra, J. P. 1995, AJ, 109, 874
- Bottinelli et al. (1992) Bottinelli, L., Durand, N., Fouque, P., Garnier, R., Gouguenheim, L., Paturel, G., & Teerikorpi, P. 1992, A&AS, 93, 173
- Bottinelli et al. (1990) Bottinelli, L., Gouguenheim, L., Fouque, P., & Paturel, G. 1990, A&AS, 82, 391
- Braatz et al. (1997a) Braatz, J., Greenhill, L., Moran, J., Wilson, A., & Hernnstein, J. 1997a, BAAS, 29, 1374
- Braatz et al. (2007) Braatz, J., Greenhill, L., Reid, M., Condon, J., Henkel, C., & Lo, K.-Y. 2007, IAU Symposium, 242, 399
- Braatz & Gugliucci (2008) Braatz, J. A., & Gugliucci 2008, ApJ, 678, 96
- Braatz et al. (2004) Braatz, J. A., Henkel, C., Greenhill, L. J., Moran, J. M., & Wilson, A. S. 2004, ApJ, 617, L29
- Braatz et al. (1996) Braatz, J. A., Wilson, A. S., & Henkel, C. 1996, ApJS, 106, 51
- Braatz, Wilson, & Henkel (1997b) —. 1997b, ApJS, 110, 321
- Braatz et al. (2003) Braatz, J. A., Wilson, A. S., Henkel, C., Gough, R., & Sinclair, M. 2003, ApJS, 146, 249
- Cecil et al. (2000) Cecil, G., et al. 2000, ApJ, 536, 675
- Clarke, Kinney, & Pringle (1998) Clarke, C. J., Kinney, A. L., & Pringle, J. E. 1998, ApJ, 495, 189
- Claussen et al. (1998) Claussen, M. J., Diamond, P. J., Braatz, J. A., Wilson, A. S., & Henkel, C. 1998, ApJ, 500, L129
- Claussen & Lo (1986) Claussen, M. J., & Lo, K.-Y. 1986, ApJ, 308, 592
- Condon (2003) Condon, J. J. 2003, GBT PTCS Project Notes, 26
- Crook et al. (2007) Crook, A. C., Huchra, J. P., Martimbeau, N., Masters, K. L., Jarrett, T., & Macri, L. M. 2007, ApJ, 655, 790
- Curran (2000) Curran, S. J. 2000, A&AS, 144, 271
- da Costa et al. (1991) da Costa, L. N., Pellegrini, P. S., Davis, M., Meiksin, A., Sargent, W. L. W., & Tonry, J. L. 1991, ApJS, 75, 935
- da Costa, L. N., et al. (1998) da Costa, L. N., et al. 1998, AJ, 116, 1
- Darling, Brogan, & Johnson (2008) Darling, J., Brogan, C., & Johnson, K. 2008, ApJ, 685, L39
- Davoust & Contini (2004) Davoust, E., & Contini, T. 2004, A&A, 416, 515
- de Vaucouleurs et al. (1991) de Vaucouleurs, G., de Vaucouleurs, A., Corwin Jr., H. G., Buta, R. J., Paturel, G., & Fouque, P. 1991, Third Reference Catalogue of Bright Galaxies (New York: Springer-Verlag)
- de Vaucouleurs, de Vaucouleurs, & Nieto (1979) de Vaucouleurs, G., de Vaucouleurs, A., & Nieto, J.-L. 1979, AJ, 84, 1811
- di Nella et al. (1995) di Nella, H., Garcia, A. M., Garnier, R., & Paturel, G. 1995, A&AS, 113, 151
- Dreyer (1881) Dreyer, J. L. E. 1881, in New General Catalogue of Nebulae and Clusters of Stars, 1953 edition, Memoirs RAS (London)
- Elitzur (1982) Elitzur, M., 1982, RvMP, 54, 1225
- Erdoğdu et al. (2006) Erdoğdu, P., et al. 2006, MNRAS, 373, 45
- Fairall et al. (1992) Fairall, A. P., et al. 1992, AJ, 103, 11
- Falco et al. (1999) Falco, E. E., et al. 1999, PASP, 111, 438
- Fisher & Tully (1981) Fisher, J. R., & Tully, R. B. 1981, ApJS, 47, 139
- Fisher et al. (1995) Fisher, K. B., Huchra, J. P., Strauss, M. A., Davis, M., Yahil, A., & Schlegel, D. 1995, ApJS, 100, 69
- Fouque et al. (1990) Fouque, P., Bottinelli, L., Gouguenheim, L., & Paturel, G. 1990, ApJ, 349, 1
- Fukugita et al. (2007) Fukugita, M., et al. 2007, AJ, 134, 579
- Gallimore et al. (2004) Gallimore, J. F., Baum, S. A., & O’Dea, C. P. 2004, ApJ, 613, 794
- Gallimore et al. (1996) Gallimore, J. F., Baum, S. A., O’Dea, C. P., Brinks, E., & Pedlar, A. 1996, ApJ, 462, 740
- Gallimore et al. (2001) Gallimore, J. F., Henkel, C., Baum, S. A., Glass, I. S., Claussen, M. J., Prieto, M. A., & Von Kap-herr, A. 2001, ApJ, 556, 694
- García-Marín et al. (2006) García-Marín, M., Colina, L., Arribas, S., Alonso-Herrero, A., & Mediavilla, E. 2006, ApJ, 650, 850
- Greenhill (2004) Greenhill, L. J. 2004, in Science with the Square Kilometer Array, ed. C. Carilli & S. Rawlings, New Astronomy Reviews, 48, 1079
- Greenhill (2007) Greenhill, L. J. 2007, IAU Symposium 242, 381
- Greenhill et al. (1997a) Greenhill, L. J., Ellingsen, S. P., Norris, R. P., Gough, R. G., Sinclair, M. W., Moran, J. M., & Mushotzky, R. 1997a, ApJ, 474, L103
- Greenhill & Gwinn (1997) Greenhill, L. J., & Gwinn, C. R. 1997, Ap&SS, 248, 261
- Greenhill et al. (1997b) Greenhill, L. J., Herrnstein, J. R., Moran, J. M., Menten, K. M., & Velusamy, T. 1997b, ApJ, 486, L15
- Greenhill et al. (2003b) Greenhill, L. J., Kondratko, P. T., Lovell, J. E. J., Kuiper, T. B. H., Moran, J. M., Jauncey, D. L., & Baines, G. P. 2003b, ApJ, 582, L11
- Greenhill, Moran, & Herrnstein (1997c) Greenhill, L. J., Moran, J. M., & Herrnstein, J. R. 1997c, ApJ, 481, L23
- Greenhill, Tilak, & Madejski (2008) Greenhill, L. J., Tilak, A., & Madejski, G. 2008, ApJ, 686, L13
- Greenhill et al. (2003a) Greenhill, L. J., et al. 2003a, ApJ, 590, 162
- Greenhill et al. (2009) Greenhill, L. J., et al. 2009, arXiv:0902.4255
- Hagiwara (2007) Hagiwara, Y. 2007, AJ, 133, 1176
- Hagiwara et al. (2002) Hagiwara, Y., Henkel, C., Sherwood, W. A., & Baan, W. A. 2002, A&A, 387, L29
- Hagiwara et al. (1997) Hagiwara, Y., Kohno, K., Kawabe, R., & Nakai, N. 1997, PASJ, 49, 171
- Henkel et al. (2002) Henkel, C., Braatz, J. A., Greenhill, L. J., & Wilson, A. S. 2002, A&A, 394, L23
- Henkel et al. (2005) Henkel, C., Peck, A. B., Tarchi, A., Nagar, N. M., Braatz, J. A., Castangia, P., & Moscadelli, L. 2005, A&A, 436, 75
- Herrnstein, Greenhill, & Moran (1996) Herrnstein, J. R., Greenhill, L. J., & Moran, J. M. 1996, ApJ, 468, L17
- Herrnstein et al. (2005) Herrnstein, J. R., Moran, J. M., Greenhill, L. J., & Trotter, A. S. 2005, ApJ, 629, 719
- Herrnstein, J. R., et al. (1999) Herrnstein, J. R., et al. 1999, Nature, 400, 539
- Hibbard & Yun (1999) Hibbard, J. E. & Yun, M. S. 1999, AJ, 118, 162
- Hopkins et al. (2008) Hopkins, P. F., Hernquist, L., Cox, T. J., Dutta, S. N., & Rothberg, B. 2008, ApJ, 679, 156
- Howe (1900) Howe, H. A. 1900, MNRAS, 61, 29
- Hu (2005) Hu, W. 2005, in ASP Conf. Ser. 339, Observing Dark Energy, ed. S. C. Wolff & T. R. Lauer (San Francisco, CA, ASP), 215
- Huchra et al. (1983) Huchra, J., Davis, M., Latham, D., & Tonry, J. 1983, ApJS, 52, 89
- Huchra et al. (1993) Huchra, J., Latham, D. W., da Costa, L. N., Pellegrini, P. S., & Willmer, C. N. A. 1993, AJ, 105, 1637
- Humphreys et al. (2008) Humphreys, E. M. L., Reid, M. J., Greenhill, L. J., Moran, J. M., & Argon, A. L. 2008, ApJ, 672, 800
- Hunt et al. (1999) Hunt, L. K., Malkan, M. A., Rush, B., Bicay, M. D., Nelson, B. O., Stanga, R. M., & Webb, W. 1999, ApJS, 125, 349
- Ichikawa & Takahashi (2008) Ichikawa, K., & Takahashi, T. 2008, Journal of Cosmology and Astro-Particle Physics, 4, 27
- Ishihara et al. (2001) Ishihara, Y., Nakai, N., Iyomoto, N., Makishima, K., Diamond, P., & Hall, P. 2001, PASJ, 53, 215
- Jones et al. (2005) Jones, D. H., Saunders, W., Read, M., & Colless, M. 2005, Publications of the Astronomical Society of Australia, 22, 277
- Kameno et al. (2005) Kameno, S., Nakai, N., Sawada-Satoh, S., Sato, N., & Haba, A. 2005, ApJ, 620, 145
- Karachentsev (1980) Karachentsev, I. D. 1980, ApJS, 44, 137
- Keel (1996) Keel, W. C. 1996, ApJS, 106, 27
- Kinney et al. (2000) Kinney, A. L., Schmitt, H. R., Clarke, C. J., Pringle, J. E., Ulvestad, J. S., & Antonucci, R. R. J. 2000, ApJ, 537, 152
- Kondratko et al. (2005) Kondratko, P. T., Greenhill, L. J., & Moran, J. M. 2005, ApJ, 618, 618
- Kondratko et al. (2006b) —. 2006b, ApJ, 652, 136
- Kondratko et al. (2008) —. 2008, ApJ, 678, 87
- Kondratko et al. (2006a) Kondratko, P. T., et al. 2006a, ApJ, 638, 100
- Koranyi & Geller (2002) Koranyi, D. M., & Geller, M. J. 2002, AJ, 123, 100
- Lauberts & Valentjin (1989) Lauberts A., & Valentijn E.A 1989, The Surface Photometry Catalogue of the ESO-Uppsala Galaxies, ESO
- Malkan, Gorjian, & Tam (1998) Malkan, M. A., Gorjian, V., & Tam, R. 1998, ApJS, 117, 25
- Masters (2005) Masters, K. L. 2005, Ph.D. thesis, Cornell
- Mazzarella & Boroson (1993) Mazzarella, J. M., & Boroson, T. A. 1993, ApJS, 85, 27
- Middelberg et al. (2004) Middelberg, E., et al. 2004, A&A, 417, 925
- Miyoshi et al. (1995) Miyoshi, M., Moran, J., Herrnstein, J., Greenhill, L., Nakai, N., Diamond, P., & Inoue, M. 1995, Nature, 373, 127
- Morganti et al. (2004) Morganti, R., Greenhill, L. J., Peck, A. B., Jones, D. L., & Henkel, C. 2004, in Science with the Square Kilometer Array, ed. C. Carilli & S. Rawlings, New Astronomy Reviews, 48, 1195
- Nagar & Wilson (1999) Nagar, N. M., & Wilson, A. S. 1999, ApJ, 516, 97
- Nakai et al. (1995) Nakai, N., Inoue, M., Miyazawa, K., Miyoshi, M., & Hall, P. 1995, PASJ, 47, 771
- Nakai, Inoue, & Miyoshi (1993) Nakai, N., Inoue, M., & Miyoshi, M. 1993, Nature, 361, 45
- Nandra et al. (1997) Nandra, K., George, I. M., Mushotzky, R. F., Turner, T. J., and Yaqoob, T. 1997, ApJ, 477, 602
- Olling (2007) Olling, R. P. 2007, MNRAS, 378, 1385
- Osterbrock & Dahari (1983) Osterbrock, D. E., & Dahari, O. 1983, ApJ, 273, 478
- Paturel et al. (2003) Paturel, G., Theureau, G., Bottinelli, L., Gouguenheim, L., Coudreau-Durand, N., Hallet, N., & Petit, C. 2003, A&A, 412, 57
- Peck et al. (2003) Peck, A. B., Henkel, C., Ulvestad, J. S., Brunthaler, A., Falcke, H., Elitzur, M., Menten, K. M., & Gallimore, J. F. 2003, ApJ, 590, 149
- Pesch & Sanduleak (1983) Pesch, P., & Sanduleak, N. 1983, ApJS, 51, 171
- Pringle et al. (1999) Pringle, J. E., Antonucci, R. R. J., Clarke, C. J., Kinney, A. L., Schmitt, H. R., & Ulvestad, J. S. 1999, ApJ, 526, L9
- Reid et al. (2009) Reid, M. J., Braatz, J. A., Condon, J. J., Greenhill, L. J., Henkel, C., & Lo, K. Y. 2009, ApJ, 695, 287
- Riess et al. (2009) Riess, A. G., et al., 2009, arXiv:0905.0695v1
- Rines et al. (2002) Rines, K., Geller, M. J., Diaferio, A., Mahdavi, A., Mohr, J. J., & Wegner, G. 2002, AJ, 124, 1266
- Rothberg & Joseph (2006) Rothberg, B., & Joseph, R. D. 2006, AJ, 131, 185
- Sandage (1978) Sandage, A. 1978, AJ, 83, 904
- Saunders W., et al. (2000) Saunders W., et al. 2000, MNRAS, 317, 55
- Schinnerer et al. (2000) Schinnerer, E., Eckart, A., Tacconi, L. J., Genzel, R., and Downes, D. 2000, ApJ, 533, 850
- Schmitt et al. (2003) Schmitt, H. R., Donley, J. L., Antonucci, R. R. J., Hutchings, J. B., Kinney, A. L., & Pringle, J. E. 2003, ApJ, 597, 768
- Schweizer & Seitzer (2007) Schweizer, F., & Seitzer, P. 2007, AJ, 133, 2132
- Skrutskie et al. (2006) Skrutskie, M. F., et al. 2006, AJ, 131, 1163
- Springob et al. (2007) Springob, C. M., Masters, K. L., Haynes, M. P., Giovanelli, R., & Marinoni, C. 2007, ApJS, 172, 599
- Staveley-Smith & Davies (1988) Staveley-Smith, L., & Davies, R. D. 1988, MNRAS, 231, 833
- Strauss et al. (1992) Strauss, M. A., Huchra, J. P., Davis, M., Yahil, A., Fisher, K. B., & Tonry, J. 1992, ApJS, 83, 29
- Tarchi et al. (2007) Tarchi, A., Castangia, P., Henkel, C., & Menten, K. M. 2007, New Astronomy Reviews, 51, 67
- Ulvestad & Wilson (1984) Ulvestad, J. S., & Wilson, A. S. 1984, ApJ, 285, 439
- Vorontsov-Vel’Yaminov (1977) Vorontsov-Vel’Yaminov, B. A. 1977, A&AS, 28, 1
- Wegner et al. (2003) Wegner, G., et al. 2003, AJ, 126, 2268
- Weistrop & Downes (1991) Weistrop, D., & Downes, R. A. 1991, AJ, 102, 1680
- Yamauchi et al. (2004) Yamauchi, A., Nakai, N., Sato, N., & Diamond, P. 2004, PASJ, 56, 605
- Zabludoff, Huchra, & Geller (1990) Zabludoff, A. I., Huchra, J. P., & Geller, M. J. 1990, ApJS, 74, 1
- Zhao et al. (1997) Zhao, J.-H., Anantharamaiah, K. R., Goss, W. M., & Viallefond, F. 1997, ApJ, 482, 186

| GalaxyaaNewly discovered H2O maser emission hosts are indicated by a . | Type |
bbOptical positions used for GBT pointing. Uncertainties are typically less than
. Newly discovered maser emission in NGC 1320 and IRAS 16288+3929 lies within of the catalog positions for the two nuclei.
NGC 1320: (maser; VLA); (nucleus; Skrutskie et al., 2006). IRAS16288+3929: (maser; VLA); (nucleus; Abazajian et al., 2005). |
ccSystemic velocity (optical heliocentric) used in tuning the GBT observing bands. Velocities obtained from the NED. When multiple measurements are available, those with the smallest listed uncertainties were chosen, in most cases. | Date | ddAverage system temperature. Temperatures (and RMS noise) during 2005 January and February integrations have been increased by a conservative 30% factor to correct for apparent miscalibration of the noise-source. The correction factor was determined using a receiver temperature of 16.5 K, 6 K contribution due to spillover and microwave background emission, and archival average forecast ground temperature and 22 GHz opacity. | eeRMS noise in a kHz spectral channel corrected for atmospheric opacity (i.e., referenced to outside the atmosphere), for the dependence of antenna gain on elevation, and for uncertainty in the noise source power level (see note d. Calibration uncertainties are discussed in Section 2. |
|---|---|---|---|---|---|---|---|
| (hh mm ss) | (dd mm ss) | (km s-1) | (K) | (mJy) | |||
| UGC 12915 | LINER | 00 01 41.94 | 23 29 44.5 | 4336 | 2005-02-02 | 35 | 5.6 |
| UGC 00050 | LINER | 00 06 40.15 | 26 09 16.2 | 7552 | 2005-02-01 | 34 | 6.1 |
| NGC 17 | Sy2 | 00 11 06.55 | 12 06 26.3 | 5931 | 2006-04-18 | 47 | 3.2 |
| UGC 00238 | LINER | 00 25 03.35 | 31 20 42.6 | 6796 | 2005-02-01 | 35 | 5.6 |
| M31 | LINER | 00 42 44.32 | 41 16 08.5 | -300 | 2005-02-01 | 43 | 7.9 |
| IRAS 01189+2156 | Sy2 | 01 21 44.27 | 22 12 35.1 | 17478 | 2005-02-01 | 35 | 5.3 |
| UM 319 | Sy2 | 01 23 21.18 | 01 58 36.0 | 4835 | 2005-09-21 | 56 | 9.2 |
| UGC 00987 | Sy2 | 01 25 31.46 | 32 08 11.4 | 4658 | 2005-01-28 | 31 | 5.2 |
| NGC 0660 | LINER | 01 43 01.70 | 13 38 34.0 | 850 | 2005-02-02 | 43 | 8.7 |
| UGC 01282 | Sy2 | 01 49 29.87 | 12 30 32.6 | 5221 | 2005-02-02 | 38 | 6.5 |
| UGC 01479 | Sy2 | 02 00 19.06 | 24 28 25.3 | 4927 | 2005-02-02 | 36 | 5.7 |
| UGC 01757 | Sy2 | 02 17 23.05 | 38 24 49.9 | 5254 | 2005-01-28 | 30 | 5.5 |
| UGC 02456 | Sy2 | 02 59 58.59 | 36 49 14.3 | 3605 | 2005-02-01 | 42 | 5.9 |
| UGC 02638 | LINER | 03 17 02.21 | 01 15 17.9 | 7123 | 2005-09-21 | 54 | 10 |
| NGC 1320 | Sy2 | 03 24 48.70 | 03 02 32.2 | 2663 | 2005-09-30 | 47 | 5.9 |
| MCG -02-09-040 | Sy2 | 03 25 04.94 | 12 18 27.8 | 4495 | 2005-09-30 | 48 | 6.0 |
| SBS 0811+584 | Sy2 | 08 16 01.30 | 58 20 01.0 | 7584 | 2005-09-30 | 43 | 5.6 |
| NGC 2683 | Sy2 | 08 52 41.42 | 33 25 13.7 | 411 | 2005-09-30 | 44 | 6.5 |
| NGC 3190 | LINER | 10 18 05.77 | 21 49 55.8 | 1271 | 2005-10-01 | 46 | 5.9 |
| UGC 05613 | LINER | 10 23 32.50 | 52 20 30.0 | 9620 | 2005-02-01 | 34 | 6.0 |
| NGC 3593 | Sy2 | 11 14 37.00 | 12 49 04.0 | 628 | 2005-10-01 | 47 | 6.5 |
| NGC 3628 | LINER | 11 20 16.95 | 13 35 20.1 | 843 | 2005-02-01 | 52 | 8.1 |
| NGC 3753 | AGN | 11 37 53.90 | 21 58 53.0 | 8727 | 2005-02-01 | 40 | 5.5 |
| MCG +03-38-017 | AGN | 14 47 53.39 | 19 04 37.1 | 12506 | 2005-02-01 | 35 | 6.0 |
| IRASF 15033+2617 | Sy2 | 15 05 27.93 | 26 05 29.3 | 16579 | 2005-02-01 | 35 | 5.9 |
| IRASF 15588+6522 | AGN | 15 59 18.95 | 65 13 57.8 | 8975 | 2005-02-01 | 34 | 6.0 |
| IRAS 16288+3929 | Sy2 | 16 30 32.66 | 39 23 03.2 | 9161 | 2006-04-10 | 39 | 2.8 |
| UGC 10593 | Sy2 | 16 52 18.87 | 55 54 19.8 | 8739 | 2005-09-21 | 70 | 14 |
| UGC 10695 | LINER | 17 05 05.56 | 43 02 35.1 | 8328 | 2005-09-28 | 51 | 6.6 |
| NGC 6503 | LINER | 17 49 27.11 | 70 08 39.6 | 60 | 2005-09-28 | 56 | 6.5 |
| MCG +11-22-046 | Sy2 | 18 22 02.20 | 66 36 37.7 | 4393 | 2005-09-28 | 57 | 7.0 |
| CGCG 341-006 | Sy2 | 18 45 26.23 | 72 11 01.7 | 13880 | 2005-02-01 | 35 | 6.0 |
| NGC 7013 | LINER | 21 03 33.31 | 29 53 49.3 | 779 | 2005-02-02 | 38 | 5.9 |
| IC 1417 | Sy2 | 22 00 21.61 | 13 08 49.1 | 5345 | 2005-09-30 | 53 | 6.4 |
| NGC 7331 | LINER | 22 37 04.09 | 34 24 56.3 | 816 | 2005-02-01 | 42 | 7.2 |
| UGC 12201 | LINER | 22 49 09.55 | 34 59 30.5 | 5055 | 2005-02-02 | 34 | 4.9 |
| NGC 7466 | Sy2 | 23 02 03.42 | 27 03 09.5 | 7493 | 2005-02-01 | 32 | 5.1 |
| UGC 12318 | Sy2 | 23 02 08.01 | 25 40 13.7 | 9533 | 2005-02-01 | 34 | 5.5 |
| NGC 7549 | AGN | 23 15 17.23 | 19 02 30.1 | 4736 | 2005-02-02 | 35 | 5.5 |
| UGC 12519 | Sy2 | 23 20 02.75 | 15 57 10.6 | 4378 | 2005-02-01 | 38 | 5.6 |
| Galaxy | TypeaaActivity type from the NED, except for NGC 0235A, which is from Kondratko et al. 2006a. | bbGBT pointing positions adopted from Kondratko et al. 2006a for NGC 0235A, NGC 4293 (), from Greenhill et al. 2003b for NGC 2824, NGC 2979, IRASF 19370-0131 (), and from the NED for NGC 449 (), UGC 4203 (), Arp 299 (NGC 3690, ), NGC 3735 (). | bbGBT pointing positions adopted from Kondratko et al. 2006a for NGC 0235A, NGC 4293 (), from Greenhill et al. 2003b for NGC 2824, NGC 2979, IRASF 19370-0131 (), and from the NED for NGC 449 (), UGC 4203 (), Arp 299 (NGC 3690, ), NGC 3735 (). | ccSystemic velocity (optical heliocentric) obtained from the NED used in tuning the GBT observing bands. Measurements for individual galaxies follow (in km s-1). NGC 449 (Mrk 1): (optical; Falco et al. 1999), (optical; Keel, 1996), (HI; Bottinelli et al., 1990); NGC 2979: (HI; Saunders et al. 2000), (HI; Paturel et al., 2003), (optical; Fisher et al. 1995), (optical; Fairall et al., 1992); NGC 3735: (optical; Sandage, 1978), (optical; Falco et al. 1999), (HI; Staveley-Smith & Davies, 1988), (HI; Fisher & Tully, 1981), (optical; de Vaucouleurs, de Vaucouleurs, & Nieto, 1979); UGC 04203 (Mrk 1210): (optical; Fisher et al., 1995), (HI; Bottinelli et al., 1990), (optical; Falco et al. 1999); Arp 299 (NGC 3690): see Hibbard & Yun 1999 concerning nomenclature): (optical; García-Marín et al., 2006), (radio; Zhao et al., 1997); Arp 299 (IC 694): (radio; Zhao et al., 1997), (optical; García-Marín et al., 2006); NGC 4293: (optical; de Vaucouleurs et al., 1991), (optical; J. Huchra, private communication); (optical; Falco et al. 1999), (optical; di Nella et al., 1995), (optical; Huchra et al., 1983); NGC 0235A (ESO 474-G016): (optical; da Costa et al. 1998), (optical; da Costa et al., 1991), (optical; Wegner et al. 2003), (optical; Jones et al., 2005); NGC 2824: (optical; Huchra et al., 1983), (optical; Falco et al. 1999); IRASF 19370-0131: (optical; Strauss et al., 1992), (optical; Jones et al., 2005). | Date | ddAverage system temperature (not corrected for opacity). | eeRMS noise in a 24.4-kHz spectral channel corrected for atmospheric opacity (typically from to ) and for the dependence of antenna gain on elevation. |
|---|---|---|---|---|---|---|---|
| (hh mm ss) | (dd mm ss) | (km s-1) | (K) | (mJy) | |||
| NGC 449 (Mrk 1) | Sy2 | 01 16 07.25 | 33 05 22.4 | 4780 | 2006-04-19 | 48 | 2.4 |
| NGC 2979 | Sy2 | 09 43 08.65 | 10 23 00.0 | 2720 | 2006-02-09 | 37 | 2.0 |
| NGC 3735 | Sy2 | 11 35 57.30 | 70 32 08.1 | 2696 | 2006-02-09 | 37 | 3.9 |
| UGC 4203 (Mrk 1210) | Sy2 | 08 04 05.86 | 05 06 49.8 | 2006-04-24 | 44 | 3.3 | |
| Arp 299 (NGC 3690) | AGN | 11 28 32.20 | 58 33 44.0 | 2006-04-27 | 46 | 2.9 | |
| NGC 4293 | LINER | 12 21 12.82 | 18 22 57.4 | 2006-04-10 | 38 | 2.8 | |
| NGC 0235A | Sy2 | 00 42 52.81 | 23 32 27.8 | 2006-02-01 | 58 | 3.8 | |
| NGC 2824 | AGN | 09 19 02.22 | 26 16 12.0 | 2006-01-27 | 35 | 2.5 | |
| IRASF 19370-0131 | Sy2 | 19 39 38.91 | 01 24 33.2 | 2006-04-19 | 48 | 3.7 |
| Source | Epoch | Time MonitoraaEpochs over which spectral features were tracked, enabling estimation of accelerations (Figures 6,7). | Mean SpectrumbbEpochs used to generate the weighted mean spectrum (Figure 5). For each source, the best three spectra were selected, with particular attention to the flatness of the spectral baseline. |
|---|---|---|---|
| CG 211ccThe CG designation refers to the Case low-dispersion spectroscopic survey (Pesch & Sanduleak, 1983, and later papers by the same authors). | 2003-12-08 | x | … |
| 2005-01-15 | x | x | |
| 2005-09-28 | x | x | |
| 2006-01-22 | x | x | |
| NGC 6264 | 2005-01-27 | … | x |
| 2005-10-17 | x | x | |
| 2006-02-01 | x | x | |
| 2006-06-05 | x | … | |
| VV 340A | 2003-12-13 | x | … |
| 2005-01-15 | x | x | |
| 2005-06-07 | x | … | |
| 2005-10-01 | x | x | |
| 2006-02-01 | x | x |
| Source | EpochaaReference epoch for component velocities. | bbReduced chi-squared for the least-squares decomposition of line profiles into Gaussian components, in which reference-epoch velocities, secular drifts, time-varying widths, and light curves are simultaneously fit for each Gaussian component using a time-series of spectra. Only components with signal-to-noise for two or more epochs are reported. | VelocityccReference epoch for fitted velocity. | DriftddVelocity drift of a Gaussian component. | Epochs |
|---|---|---|---|---|---|
| (km s-1) | (km s-1 yr-1) | ||||
| CG 211eeLow-velocity plateaus were modeled by an FWHM km s-1 stationary Gaussian component for CG 211 and a first-order polynomial for VV 340A. These components are not reported here. | 2003 Dec 08 | 4 | |||
| 2003 Dec 08 | |||||
| (avg. = 0.9)ffUnweighted arithematic average for use in the calculation of entries in Table 5 (see discussion in Section 4.1). | |||||
| NGC 6264 | 2005 Oct 17 | 3 | |||
| (avg. = 2)ffUnweighted arithematic average for use in the calculation of entries in Table 5 (see discussion in Section 4.1). | |||||
| VV 340AeeLow-velocity plateaus were modeled by an FWHM km s-1 stationary Gaussian component for CG 211 and a first-order polynomial for VV 340A. These components are not reported here. | 2003 Dec 13 | 5 |
| Galaxy | RadiusaaBecause of the uncertainties due to the lack of VLBI data as discussed in Section 4.1, the accuracies of the masses and radii may be as large as half an order of magnitude. | MassaaBecause of the uncertainties due to the lack of VLBI data as discussed in Section 4.1, the accuracies of the masses and radii may be as large as half an order of magnitude. |
|---|---|---|
| (pc) | M⊙) | |
| CG 211 | 0.4 | 3 |
| NGC 6264 | 0.2 | 2 |
| VV 340A | 0.3 | 7 |
| Evidence for Disk MasereeReferences for identification of disk maser candidates via spectroscopy: (1) Greenhill et al. (1997c); (2) Nakai et al. (1995); (3) Greenhill et al. (1997a); (4) Nakai, Inoue, & Miyoshi (1993); (5) Braatz et al. (1996); (6) Claussen & Lo (1986); (7) Hagiwara et al. (2002); (8) Braatz et al. (2004); (9) this work; (10) Hagiwara et al. (1997); (11) Kondratko et al. (2006a); (12) Henkel et al. (2002); (13) Greenhill et al. (2003b); (14) Braatz & Gugliucci (2008); (15) Kondratko et al. (2006b). References for confirmation of disk maser identification via VLBI study: (16) Greenhill et al. (2003a); (17) Argon et al. (2007); (18) Braatz et al. (1997a); (19) Greenhill & Gwinn (1997); (20) Kondratko et al. (2005); (21) Ishihara et al. (2001); (22) Kondratko et al. (2008); (23) Braatz et al. (2007); (24) Reid et al. (2009). | |||||
|---|---|---|---|---|---|
| SourceaaPublished disk maser candidates,in order of increasing recessional velocity. Missing isophotal sizes or merger activity exclude IRASF 22265-1826; CG 211, VV 340A, 3C 403, NGC 17. | bbMorphological classification. | ccInclination from axial ratio . | ddModified inclination (Fouque et al., 1990). Numbers in parentheses are obtained by adding to to obtain a real inclinations. | Spectrum | Map |
| (∘) | (∘) | Ref. | Ref. | ||
| NGC 4945ffDisk maser status confirmed by VLBI observations. | 6 | 79 | 86 | 1 | 1 |
| CircinusffDisk maser status confirmed by VLBI observations. | 3 | 64 | 69 | 2, 3 | 16 |
| NGC 4258ffDisk maser status confirmed by VLBI observations. | 4 | 67 | 71 | 4 | 17 |
| NGC 1386ffDisk maser status confirmed by VLBI observations. | -0.6 | 68 | (87) | 5 | 18 |
| NGC 1068ffDisk maser status confirmed by VLBI observations. | 3 | 32 | 33 | 6 | 19 |
| NGC 3079ffDisk maser status confirmed by VLBI observations. | 7 | 80 | 85 | 7 | 20 |
| NGC 4388 | 3 | 77 | (87) | 8 | … |
| NGC 3735 | 5 | 78 | (86) | 9 | … |
| NGC 1320 | 1 | 70 | 85 | 9 | … |
| NGC 5728 | 1 | 54 | 60 | 8 | … |
| IC 2560ffDisk maser status confirmed by VLBI observations. | 3.3 | 51 | 53 | 5 | 21 |
| NGC5̇793 | 3 | 70 | 77 | 10 | … |
| NGC 3393ffDisk maser status confirmed by VLBI observations. | 1 | 24 | 26 | 11 | 22 |
| NGC 591 | 0 | 34 | 37 | 8 | … |
| Mrk 1419 | 1 | 46 | 50 | 12 | … |
| NGC 6926 | 4 | 46 | 48 | 13 | … |
| NGC 5495 | 4.6 | 37 | 38 | 11 | … |
| NGC 6323ffDisk maser status confirmed by VLBI observations. | 2 | 71 | 81 | 8 | 23 |
| NGC 2979 | 1 | 51 | 55 | 9 | … |
| UGC 3789ffDisk maser status confirmed by VLBI observations. | 2 | 29 | 31 | 14 | 24 |
| UGC 3193 | 2.3 | 68 | 74 | 14 | … |
| UGC 4203 | 1 | 0 | 0 | 9 | … |
| NGC 449 | 5 | 52 | 54 | 9 | … |
| ESO 269-G012 | –2 | 39 | 41 | 13 | … |
| NGC 6264 | … | 51 | … | 15 | … |