GRB 090426: the farthest short gamma-ray burst?††thanks: The results reported in this paper are based on observations carried out at Telescopio Nazionale Galileo and at Large Binocular Telescope
Abstract
Aims. With an observed and rest-frame duration of s and s, respectively, GRB 090426 could be classified as a short GRB. The prompt detection, both from space and ground-based telescopes, of a bright optical counterpart to this GRB offered a unique opportunity to complete a detailed study.
Methods. Based on an extensive ground-based observational campaign, we obtained the spectrum of the optical afterglow of GRB 090426, measuring its redshift and obtaining information about the medium in which the event took place. We completed follow-up observation of the afterglow optical light curve down to the brightness level of the host galaxy that we firmly identified and studied. We also retrieved and analyzed all the available high-energy data of this event, and compared the results with our findings in the optical. This represents one of the most detailed studies of a short-duration event presented so far.
Results. The time properties qualify GRB 090426 as a burst. In this case, its redshift of would be the highest yet found for a GRB of this class. On the other hand, the spectral and energy properties are more similar to those of bursts. LBT late-time deep imaging identifies a star-forming galaxy at a redshift consistent with that of the GRB. The afterglow lies within the light of its host and shows evidence of local absorption.
Key Words.:
gamma ray: bursts – gamma ray: individual GRB 0904261 Introduction.
Gamma-ray bursts (GRBs) are intense gamma-ray flashes with typical duration ranging from milliseconds to thousands seconds. Two classes of GRBs have been identified: short-duration (less than 2 s) and hard-spectrum GRBs (SHBs), and long-duration (more then 2 s) and soft-spectrum GRBs (LSBs) (e.g. Kouveliotou et al. (1993)). For many years, the lack of observational data at both X-ray and optical wavelengths hampered the study of short GRBs. In 2005, an important breakthrough was provided by the first detections of SHB afterglows triggered by and . The discovery of optical afterglows enabled the measurement of SHB redshifts and identification of their host galaxies (e.g., Berger et al. (2005); Bloom et al. (2006); D’Avanzo et al. (2009)). This established that, like LSBs, SHBs are also high-redshift relativistically expanding sources. In the past four years, it has been possible to derive a redshift for at least 10 SHBs. However, in all of those cases, the redshift was not directly measured, but inferred from the redshift of the putative host galaxy. In addition, the redshift distribution of SHBs appears to differ from that of LSBs, supporting the conjecture that they have a different origin. Unlike LSBs, SHBs are probably not produced by the collapse of massive stars (e.g., Nakar (2007) for a review). A popular model for SHBs involves the coalescence of two compact objects bound in a binary system (of double set of neutron stars, or a neutron star (NS) and a black hole (BH)). These systems have survived two supernova explosions, the resulting kick velocity having taken the systems significantly far away from their region of origin before the two compact objects merge. The delay between binary formation and merging depends strongly on the initial system separation, and theoretical works (Belczynski et al. (2002, 2006)) showed that a substantial fraction of the merging events should take place outside, or in the outskirts, of galaxies. In addition, double-neutron-star systems may be formed by exchange interactions in core-collapse globular clusters (Grindlay et al. (2006)). If most short GRBs originate in merging binaries, the present sample of short GRBs of known redshift indicates that at least of the merging binaries are formed in this way (Guetta & Stella, (2009)). Firm spectroscopic measurements of SHBs, as well as the properties of their host galaxies, are of crucial importance in determining their origin.
2 GRB 090426.
GRB 090426 was discovered by the coded-mask Burst Alert Telescope (BAT) on April 2009, at =12:48:47 UT (Cummings et al. (2009)). Following the BAT trigger, the satellite automatically slewed to observe the GRB region with the on board narrow field instruments. The X-ray Telescope (XRT) began observing the field 84.6 seconds after the BAT trigger detecting an uncatalogued X-ray source within the BAT error circle (Cummings et al. (2009)). A candidate afterglow was also detected by the UV-Optical Telescope (UVOT) on board in the white, B, U filters and marginally in the V filter at coordinates , but it was not detected in the UVOT UV filters (Oates et al. (2009)). The optical afterglow observed by UVOT was also confirmed by several observations from other ground-based telescopes (e.g., Xin et al. (2009); Yoshida et al. 2009a ; Yoshida et al. 2009b ; Olivares et al. (2009); Mao et al. (2009)). A redshift of 2.609 was measured first by Keck/LRSI (Levesque et al. (2009a, b)) and confirmed by other groups with the VLT (Thöne et al. (2009)) and the TNG (this work).
3 X-ray observations.
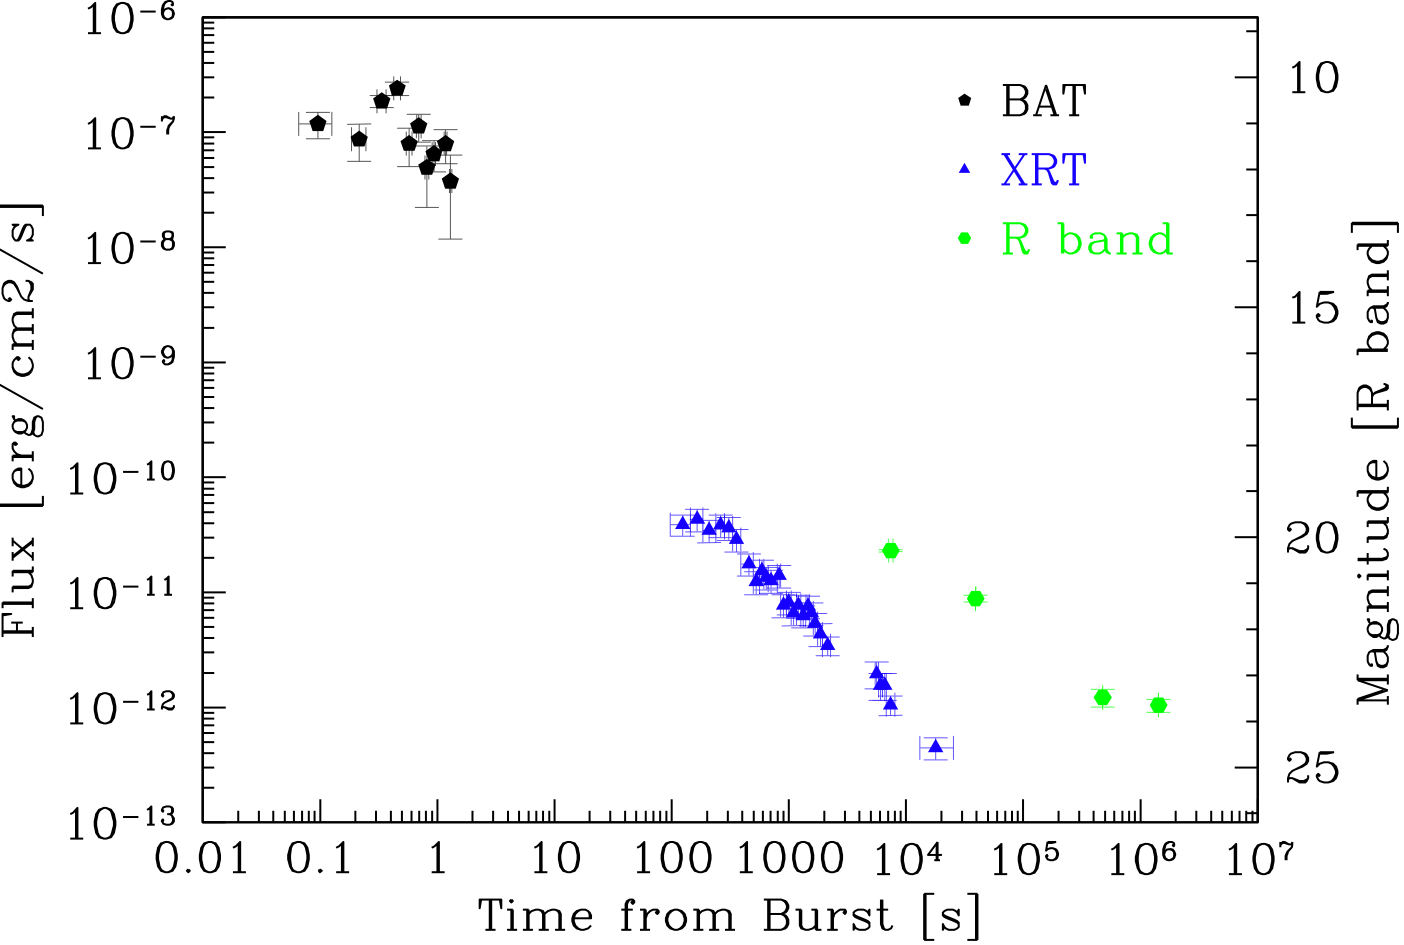
The BAT event data were analyzed with the BAT analysis software included in the HEASOFT distribution (v.6.6.2) following standard procedures (Krimm et al. (2004)). All the errors reported are quoted at the 90% confidence level. The burst has a duration of s in the keV band. The mask-weighted light curve shows a few overlapping peaks starting at about s, peaking at s, and ending at s (Fig.1).
The spectral lag of this GRB is consistent with zero with a relatively large uncertainty
(Ukwatta et al. (2009)) and is consistent with the typical (negligible) temporal lag value measured
for short GRBs (lags of few seconds are typical of long GRBs) (e.g., Gehrels et al. (2006); Norris et al. (2000)).
The BAT spectrum in the 15-150 keV energy band can be fit satisfactorily () by a simple
power-law, yielding a photon index and a fluence of erg cm-2.
Another fit with a Band function with photon indexes =-1, = -2.3 and the peak
energy and the normalization as the only free parameters provides = keV ().
By using this model and assuming the measured redshift of 2.61, we derive erg
(in the 1-10000 keV cosmological rest-frame energy band) and keV111Assuming a flat
Friedman-Robertson-Walker cosmology with km s-1 Mpc-1, and
. We note that this estimate of is fully consistent with the expected value of 50 keV
based on the photon index – peak energy correlation found for the SHB spectra detected by BAT (Sakamoto et al. (2009)).
We also allow the and parameters of the Band function to vary, obtaining
a lower limit to of 35 keV (90% c.l.) and, in the cosmological rest frame of the source,
keV, ergs.
The XRT observations started on April 26, 2009 (85 s after the burst), and ended on
May 5, 2009, thus adding up a total net exposure time (all obtained in photon-counting,
PC mode) of about 54 ksec spread over 9 days.
The monitoring was divided in 7 observations. The XRT data were processed with the
xrtpipeline task (v0.9.9), applying standard calibration, filtering, and screening criteria.
At the beginning of the XRT observation, the intensity of the afterglow was high enough to cause
pile-up in the data. To account for this effect, we extracted the source events in an annulus with a
30-pixel outer radius and a 2-pixel inner radius. Then the entire circular region (30-pixel radius)
was used to obtain late-time data. To account for the background, data were also extracted within
an annular region (inner and outer radii of 50 and 100 pixels) centred on the source.
All the errors reported are quoted at the 90% confidence level.
The extracted light curve is fitted well by a broken power-law with indices
and , and a break time of s.
Spectra of the source and background were extracted from the same regions described above during the first orbit.
The (0.3 – 10) keV band spectra were rebinned with a minimum of 20 counts per energy bin to allow the use
of the statistic, and fitted by adopting a simple model of a galactic absorber plus an absorbed (at z=2.61)
power-law model. The galactic hydrogen column density was fixed at cm-2 (Kalberla et al. (2005)).
We found a spectral photon index of and an intrinsic equivalent hydrogen column density
at z=2.61 of cm-2.
4 Optical observations.
We observed the field of GRB 090426 with the Italian 3.6-m TNG telescope, located in La Palma (Canary Islands), using the DOLORES (Device Optimized for the LOw RESolution) camera, and with the Large Binocular Telescope (LBT), located on Mt. Graham (Arizona), using the Large Binocular Cameras (LBC, both the blue and the red channel).
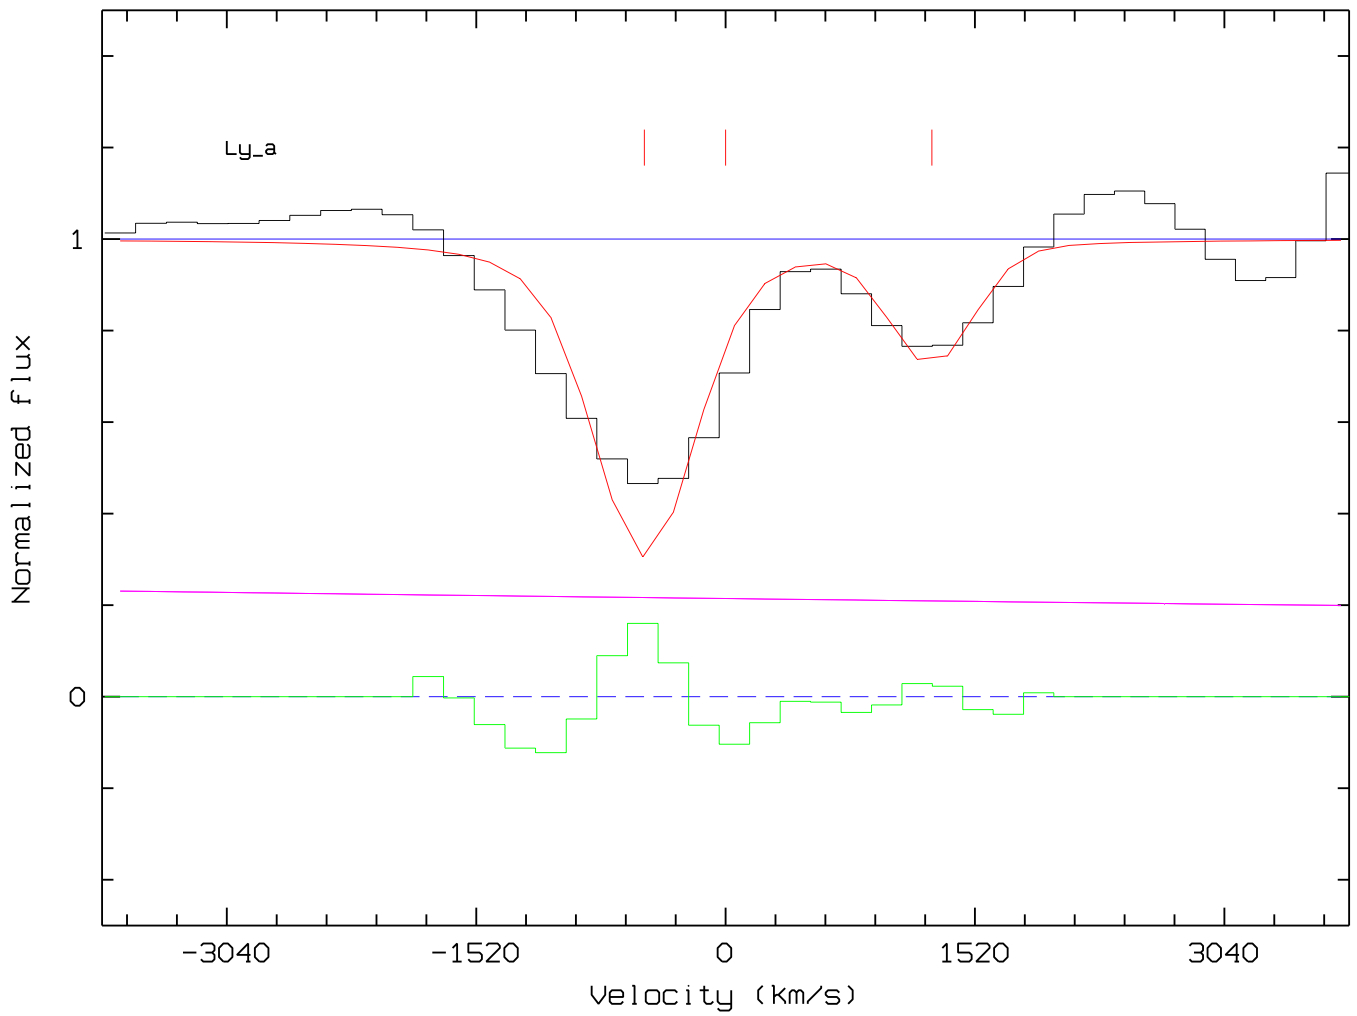
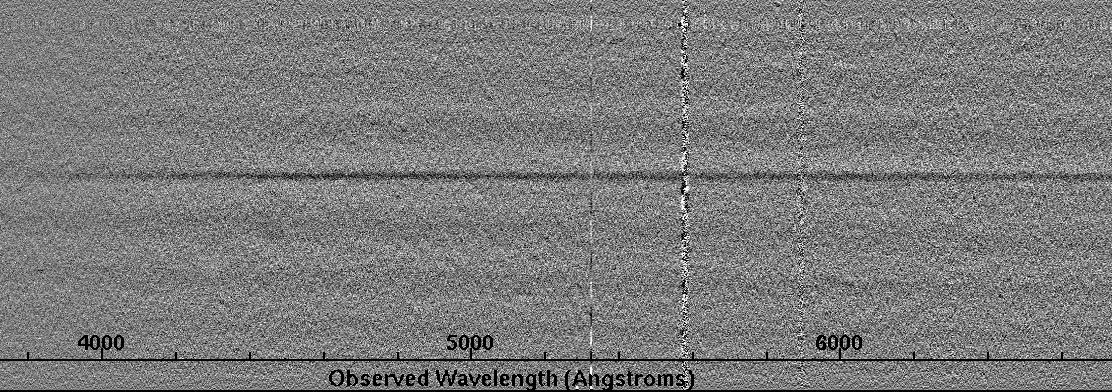
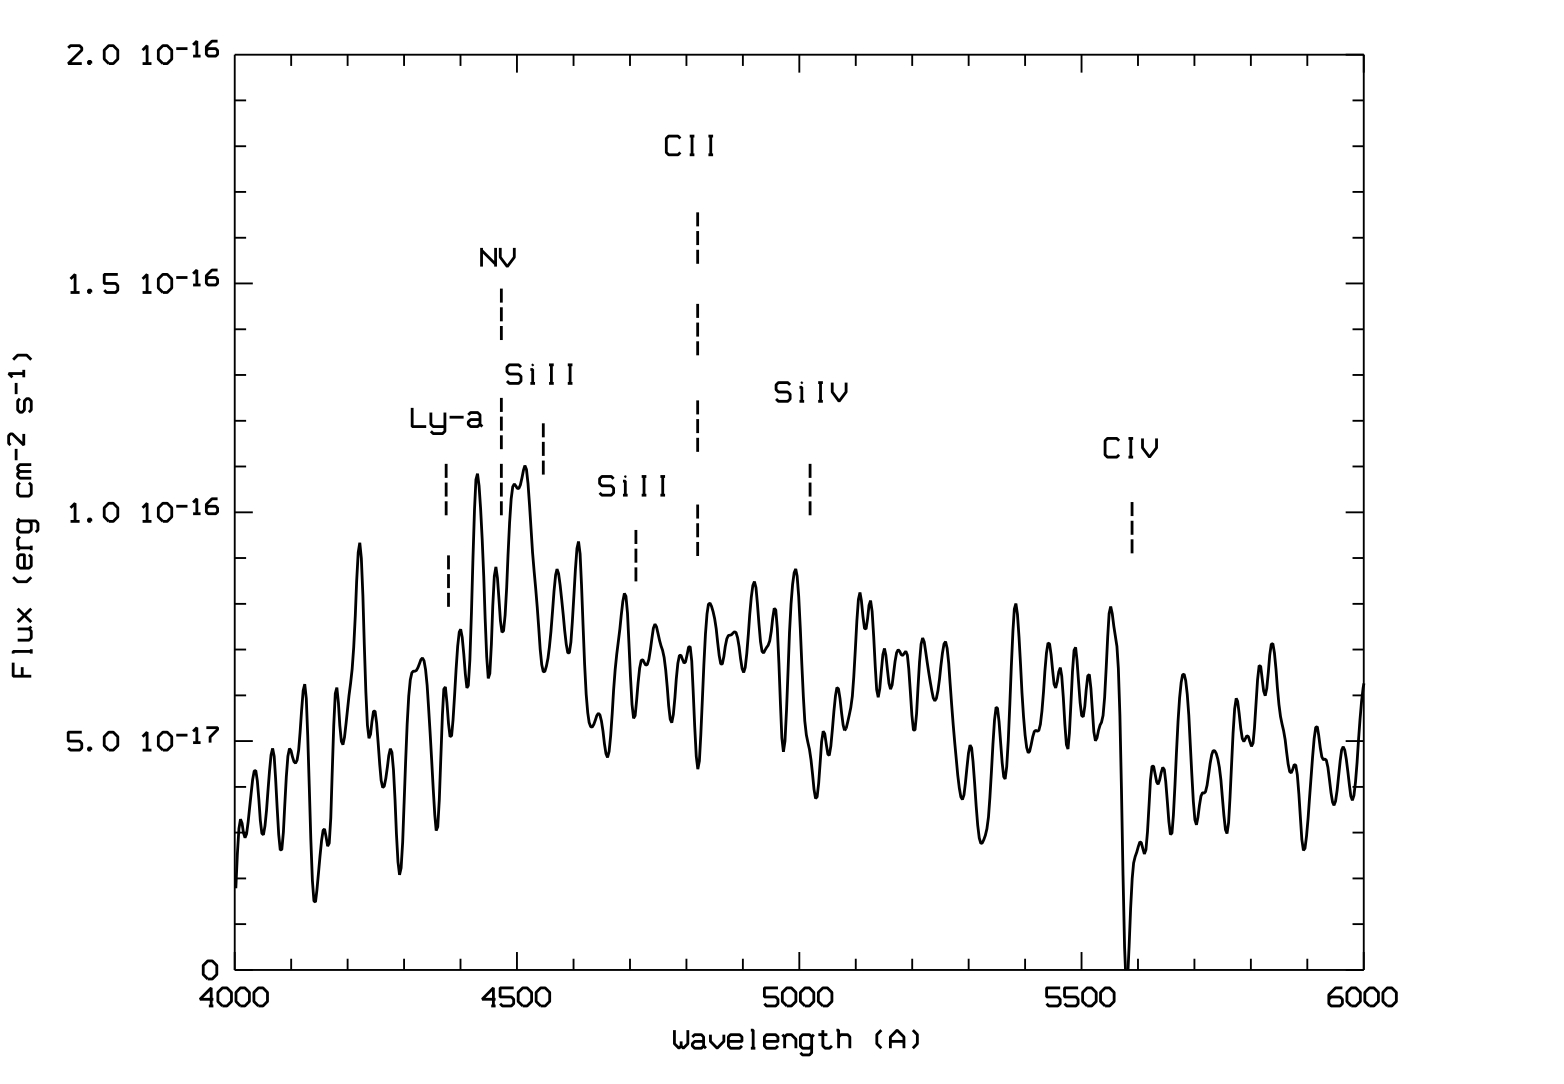
The optical afterglow reported by Cummings et al. (2009) and Xin et al. (2009) was clearly visible in our , , , and band images taken at TNG on April 27, 2009 (Table 1). Its coordinates , ( error) are fully consistent with the enhanced -XRT and UVOT positions (Osborne et al. (2009); Oates et al. (2009)). During the same night, we also obtained medium-resolution spectra of the afterglow using the DOLORES camera with the grism LR-B and a slit. The final reduced spectrum, smoothed using a 6 pixel width Gaussian filter, is shown in Fig. 3; it has a signal-to-noise ratio of and covers the 3000–8000 Å wavelength range with a resolution of . From the detection of several absorption lines (Table2), we derived a redshift of . This is consistent with the measurements reported in Levesque et al. (2009a); Thöne et al. (2009), and Levesque et al. (2009b). From the optical spectrum, using FITLYMAN within the MIDAS package, we also measured the column density of the Ly- line at z=2.61, obtaining cm-2. However, we note that there is a second component (see Fig. 5) that, if interpreted as Ly- absorption at , has a column density of cm-2 (uncertainties are given at 1). Both values are much lower than the typical column densities of GRB afterglows with Ly- lines ( cm-2) and are consistent with the upper limit derived by Levesque et al., (2009b) from a Keck/LRIS spectrum. Owing to the poor S/N of the other lines, the metal column densities could not be derived. However, their large optical depths, together with the unusual low values, leads us to conclude that the host absorber should have a metallicity exceeding the solar one. This result is also confirmed by the higher derived from the X-ray data, whose value is obtained by taking into account the absorption edges of heavy elements based on the assumption of solar abundance.
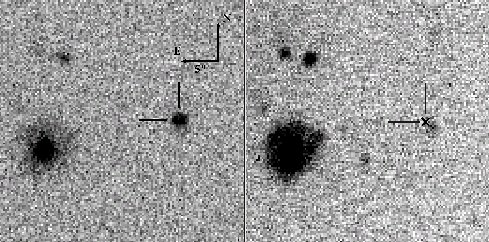
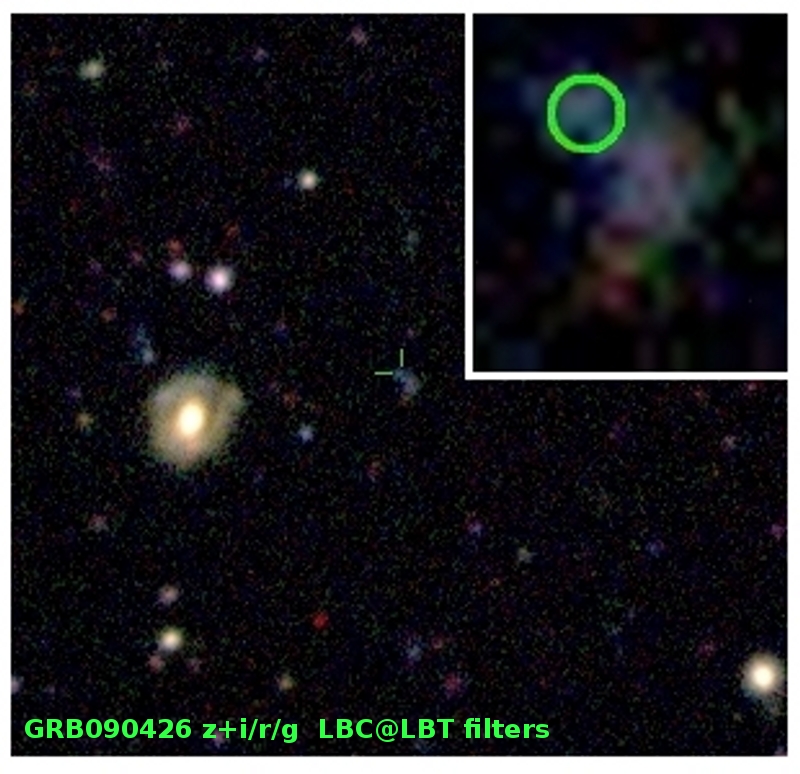
With the aim to search for the host galaxy (HG), we monitored the field at several epochs in different bands with both TNG and LBT (Table 1). The afterglow and the host galaxy were detected in the late TNG images but were not clearly resolved (Fig. 2). Deep LBT images were obtained in the four SDSS-like filters , , , and between May 30, 2009 and June 1, 2009 using the LBC prime-focus camera, in binocular mode as reported in Table 1. In the LBT images, we observed a clearly extended object with an irregular shape that could be the host galaxy (HG) of GRB 090426. The emission maximum of this object occurs at , , i.e., S-W from the optical afterglow position (Fig. 6). At the position of the GRB afterglow we observed an extended emitting knot (hereafter N-E knot) (Table 1) . Both objects were also studied in Levesque et al. (2009b). This extended emission appears to be connected with the HG suggesting that they are either part of the same object (e.g., a region) or an interacting system. From our multiband optical photometry, using the program described in Fontana et al. (2000), we derived for the observed object a photometric redshift of , which is consistent (within the errors) with the measured redshift of the afterglow. If we assume that this object is the HG of GRB 090426, then its band absolute magnitude is and the afterglow would be located at a projected distance of kpc from the emission maximum.
5 Results and discussion
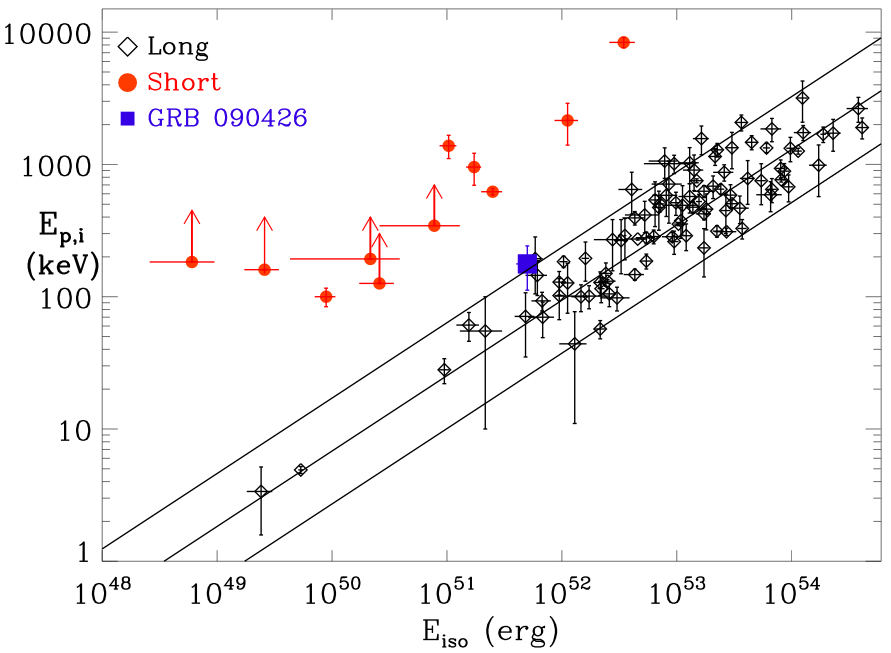
Most of the properties of SHB prompt emission are derived from BATSE bursts by using the sampling criterion s. This distinction suffices for the purpose of statistical population analysis, but the 2 s duration dividing-line gives rise to a significant overlap between long and short GRBs. To classify a SHB, additional information about the spectrum, released energy, and temporal structure are required. GRB 090426 had a s (corresponding to s in its rest-frame), which is well within the range typical of SHBs. The isotropic energy released in the prompt phase, erg, remains consistent with the typical energy of SHBs, though close to the higher end of the range (e.g., Nakar (2007)). The hardness ratio at high energies shows that short bursts are on average harder than the long GRBs (e.g., Kouveliotou et al. (1993)). The spectrum of GRB 090426 is well within the photon index distribution of BAT spectra of Swift SHBs, even if it is one of the softest observed (Sakamoto et al. (2009)). Nevertheless, we note that the estimated values (or limits) of and of GRB 090426 lie at the border of the confidence region of the – correlation that holds for LSBs (Fig. 4) (Amati et al. (2008)). This is quite peculiar because other SHBs of known redshift and measured are outliers to this correlation at more than 3 c.l. (Fig. 4) (e.g., Piranomonte et al. (2008)). From the point of view of its spectral and energetic properties, GRB 090426 straddles the SHB and LSB classes. Based on the burst duration and peak energy of GRB 090426, Levesque et al (2009b) classify this GRB as a SHB. However, when considering the large number of LSB detected so far, these authors also note that the combination of parameters leading to this classification might have occurred by chance from the distribution of parameters characterising LSB. Therefore, even though the 0.3 s duration would place GRB 090426 in the short burst category, its classification remains uncertain.
The X-ray afterglow light curve shows the typical power-law decay of SHBs ( ) with a short initial plateau in the first s followed by a smooth decay () without further breaks until s after the burst (Fig. 1). The initial flattening is not common in the X-ray afterglow of SHBs but it was observed in at least another case: GRB 061201 (Stratta et al., (2007)). The optical light curve of the afterglow shows a power–law decay with a slope that is shallower than in X-ray (). Such a steeper decay in the X-ray band is roughly consistent with the prediction of the standard fireball model for an outflow propagating in a constant-density circumburst medium when the cooling break occurs between the optical and X-ray bands. Later, at days, the -band optical light curve became flatter. This flattening was probably caused by the emerging flux of the HG, which is not resolved well in the TNG images but is clearly detected in the late-time LBT observations. The X-ray spectrum has a typical value of the spectral index but an intrinsic absorption of cm-2 in the rest-frame which is quite high for SHBs. This high intrinsic absorption derived from the spectrum of the X-ray afterglow implies a dense circumburst region as often observed for LSBs. This is also confirmed by the presence of highly ionized absorption lines such as NV and CIV and SiIV in the optical spectrum. To study the HG we performed a photometric fitting of the LBT data of both the HG and the N–E knot assuming and using different synthetic galaxy templates and extinction laws. A large number of models provide a good fit for the HG but the best fit () is provided by an evolved galaxy model with a Milky Way extinction law () and a specific star formation rate (SSFR: the ratio of SFR to the stellar mass of the galaxy) of Gyr-1. We also found, with a larger uncertainty, that the N–E knot (associated with the GRB location) is characterized more accurately by a higher extinction () and a higher SFR. This knot could be a star-forming region possibly related to the HG or a different object interacting with the HG (Fig. 6).
Regardless of its classification, GRB 090426 represents an intriguing example of GRB progenitors. In the scenario involving the merging of a double compact object system, the position of the afterglow within the host galaxy, the intrinsic absorption measured in the X-ray spectrum, and the detection of highly ionized absorption lines (such as NV, CIV and SiIV) in the optical spectrum of the afterglow are strongly indicative of a “primordial” binary system that merged in a relatively short time ( yr), when most systems remained in side their star-forming regions. The existence of these “short-lived” systems has been investigated by several authors (e.g. Belczynski & Kalogera (2001); Perna & Belczynski (2002); Belczynski et al. (2006)), and the association of this progenitor with GRB 090426 is also in close agreement with the relatively high redshift of this event (the highest measured for a short-duration GRB). On the other hand, the same properties listed above (low offset, intrisic absorption, high), together with the relatively high SFR measured for the host galaxy (Sect. 3.1) and the consistency with the – correlation, can also be interpreted as well by assuming a core-collapse supernova progenitor, as it has been observed for many long GRBs. But it is then not easy to reconcile the short rest-frame duration of the prompt event (s) with the expected size of the progenitor, which, otherwise, makes the association of GRB 090426 with a massive star progenitor not straightforward (e.g., Woosley & Bloom, (2006)).
Acknowledgements.
We acknowledge an anonymous referee for useful comments and the excellent support from TNG staff. LAA thanks F. Calabró and M. Lopergolo for having made his research possible. The LBT is an international collaboration among institutions in the USA, Italy, and Germany. LBT Corporation partners are the University of Arizona, on behalf of the Arizona university system; Istituto Nazionale di Astrofisica, Italy; LBT Beteiligungsgesellschaft, Germany, representing the Max Planck Society, the Astrophysical Institute Potsdam, and Heidelberg University; The Ohio State University; and the Research Corporation, on behalf of the University of Notre Dame, University of Minnesota, and University of Virginia.References
- Amati et al. (2008) Amati, L., Guidorzi, C., Frontera, F., et al. 2008, MNRAS, 391, 577
- Amati et al. (2009) Amati, L., Frontera, F. and, Guidorzi, C., 2009, A&A, in press.
- Belczynski & Kalogera (2001) Belczynski, K. & Kalogera, V., 2001, ApJ, 550, L183.
- Belczynski et al. (2002) Belczynski, K., Bulik, T., and Rudak, B. 2002, ApJ, 571, 394
- Belczynski et al. (2006) Belczynski, K., Perna, R., Bulik, T. et al., 2006, ApJ, 648, 1110
- Berger et al. (2005) Berger, E., Price, P. A., Cenko, S. B. et al. 2005, Nature 438, 988
- Berger et al. (2007) Berger, E., Fox, D., Price, P. A., et al., 2007, ApJ , 664, 1000
- Bertin & Arnouts (1996) Bertin & Arnouts, 1996, A&AS, 117, 393)
- Bloom et al. (2006) Bloom, J. S., Prochaska, J. X., Pooley, D. et al., 2006, ApJ, 638, 354
- Cummings et al. (2009) Cummings, J.R., et al., 2009, GCN Circular, 9254
- D’Avanzo et al. (2009) D’Avanzo, P., Malesani D., Covino, S., et al., 2009, A&A, 498, 771
- Fontana et al. (2000) Fontana, A., D’Odorico, S., Poli, F., et al. 2000, AJ, 120, 2206
- Gal-Yam et al. (2008) Gal-Yam, A., et al., 2008, ApJ, 686, 408
- Gehrels et al. (2006) Gehrels, N. et al. 2006, Nature, 444, 1044
- Guetta & Stella, (2009) Guetta, D. & Stella, L., 2009, A&A, 498, 329
- Grindlay et al. (2006) Grindlay, J., Portegies Zwart, S., and McMillan, S., 2006, Nature Physics, 2, 116
- Kalberla et al. (2005) Kalberla, P.M.W., Burton, W.B., Hartmann, D., et al. 2005, A&A, 440, 775
- Kouveliotou et al. (1993) Kouveliotou, C., Meegan, C. A., Fishman, G. J., et al., 1993, ApJ, 413, L101.
- Krimm et al. (2004) Krimm, H.A. 2004, BAT Ground Analysis Software Manual
- Levesque et al. (2009a) Levesque, E., et al., 2009, GCN Circular, 9264
- Levesque et al. (2009b) Levesque, E., et al., 2009, MNRAS, submitted (arXiv:0907.1661)
- Mao et al. (2009) Mao, J., Cha, G., Bai, J., 2009, GCN Circular, 9285
- Nakar (2007) Nakar, E., 2007, Phys. Rev., 442, 166
- Norris et al. (2000) Norris, J. P., Marani, G. F., and Bonnell, J. T., 2000, ApJ, 534, 248
- Oates et al. (2009) Oates, S.R., et al., 2009, GCN Circulars, 9265
- Olivares et al. (2009) Olivares, F., et al 2009, GCN Circular, 9268
- Osborne et al. (2009) Osborne, J.P., et al., 2009, GCN Circulars, 9259
- Perna & Belczynski (2002) Perna, R. & Belczynski, K. 2002, ApJ, 570, 252.
- Piranomonte et al. (2008) Piranomonte, S., D’Avanzo, P., Covino, S., et al., 2008, A&A, 491, 183
- Sakamoto et al. (2009) Sakamoto, T., Sato, G., Barbier, L. et al., 2009, ApJ, 693, 922
- Schegel et al. (1998) Schlegel, D.J., Finkbeiner, D.P., & Davies, M. 1998, ApJ, 500, 525
- Stratta et al., (2007) Stratta, G., D’Avanzo, P., Piranomonte, S., et al., 2007, A&A, 474, 827
- Thöne et al. (2009) Thöne C., et al. 2009, GCN Circular, 9269
- Ukwatta et al. (2009) Ukwatta, T.N., et al. 2009, GCN Circular, 9272
- Xin et al. (2009) Xin, L.P., et al. 2009, GCN Circular, 9255
- (36) Yoshida, M., et al 2009a, GCN Circular, 9266
- (37) Yoshida, M., et al 2009b, GCN Circular, 9267
- Woosley & Bloom, (2006) Woosley, S.E. & Bloom, J.S., 2006, ARA&A, 44, 507
The calibration of TNG data was performed using Landolt standard stars. The calibration of LBT was done against the SLOAN catalogue. Errors and upper limits are given at confidence level. Mean time Exposure time Time since GRB Seeing Instrument Magnitude Filter Comments (UT) (s) (days) (″) Grism 2009 Apr 26.97190 0.43802 1.4 TNG/DOLORES AG detection 2009 Apr 26.97679 0.44291 1.4 TNG/DOLORES AG detection 2009 Apr 26.98818 0.45430 1.4 TNG/DOLORES AG detection 2009 Apr 26.99583 0.46195 1.4 TNG/DOLORES AG detection 2009 Apr 26.98457 0.45069 1.4 TNG/DOLORES AG spectra 2009 May 02.04516 5.51128 1.4 TNG/DOLORES HG detection 2009 May 13.05282 16.51894 1.0 TNG/DOLORES HG detection 2009 May 18.97929 22.44541 1.0 TNG/DOLORES u.l. 2009 May 31.20833 35.67445 0.9 LBT/LBC_blue HG + knot 2009 May 31.21875 35.68487 1.1 LBT/LBC_blue HG + knot 2009 May 31.20833 35.67445 0.7 LBT/LBC_red HG + knot 2009 May 31.21875 35.68487 0.8 LBT/LBC_red HG + knot 2009 May 31.20833 35.67445 0.9 LBT/LBC_blue HG 2009 May 31.21875 35.68487 1.1 LBT/LBC_blue HG 2009 May 31.20833 35.67445 0.7 LBT/LBC_red HG 2009 May 31.21875 35.68487 0.8 LBT/LBC_red HG 2009 May 31.20833 35.67445 0.9 LBT/LBC_blue N-E knot 2009 May 31.21875 35.68487 1.1 LBT/LBC_blue N-E knot 2009 May 31.20833 35.67445 0.7 LBT/LBC_red N-E knot 2009 May 31.21875 35.68487 0.8 LBT/LBC_red N-E knot
| Line | EW | EW |
|---|---|---|
| (Å) | (Å) | |
| Ly- (z=2.61) | 0.8 | 0.3 |
| Ly- (z=2.58) | 2.8 | 0.3 |
| NV | 0.4 | 0.3 |
| SiII | 1.3 | 0.3 |
| SiII | 0.9 | 0.3 |
| CII | 1.3 | 0.3 |
| SiIV | 7.0 | 0.3 |
| CIV | 7.5 | 0.3 |