Searching for Evidence of Energetic Feedback in Distant Galaxies: A Galaxy Wide Outflow in a Ultraluminous Infrared Galaxy
Abstract
Leading models of galaxy formation require large-scale energetic outflows to regulate the growth of distant galaxies and their central black holes. However, current observational support for this hypothesis at high redshift is mostly limited to rare radio galaxies. Here we present Gemini-North NIFS Intregral Field Unit (IFU) observations of the [O iii]5007 emission from a 2 ultraluminous infrared galaxy ( ) with an optically identified Active Galactic Nucleus (AGN). The spatial extent ( 4–8 kpc) of the high velocity and broad [O iii] emission are consistent with that found in radio galaxies, indicating the presence of a large-scale energetic outflow in a galaxy population potentially orders of magnitude more common than distant radio galaxies. The low radio luminosity of this system indicates that radio-bright jets are unlikely to be responsible for driving the outflow. However, the estimated energy input required to produce the large-scale outflow signatures (of order ergs over 30 Myrs) could be delivered by a wind radiatively driven by the AGN and/or supernovae winds from intense star formation. The energy injection required to drive the outflow is comparable to the estimated binding energy of the galaxy spheroid, suggesting that it can have a significant impact on the evolution of the galaxy. We argue that the outflow observed in this system is likely to be comparatively typical of the high-redshift ULIRG population and discuss the implications of these observations for galaxy formation models.
keywords:
galaxies: high-redshift – galaxies: evolution – galaxies: starburst – (galaxies:) quasars: emission lines – galaxies: kinematics and dynamics1 Introduction
The most successful current models of galaxy formation invoke large-scale energetic outflows to explain many of the properties of local massive galaxies and the intragalactic medium (IGM; i.e., red optical colours of massive galaxies, steep optical galaxy luminosity function, the black-hole–spheroid mass relationship, metal-enrichment of the IGM; e.g., Silk & Rees 1998; Fabian 1999; King 2003; Benson et al. 2003; Granato et al. 2004; Di Matteo et al. 2005; Springel et al. 2005; Bower et al. 2006; Croton et al. 2006; Hopkins et al. 2006). A key attribute of these simulated outflows is the injection of significant amounts of kinetic energy into the interstellar medium (ISM), which can inhibit and terminate star formation by either heating the ISM or ejecting the gas out of the gravitational potential of the host galaxy. Large-scale outflows can be powered by star formation and/or Active Galactic Nuclei (AGN) activity (e.g., Heckman et al. 1990; Crenshaw et al. 2003; Veilleux et al. 2005), although most galaxy formation models predict that only AGN-driven outflows will be sufficiently energetic to have significant impact on the formation and evolution of massive galaxies. These large-scale outflows are expected to be particularly effective at 2, when star formation in the most massive galaxies was in significant decline (e.g., Juneau et al. 2005; Panter et al. 2007; Pérez-González et al. 2008; Damen et al. 2009).
Broadly speaking, AGN-driven outflows are kinematically energetic “winds” or “jets” that are initially launched close to the central black hole. The two main catalysts that have been proposed to power an AGN-driven outflow are (1) a radio jet or lobe, and (2) a radiatively driven wind. A radio-jet/lobe driven outflow will be most prevalent in radio-loud AGN but might only occur in a minority of the AGN population.111The typical definition of a radio-loud AGN is / 10 (e.g., Kellerman et al. 1989). For example, 4–24% of the optically bright (radiatively strong) AGN population are radio loud, which appears to be a function of both redshift and AGN luminosity (e.g., Hooper et al. 1995; Jiang et al. 2007), although this may indicate the “duty cycle” of radio AGN activity. The fraction of optically faint (radiatively weak) radio-loud AGN fraction is a strong function of stellar mass (e.g., Best et al. 2005; Smolčić et al. 2009). By comparison, a radiatively driven wind would be most effective in luminous AGNs with high mass-accretion rates, since the wind is directly driven by radiation pressure from the accretion disk.
High signal-to-noise ratio X-ray and ultra-violet absorption-line spectroscopy have shown that high-velocity outflows are present in many AGNs, and may be a ubiqitious property of the AGN population at both low and high redshift (e.g., Crenshaw et al. 1999: Chartas et al. 2002, 2007a,b; Laor & Brandt 2002; Pounds et al. 2003; Reeves et al. 2003; Porquet et al. 2004; Ganguly & Brotherton 2008; Gibson et al. 2009). For example, at least 60% of unobscured AGNs show evidence for high-velocity outflows, and the maximum measured outflow velocity is a strong function of the AGN luminosity (e.g., Crenshaw et al. 1999; Ganguly & Brotherton 2008). The estimated energy injection required to produce the X-ray absorption features (which sometimes suggest outflow velocities exceeding 0.1) is typically 0.1–1 of the AGN bolometric luminosity (e.g., Pounds et al. 2003; Reeves et al. 2003; Chartas et al. 2007a; Pounds & Reeves 2009). However, X-ray variability studies and consideration of the required energy input to produce the high-velocity features, indicate that these outflow signatures must be produced in the vicinity of the accretion disc on 1 pc scales (e.g., Crenshaw et al. 2003; King & Pounds 2003). Therefore, while it is clear that energetic outflows are present close to the accreting black hole of AGNs, it is far from clear what impact these outflows will have on the gas and star formation in the host galaxy on 1–10 kpc scales. To directly test the impact that outflows have on the formation and evolution of galaxies, it is necessary to identify large-scale energetic outflows, particularly in high-redshift () massive galaxies where they are predicted to have been most prevalent.
Optical spectroscopy of distant galaxies have revealed blueshifted absorption/emission lines in many systems, a signature of outflowing gas (e.g., Pettini et al. 2001; Shapley et al. 2003; Tremonti et al. 2007). However, the most direct insight into the identification and interpretation of large-scale outflows is provided by spatially resolved spectroscopy (integral-field unit; IFU observations), which provide direct information about both the velocity and extent of any outflowing gas (e.g., Swinbank et al. 2005, 2006; Nesvadba et al. 2006). Using rest-frame optical IFU observations of distant radio-loud AGNs (i.e., high-redshift radio galaxies, hereafter referred to as HzRGs), Nesvadba et al. (2006, 2007a, 2008) showed that large-scale energetic outflows are present in at least a fraction of the high-redshift galaxy population. The key diagnostic that revealed an AGN-driven outflow in these systems was the presence of kinematically complex and extended [O iii]5007 emission;222Emission from [O iii] can be produced by a number of processes, including photo-ionisation and shocks (Osterbrock 1989) but it cannot be produced in dense environments, such as the broad-line region of AGN, without being collisionally de-excited (e.g., Osterbrock 1989; Robson 1996). The detection of broad (FWHM 500–1000 km-1) [O iii] emission therefore indicates the presence of off-nuclear kinematic components. see Holt et al. (2008) for similar constraints on radio galaxies. Nesvadba et al. (2008) showed that the extent of the broad [O iii] emission is similar to that of the radio emission, providing evidence for a causal connection between the radio emission and a large-scale outflow. The estimated kinetic energy required to drive the outflows in these HzRGs is 1–40% of that potentially provided by the radio jet, indicating that they could be powered by mechanical energy from the radio jet. However, HzRGs are rare systems (co-moving space densities at 2 of – Mpc-3; e.g., Willott et al. 1998), possibly representing the most massive galaxies in the most biased regions of the distant Universe (e.g., Stevens et al. 2003; Seymour et al. 2007). To fully assess the global impact of large-scale energetic outflows on the formation and evolution of distant galaxies, and to distinguish between the different mechanisms proposed to drive outflows, it is therefore necessary to search for large-scale energetic outflows in the more typical radio-quiet AGN population.
In this paper we present Gemini-North NIFS IFU observations of the [O iii] emission from a 2 quasar (SMM J123716.01+620323.3, hereafter referred to as SMM J1237+6203) that is hosted in an Ultraluminous Infrared (IR) Galaxy (ULIRG; ; e.g., Sanders & Mirabel 1996). ULIRGs (both at low and high redshift) are rapidly evolving galaxies undergoing intense dust-obscured star formation and AGN activity (e.g., Sanders & Mirabel 1996; Genzel et al. 1998; Page et al. 2001; Alexander et al. 2005b; Stevens et al. 2005; Schweitzer et al. 2006; Coppin et al. 2008; Lutz et al. 2008; Pope et al. 2008). Ultra-luminous infrared quasars are often believed to be a key phase in the evolution of a ULIRG, where energetic outflows are starting to shut down star formation in the host galaxy, before revealing an unobscured quasar (e.g., Sanders et al. 1988; Canalizo & Stockton 2001; Granato et al. 2004; Hopkins et al. 2005a; Kawakatu et al. 2006). It is possible that every massive galaxy in the local Universe underwent a ULIRG phase at some time over the past 13 Gyrs during which the galaxy spheroid and black hole were predominantly grown (e.g., Swinbank et al. 2006; Alexander et al. 2008; Tacconi et al. 2008). The [O iii] luminosity of SMM J1237+6203 is comparable to the HzRGs studied by Nesvadba et al. (2006, 2007a, 2008), suggesting similar intrinsic AGN luminosities. However, importantly, SMM J1237+6203 is 3–4 orders of magnitude fainter at radio luminosities than the HzRGs. We identify the signatures of a large-scale energetic outflow in this ultraluminous infrared quasar, showing that these features are not restricted to the distant radio-loud AGN population. We estimate the energy input required to produce these features, assess what could be responsible for driving this large-scale outflow, and discuss the implications for galaxy formation models. We have adopted , and ; in this cosmology 1′′ corresponds to 8.5 kpc at .
2 Target, Observations, and Data Reduction
2.1 SMM J1237+6203
The Gemini-North NIFS observations of SMM J1237+6203 are part of an on-going NIFS program to identify large-scale energetic outflows in 2 galaxies bright at submillimetre (submm) wavelengths.333Programmes GN-2008A-Q-58 and GN-2009B-Q-21. The optical position of SMM J1237+6203 is 12h 37m 160, 03 (Barger et al. 2003).
SMM J1237+6203 has a submm flux of S850=5.31.7 mJy (Chapman et al. 2005), is identified with a moderately bright VLA radio counterpart (S1.4=164.011 Jy; Biggs & Ivison 2006), and has an optical spectroscopic redshift of (Barger et al. 2003). The rest-frame 1.4 GHz luminosity ( W Hz-1) suggests a rest-frame far-IR luminosity of , under the assumption of the local radio-far-IR luminosity correlation (Alexander et al. 2005a; e.g., Helou et al. 1985; Condon 1992), identifying SMM J1237+6203 as a ULIRG. The detection of SMM J1237+6203 at submm wavelengths also suggests that it is bolometrically luminous ( ; e.g., Chapman et al. 2005). The strong detection of SMM J1237+6203 in the VLA map (Biggs & Ivison 2006) but the non-detection in a sensitive (root-mean-square noise of 15.6 Jy beam-1) MERLIN map suggests that the radio emission is not dominated by a bright AGN core and is extended on scales of (R. Beswick, priv comm). This provides evidence that the radio luminosity (and therefore the far-IR luminosity) may be dominated by intense star-formation activity ( 1000 yr-1; calculated following Eqn. 4 in Kennicutt 1998 using the radio-derived far-IR luminosity).
The optical counterpart of SMM J1237+6203 is bright () and optical–near-IR spectroscopy reveals the rest-frame UV–optical broad emission lines expected from a quasar (i.e., Ly; Nv; Civ; H–H with FWHM 2100–2700 km s-1; Chapman et al. 2005; Takata et al. 2006; Coppin et al. 2008). Deep Chandra observations reveal that SMM J1237+6203 is luminous ( erg s-1) and possibly obscured ( cm-2) in the X-ray band (Alexander et al. 2005a). The apparently contradictory evidence of both luminous broad emission lines and X-ray absorption imply that either the X-ray source and the broad-line gas are not co-spatial or that the X-ray absorption is due to an ionised outflowing wind (e.g., Crenshaw et al. 2003); the latter would provide direct evidence for an AGN-driven outflow in the central regions, although higher signal-to-noise ratio data is required for confirmation. On the basis of the X-ray luminosity, the bolometric output of SMM J1237+6203 appears to be dominated by star-formation activity (Alexander et al. 2005a), which is consistent with the bright submm flux and the probable extended radio emission. However, we caution that we do not have unambiguous evidence for star-formation activity in SMM J1237+6203; high signal-to-noise ratio spectroscopy would provide more direct evidence (e.g., the detection of CO molecular gas or low-excitation star-formation emission lines/broad-band features in mid-IR–mm spectroscopy). Low-resolution Subaru OHS spectroscopy shows that SMM J1237+6203 has luminous, broad, and extended [O iii] emission (Takata et al. 2006), providing evidence for the presence of a large-scale outflow.
2.2 Gemini-North NIFS Observations
The NIFS IFU uses an image slicer to take a field with a pixel scale of and divides it into 29 slices of width . The dispersed spectra from the slices are reformatted on the detector to provide 2-dimensional spectro-imaging. For our observations we used the -band grism at a spectral resolution of 5290 ( 3Å; 25 km s-1). They were taken on 2008 May 22 and 2008 May 30 in excellent photometric conditions with seeing. The observations were performed using the standard ABBA configuration in which we chopped by 6′′ to blank sky to achieve good sky subtraction. Individual exposures were 600 s and the integrated exposure time was 15.6 ks (7.8 ks on-source and 7.8 ks on-sky).
We reduced the data with the Gemini iraf nifs pipeline, following the approach outlined in Swinbank et al. (2009). The data-reduction steps included sky subtraction, wavelength calibration, and flat fielding. We removed residual OH sky emission using the sky-subtraction routine described in Davies et al. (2007). To accurately align and and mosaic the individual datacubes, we created white light (wavelength collapsed) images around the redshifted [O iii] line from each observing block and centroided the galaxy in the data cube. The data cubes were spatially aligned and co-added to create the final mosaic using a median with a 3 clipping threshold to remove remaining cosmetic defects and cosmic rays. Flux calibration was carried out by observing standard stars at similar airmass to the target galaxies, which were reduced in an identical manner to the targets. Since the [O iii] emission lines lie in regions of % sky transparancy, no corrections were required for telluric absorption. In all following sections, quoted line widths are deconvolved for the instrumental resolution.
2.3 Emission-line Fitting
We first constructed intensity and velocity maps of the [O iii] emission from the IFU data cube. We used a minimisation procedure to fit each spectrum within the datacube, taking into account the greater noise at the positions of the sky lines. The spectra were averaged over a spatial pixel (), increasing to 55 pixels and ultimately to 77 pixels if the signal was too low to give a sufficiently high improvement over a fit without the line. In regions where this averaging process still failed to give an adequate , no fit was made. To detect an emission line we required a ( ) improvement in a continuum+emission-line fit over a simple continuum fit. When this criterion is met we fit the [O iii] emission line with a single Gaussian profile, allowing the normalisation, width and central wavelength to vary.
Since both broad and narrow [O iii] emission-line components are seen in the collapsed one-dimensional spectrum (see Fig. 1), we also produced spatially binned spectra in 10 discrete regions to search for the presence of broad [O iii] emission. For these integrated spectra we fit both a single and double Gaussian profile emission line but only accepted the fit if the double Gaussian profile resulted in a significantly better fit than a single Gaussian profile ( improvement; ). We present the emission-line fitting results in Table 1.
3 Results
SMM J1237+6203 [O iii]5007 Emission-Line Constraints
| Region | Ncomp | (narrow) | Flux (narrow) | FWHM (narrow) | (broad) | Flux (broad) | FWHM (broad) | (broad) | |
|---|---|---|---|---|---|---|---|---|---|
| ( erg cm-2 s-1) | (km s-1) | ( erg cm-2 s-1) | (km s-1) | (km s-1) | |||||
| 0 | 1 | 4 | 2.0747[2] | 0.22[3] | 16035 | - | - | - | - |
| 1 | 1 | 6 | 2.0751[2] | 0.46[2] | 16535 | - | - | - | - |
| 2 | 1 | 3 | 2.0746[5] | 0.23[3] | 24447 | - | - | - | |
| 3 | 2 | 45 | 2.0748[2] | 0.66[5] | 18140 | 2.0721[15] | 0.42[6] | 630181 | 293145 |
| 4 | 2 | 150 | 2.0752[2] | 0.95[10] | 21247 | 2.0719[16] | 1.28[18] | 935212 | 312150 |
| 5 | 2 | 17 | 2.0760[3] | 0.41[5] | 13249 | 2.0751[7] | 0.41[6] | 36456 | 067 |
| 6 | 2 | 45 | 2.0751[5] | 0.25[7] | 13233 | 2.0740[12] | 0.58[5] | 46885 | 107116 |
| 7 | 2 | 50 | 2.0750[4] | 0.51[7] | 20942 | 2.0728[10] | 0.62[8] | 627129 | 22496 |
| 8 | 1 | 2 | 2.0750[4] | 0.22[3] | 29671 | - | - | - | - |
| 9 | 1 | 3 | 2.0752[5] | 0.28[2] | 27566 | - | - | - | - |
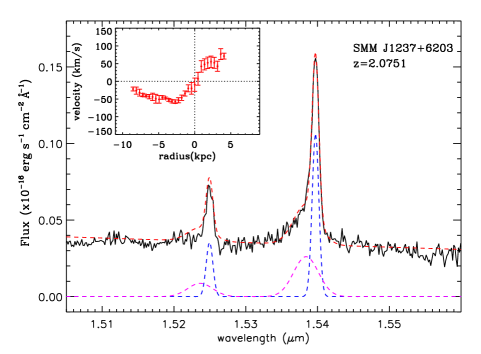
The collapsed one-dimensional integrated NIFS spectrum clearly shows strong [O iii]4959,5007 emission; see Fig. 1. The [O iii]5007 emission line has a blue asymmetric profile, which is fitted with two underlying Gaussian profiles (the line morphology is also displayed in the weaker [O iii]4959 emission line). The narrow component of the [O iii]5007 emission is centered at a redshift of = 2.07510.0001 (hereafter defined as the systemic redshift) with a width of FWHM = 21228 km s-1. The broad [O iii] emission-line component is centered at = 2.07250.0003 ( = –25460 km s-1 from the narrow component) and has a width of FWHM = 823118 km s-1. Forty five percent of the [O iii]5007 emission is from the broad component, with an observed luminosity of = (1.10.2) erg s-1; the observed narrow [O iii] luminosity is = (1.40.2) erg s-1. The broad [O iii] luminosity of SMM J1237+6203 is comparable to the HzRGs studied by Nesvadba et al. (2006, 2007a, 2008; [1–8] erg s-1).
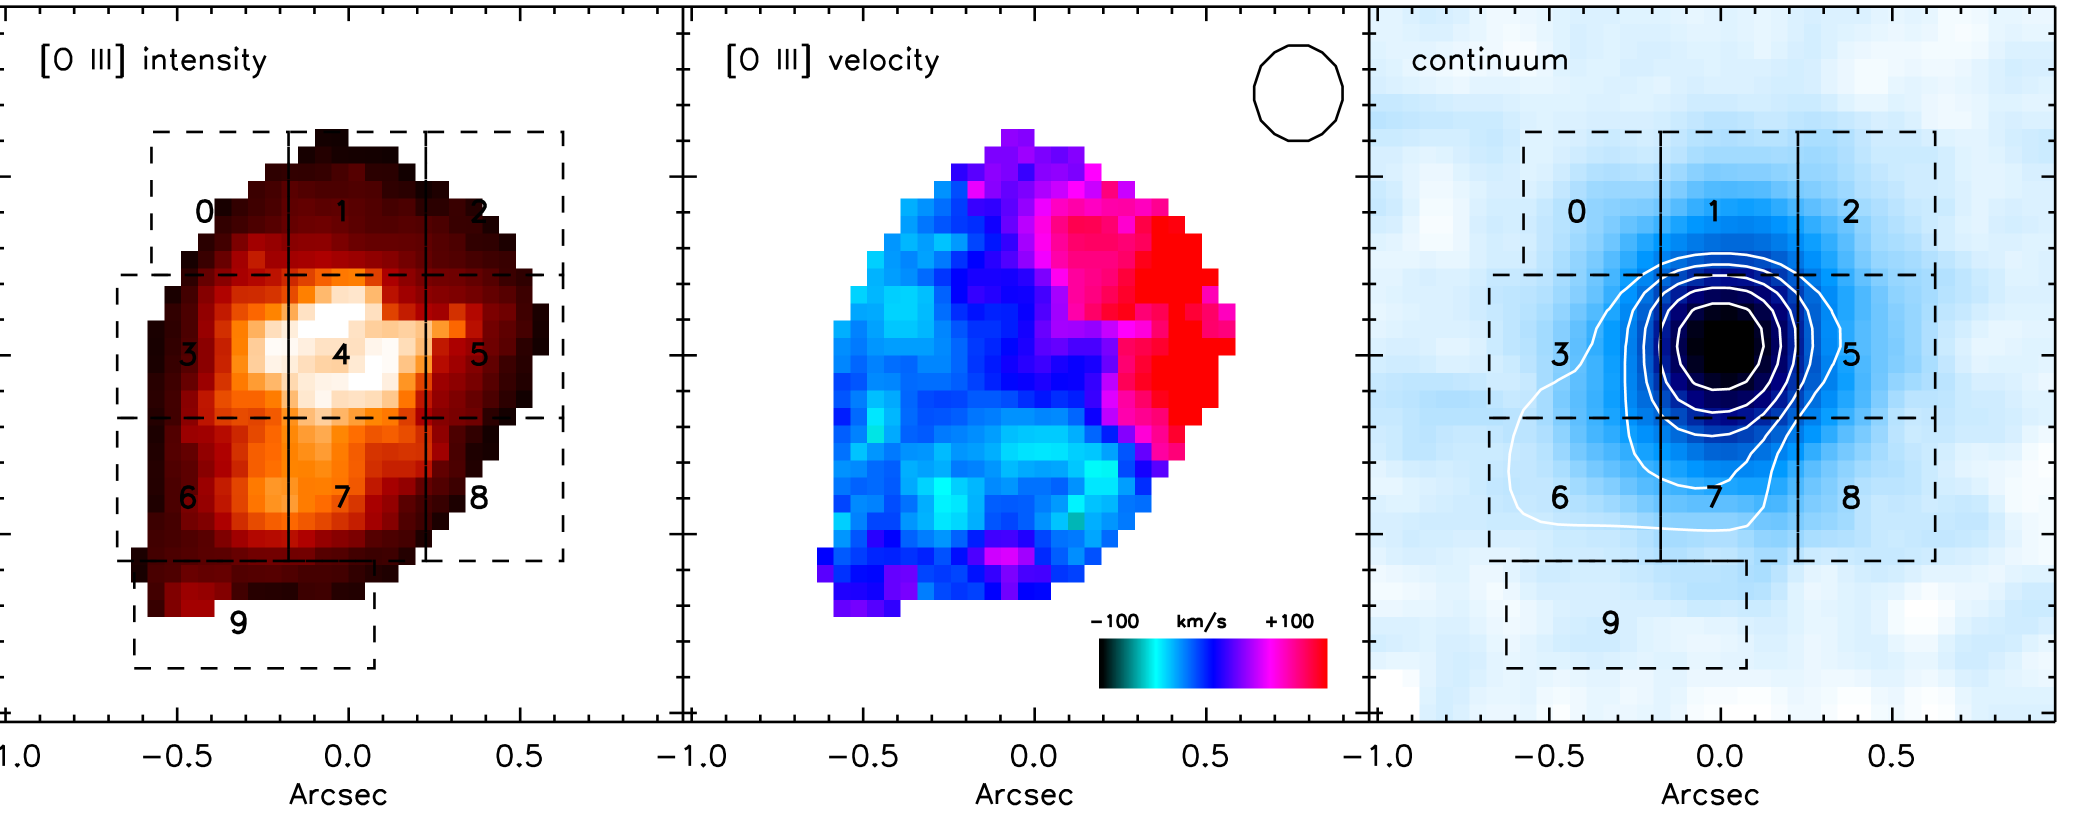
In Fig. 2 we show the [O iii] intensity, narrow [O iii] velocity (measured with respect to the systemic redshift), and line-free optical continuum of SMM J1237+6203, measured from the NIFS data cube. The [O iii] emission is strongly peaked and co-spatial with the optical continuum peak, as would be expected for an optically luminous AGN. However, there is also a bright spatially extended narrow velocity component (; 14 kpc). The velocity map shows a strong gradient with a peak-to-peak shift of 15035 km s-1, with the highest and lowest velocity gas to the South-East and North-West of the Nucleus, respectively; see inset plot in Fig. 1. If it is assumed that the velocity gradient of the [O iii] emission is due to host-galaxy rotation then the dynamical mass estimated from the velocity curve is M⊙ for a canonical inclination of , but could be as high as M⊙ for an inclination angle of (which is not potentially unreasonable given that this object is a quasar and therefore likely to be seen close to face on). However, due to potential complexities from dust extinction and broad [O iii] components, it is not clear that the [O iii] velocity field is dominated by galaxy rotation; see Lehnert et al. (2009) for other complications. By comparison, the spheroid mass estimated from the velocity dispersion of the narrow [O iii] emission ( 200 km s-1; see also Table 1) is of order M⊙ (calculated following Eqn. 1 of Erb et al. 2006 assuming ), which is consistent with that expected from the estimated black-hole mass ( ; Alexander et al. 2008) given the local black-hole–spheroid mass relationship (e.g., Tremaine et al. 2002; Marconi & Hunt 2003).
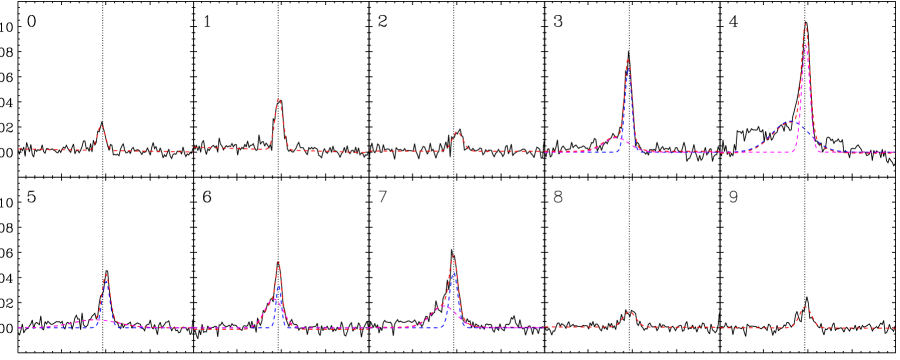
In Fig. 3 we show the [O iii] emission-line profile in the integrated spectra from the ten discrete regions (labelled 0-9 in Fig. 2). The [O iii] emission is evidently kinematically complex in many of the regions across the galaxy. A broad (FWHM 400–900 km s-1) [O iii] component is identified in five ( 50%) of the regions. The radial extent of the broad [O iii] emission with respect to the narrow [O iii] emission is shown in Fig. 2 and Fig. 4. Four of the broad components (the exception is region 5, which has the lowest ) have a velocity offset ( km s-1) with respect to the systemic redshift of SMM J1237+6203 and, interestingly, these regions are spatially coherent (over 4–8 kpc) and are located to the South East of the nucleus; see Fig. 2. The presence of extended, high-velocity broad [O iii] emission indicates a large-scale outflow, due either to AGN and/or starburst activity. The lack of broad [O iii] components to the North-West region of the nucleus could be due to extinction by the host galaxy, which may be expected if the outflow was driven by the AGN activity (i.e., the far side of the outflow would be obscured by the host galaxy). However, higher spatial resolution and signal-to-noise ratio data is required to provide more definitive spatial constraints.
4 Discussion
The Gemini-North NIFS observations of SMM J1237+6203 show high-velocity (up-to 300 km s-1), broad (up-to 900 km s-1), large-scale ( 4–8 kpc) [O iii] emission. The [O iii] properties of SMM J1237+6203 are consistent with those found for the HzRGs investigated by Nesvadba et al. (2006, 2007a, 2008) and indicate the presence of an energetic large-scale outflow in SMM J1237+6203. However, since SMM J1237+6203 is 3–4 orders of magnitude fainter at radio wavelengths than HzRGs, it is unlikely that the catalyst for this outflow is a radio jet.
SMM J1237+6203 is the first high-redshift ULIRG with spatially extended broad [O iii] emission to be mapped with IFU observations. Previous IFU studies of high-redshift ULIRGs have typically focused on the Ly or H emission line, and the majority of the objects observed have not shown evidence for AGN activity at optical wavelengths (e.g., Bower et al. 2004; Wilman et al. 2005; Swinbank et al. 2005, 2006; Nesvadba et al. 2007b). However, three pieces of indirect evidence suggest that SMM J1237+6203 could be relatively typical of the high-redshift ULIRG population: (1) broad [O iii] emission-line components have been identified with rest-frame optical spectroscopy in several high-redshift ULIRGs to date (e.g., Smail et al. 2003; Takata et al. 2006; Coppin et al. 2008), (2) 50% of nearby ULIRGs hosting optical AGN activity have [O iii] components with FWHM 800 km s-1, comparable to that found for SMM J1237+6203 (e.g., Veilleux et al. 1999; Zheng et al. 2002; see also Spoon & Holt 2009 for similar mid-IR spectral constraints), and (3) high-quality IFU data have been published for a number of nearby ULIRGs showing that they host broad and extended [O iii], providing evidence for large-scale energetic outflows in at least some ULIRGs in the local Universe (e.g., Colina et al. 1999; Wilman et al. 1999; Lípari et al. 2009a,b).
In this section we explore the properties of the large-scale outflow in SMM J1237+6203 in more detail by, first, estimating the energy input required to produce the observed outflow features (see §4.1) and, second, exploring what proceses could deliver sufficient energy to drive the outflow (see §4.2). Lastly, we consider the potential fate of the outflowing gas and briefly discuss the implications of our observations for galaxy formation models (see §4.3).
4.1 The Properties of the Large-Scale Outflow
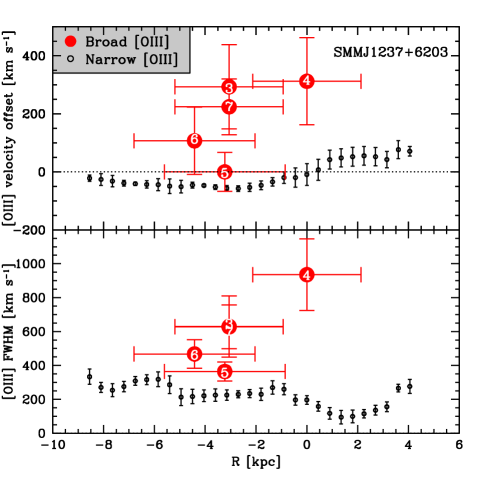
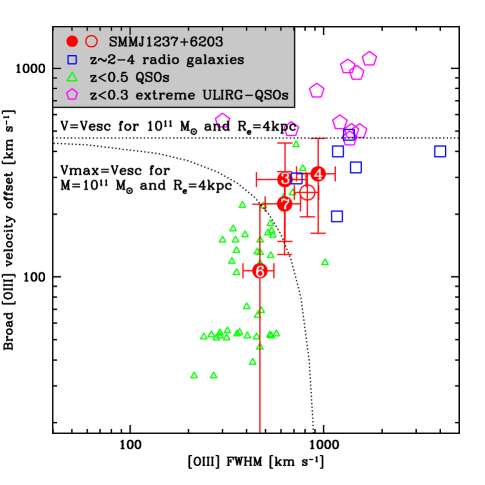
In Fig. 5 we plot the velocity offset and FWHM of the broad [O iii] emission for SMM J1237+6203 and compare it to HzRGs and samples of quasars. We have not corrected the widths and velocities of the [O iii] emission-line gas for unknown projection effects and dust extinction, and therefore they should be considered lower limits. There appears to be a loose correlation between the width of the [O iii] emission and the [O iii] velocity offset, which would be expected for outflowing gas that becomes turbulent as the kinetic energy is dissipated through shocks into the ISM (e.g., Lehnert & Heckman 1996); however, we caution that this is unlikely to be the only possible interpretation. This figure shows that SMM J1237+6203 has [O iii] properties broadly similar to those of the HzRGs, with the exception of the most extreme source (PKS 1138-262) which has very broad [O iii]; however, we have only plotted the integrated [O iii] properties for the HzRGs here and note that the widths and velocity offsets of spatially distinct regions are often higher. This figure also shows that the integrated [O iii] properties of SMM J1237+6203 are (1) not as extreme as some nearby ultraluminous infrared quasars, and (2) are more extreme than the majority of nearby quasars; indeed, only an extreme subset of the rare Narrow Line Seyfert 1 population (NLS1) are found to host [O iii] properties similar to SMM J1237+6203 (e.g., on the basis of Komossa et al. 2008, only 5–10% of NLS1s have high-velocity [ km s-1] broad [O iii]). This further suggests that the origin of the outflow features in SMM J1237+6203 are coupled to the production of the infrared emission, which we explore in more detail in §4.2. However, we stress that the [O iii] properties for the quasar samples are from long-slit spectroscopy and provide limited constraints on the spatial extent of these potential outflows.
The extent of the broad [Oiii] emission-line gas from SMM J1237+6203 is comparable to that found for the HzRGs studied by Nesvadba et al. (2006, 2007a, 2008), which typically range from 4–20 kpc, suggesting comparable overall energetics given the similar widths and velocities of the broad [O iii] emission. Assuming that the broad [O iii] properties are due to an energy-conserving bubble expanding into a uniform medium (see Eqn. 3 in Nesvadba et al. 2006), we can place first-order constraints on the kinetic energy required to accelerate the broad [O iii] emission-line gas to these velocities over large distances. For example, the estimated kinetic energy required to accelerate the broad [O iii] emission to 300 km s-1 over 4–8 kpc (the estimated size of the broad [O iii] emission; see Fig. 2) is of order (0.6–3) erg s-1 for SMM J1237+6203, which should be compared to (0.3–100) erg s-1 for the HzRGs; in this calculation we assumed the same ambient density as that estimated for the HzRGs by Nesvadba et al. (2008) since we do not have direct constraints for SMM J1237+6203.
Over a canonical 30 Myr quasar lifetime (e.g., Martini & Weinberg 2001; Hopkins et al. 2005b), the total injection of energy into the outflow would be of order (0.3–3) ergs, which is comparable to the estimated binding energy of the galaxy spheroid in SMM J1237+6203; for example, based on an estimated spheroid mass of and velocity dispersion of km s-1 (see §3), the estimated binding energy is ergs for kpc (e.g., Binney & Tremaine 1987). This analysis is based on a simple model and should only be considered illustrative with uncertainties at the level of an order of magnitude but, given the limited constraints current available for high-redshift systems, a more complex model is not yet warranted. However, it does indicate that the large-scale outflow in SMM J1237+6203 may be energetic enough to unbind at least a fraction of the ISM from the host galaxy.
4.2 The Potential Power Sources of the Large-Scale Outflow
On the basis of a comprehensive analysis of the broad [O iii] properties of HzRGs, Nesvadba et al. (2006, 2007a, 2008) argued that the outflows observed in HzRGs are most likely powered by radio jets, which can potentially inject of order erg s-1 of mechanical energy into the ISM (although this calculation is dependent on the assumed radio luminosity to kinetic jet-power ratio). The kinematics, extent, and luminosities of the broad [O iii] emission from SMM J1237+6203 are comparable to those of the HzRGs. However, since the 1.4 GHz radio luminosity of SMM J1237+6203 is 3–4 orders of magnitude lower than that found for the HzRGs, this strongly suggests that mechanical energy from a radio jet is not the catalyst for the broad [O iii] emission seen in SMM J1237+6203. For example, taking the same assumptions as those used in Nesvadba et al. (2006), we predict the mechanical energy from a radio jet in SMM J1237+6203 to be of order erg s-1, which is two orders of magnitude below the required energy input to produce the observed broad [O iii] features, even assuming a 100% energy–ISM coupling efficiency. This estimate of the radio-jet mechanical energy is also likely to be an upper limit since it is possible that a large, possibly dominant, fraction of the radio emission from SMM J1237+6203 is due to star formation rather than AGN activity (see §2.1). However, could the high-velocity, broad, large-scale [O iii] emission from SMM J1237+6203 be powered by an outflow from a radiatively driven AGN wind or, given the indirect evidence for star-formation activity (see §2.1), supernova winds associated with an intense starburst?
Estimating the potential impact of an radiatively driven AGN wind on the ISM is difficult due to the huge difference in size scale between the likely pc ejection radius of the wind and the large-scale ( kpc) galactic enviroment. However, given the constraints from high signal-to-noise ratio X-ray spectroscopy for a number of AGNs to date (see §1), it seems likely that a significant fraction of the bolometric luminosity from the AGN will drive an outflow close to the accretion disk, which at least provides a first-order constraint on the initial energy injection. Given the low signal-to-noise ratio of the X-ray spectra for SMM J1237+6203, we cannot directly identify the X-ray signatures of a high-velocity outflow in these data. However, we note that on the basis of high signal-to-noise ratio X-ray spectral analyses of the gravitationally lensed ultraluminous infrared quasar APM 08279+5255 (potentially a higher-redshift analog of SMM J1237+6203), we may expect 0.1 of the AGN bolometric luminosity of SMM J1237+6203 to be injected into an outflow (e.g., Chartas et al. 2007a; see also Chartas et al. 2007b for similar X-ray spectral constraints on another distant ultraluminous infrared quasar); this energy injection fraction is also similar to that typically assumed in theoretical simulations (e.g., Wyithe & Loeb 2003; Di Matteo et al. 2005). The total bolometric luminosity of SMM J1237+6203 is erg s-1, although a significant fraction of this emission may be due to star-formation activity; see §2.1. A more conservative constraint on the AGN bolometric luminosity is erg s-1, based on the rest-frame 2–10 keV luminosity and the average spectral energy distribution for quasars from Elvis et al. (1994). The initial energy input into the accretion-disk wind is therefore likely to be (0.3–3) erg s-1, which would correspond to a total energy injection over a 30 Myr quasar lifetime of (0.3–3) ergs. Therefore, so long as 10–100% of the energy from the wind can couple to the large-scale ISM gas, then the quasar can drive the outflow to 8 kpc (the maximum extent; see Fig. 2); the wind–ISM gas coupling efficiency drops to 2–20% to drive the outflow to 4 kpc (the minimum extent; see Fig. 2). These wind–gas coupling efficiencies are plausible given the likely large solid angle of radiatively driven AGN winds (e.g., Proga et al. 2000; King & Pounds 2003; Ohsuga et al. 2009).
The dominant source of energy injection from intense star-formation activity is supernovae winds. Dalla Vecchia & Schaye (2008) estimate the energy input from supernovae to be erg , under the assumption of a Salpeter initial mass function. Assuming a constant star-formation rate of 1000 yr-1 (see §2.1), the energy injection into the host galaxy from supernovae winds would be erg s-1. This suggests that the large-scale energetic outflow observed in SMM J1237+6203 could be powered by intense star-formation activity so long as 20–100% of the injected supernovae energy can be coupled to the ISM (the range in wind-gas coupling fractions correspond to the range in [O iii] extent of 4–8 kpc; see Fig. 2). Given that the energy injection from supernovae will be more widespread than that from the AGN (i.e., potentially over kpc scales rather than pc scales), such a large coupling fraction may not be unreasonable (e.g., Weaver et al. 1977). Furthermore, our calculation of the required energy to produce the broad [O iii] features was based on the assumption that the outflow needed to be driven over 4–8 kpc scales, when the distance could be substantially lower if the star-formation activity is widespread. For example, the energy injection required to produce the broad [O iii] features over 1–2 kpc scales is about an order of magnitude lower than that required to produce the broad [O iii] features over 4–8 kpc scales, which would give similar coupling fractions as those found in nearby starburst-dominated ULIRGs (e.g., Martin 2006). This suggests that even if the star formation in SMM J1237+6203 is lower than that assumed here then it is still possible to produce the broad [O iii] features so long as the supernova winds can efficiently couple to the ISM.
Both an AGN-powered and star-formation-powered wind are plausible candidates for driving the large-scale outflow in SMM J1237+6203, and on the basis of our current constraints we cannot directly tell which process dominates. As mentioned above, broad [O iii] components with FWHM 800 km s-1 are detected in 50% of nearby ULIRGs hosting optical AGN activity (e.g., Veilleux et al. 1999; Zheng et al. 2002) while, by comparison, no nearby ULIRGs optically classified as HII galaxies or LINERs are found to host broad [O iii] emission. This would seem to suggest that the production of broad [O iii] is related to AGN activity. However, since [O iii] emission is easily photoionised by AGN activity, the detection of broad [O iii] components in optically identified AGNs could be a sensitivity/selection effect (i.e., the AGN may just be more effective at illuminating the outflowing gas that is potentially present in all ULIRGs). Indeed, optical spectroscopy of the Na ID absorption line has shown that 50% of ULIRGs host outflowing neutral gas, irregardless of the optical spectral type (i.e., HII, LINER, Seyfert classification), indicating that star-formation activity may often be responsible for gaseous outflows in ULIRGs (e.g., Martin 2005; Rupke et al. 2005a,b). It is therefore also interesting that typical quasars (i.e., those that are not infrared bright) rarely show such broad [O iii] features (e.g., Boroson et al. 2005; Komossa et al. 2008; see Fig. 5), which may reflect either an absence of intense star-formation activity or different evolutionary stages (i.e., an ultraluminous infrared quasar may be an earlier phase associated with energetic outflows; see §1). However, all of the evidence presented here is indirect and sensitive IFU observations of larger samples of distant ULIRGs, AGNs, and star-forming galaxies are required to provide more direct constraints.
4.3 The Potential Fate of the Outflowing Gas
A crucial feature of large-scale energetic outflows in galaxy formation models is the potential to eject gas from the host galaxy. Although we have shown that the energy input from both AGN and star-formation activity is potentially large enough to drive the large-scale outflow and unbind the ISM, we have not investigated whether the gas can be ejected from the host galaxy. Murray et al. (2005) show that a significant fraction of the ISM can only be expelled from the host galaxy if the energy injection exceeds a limiting luminosity, which is a function of the gas-mass fraction and the galaxy gravitational potential (this limiting luminosity is analogous to the Eddington limit for the galaxy; see Eqn. 18 in Murray et al. 2005). We do not have an accurate constraint on the mass of the cold-molecular ISM gas in SMM J1237+6203; however, if SMM J1237+6203 is similar to typical submillimetre-emitting galaxies then the moleculear gas mass would be of order – (e.g., Greve et al. 2005), which gives a gas-mass fraction 0.1–1.0. Assuming = 200 km s-1 and a gas-mass fraction of 0.1–1.0, the limiting luminosity for SMM J1237+6203 is (0.8–7.8) , which is comparable to or larger than the total bolometric luminosity. Therefore, on the basis of this analysis, it seems unlikely that the majority of the ISM in SMM J1237+6203 will be expelled from the host galaxy. The velocities of the broad [O iii] emission are also in broad agreement with this analysis, showing that while in some of the regions, the typical velocities of the gas are more modest (); see Fig. 5. In this respect, SMM J1237+6203 is similar to nearby starburst galaxies, which have maximum outflowing gas velocities within a tight range between the circular velocity and escape velocity of the host galaxy (e.g., Martin 2005).
We therefore find that SMM J1237+6203 is driving a large-scale energetic outflow that is disrupting the ISM and could potentially shut down star formation in the host galaxy, in qualitative agreement with predictions from models of the rapid growth phase of galaxies and their central black holes (e.g., Granato et al. 2004; Di Matteo et al. 2005; Hopkins et al. 2006). If SMM J1237+6203 represents a typical ULIRG phase that all massive galaxies have undergone at some time over the past 13 Gyrs, then this outflow activity is potentially 2–3 orders of magnitude more common than that found in HzRGs (i.e., the comoving space density of 2 submm-bright galaxies is Mpc-3 to be compared to – Mpc-3 for 2 HzRGs; Willott et al. 1998; Chapman et al. 2005; Swinbank et al. 2006). Indeed, we have identified high signal-to-noise broad [O iii] components in all of the three high-redshift ULIRGs observed in our on-going Gemini NIFS programs so far. It is therefore likely that the dominant outflow mechanism in distant galaxies is that found in SMM J1237+6203 (either AGN accretion-disk or supernovae winds) rather than radio-jet induced AGN activity. However, since the outflow observed in SMM J1237+6203 requires significant gas accretion to drive either an AGN or supernova wind, once the quasar and star-formation activity has terminated the outflowing gas will cool, which will initiate further star formation. Therefore, unless the gas entropy in the system has become so high that the gas-cooling timescales are Gyr (e.g., I. McCarthy et al. in prep), it seems likely that another process (e.g., a radiatively weak radio-loud AGN as is commonly seen in nearby massive galaxies; Best et al. 2005, 2006) is required to keep the gas unbound and to prevent further star formation from occuring on comparatively short timescales.
5 Conclusions
We have presented Gemini-North NIFS IFU observations of the [O iii]5007 emission in a 2 ultraluminous infrared galaxy hosting an optically identified AGN (SMM J1237+6203). Our main findings are the following:
-
•
The spatial extent ( 4–8 kpc) of the high velocity (up-to 300 km s-1) and broad (up-to 900 km s-1) [O iii] emission is consistent with that found in radio galaxies, suggesting the presence of a large-scale energetic outflow in a galaxy population potentially orders of magnitude more common than radio galaxies. See §3, §4.1, & §4.3.
-
•
The estimated energy required to produce these large-scale outflow features ( [0.6–3] erg s-1) could be provided by a wind radiatively driven by the quasar ( [0.3–3] erg s-1) and/or supernovae winds from intense star formation ( erg s-1), so long as the wind-gas coupling efficiencies are comparatively high (of order 10–100%). However, the low radio luminosity of this system indicates that radio-bright jets are unlikely to be responsible for driving the outflow, in contrast to radio galaxies. See §4.1 and §4.2.
-
•
The estimated energy injection required to drive the large-scale outflow is comparable to the estimated binding energy of the galaxy spheroid in SMM J1237+6203, suggesting that the outflow can have a significant impact on the evolution of the galaxy. However, on the basis of the maximum energy input into the outflow and the measured outflow velocities, it seems unlikely that the majority of the ISM will be expelled from the host galaxy. This may mean that another process (or longer lived AGN activity) is required to keep the gas unbound and prevent future star formation from occuring. See §4.3.
Finally, we conclude that SMM J1237+6203 is the first high-redshift ULIRG with spatially extended broad [O III] emission to be mapped with IFU observations, revealing the signatures expected for a large-scale energetic outflow. However, since 50% of nearby ULIRGs hosting optical AGN activity also have broad [O iii] emission, we expect SMM J1237+6203 to be comparatively typical of the high-redshift ULIRG population. High signal-to-noise ratio (and high spatial resolution) IFU observations of further high-redshift ULIRGs will provide more definitive constraints.
acknowledgments
We gratefully acknowledge support from the Royal Society (DMA), the Leverhulme Trust (DMA), the Royal Astronomical Society (AMS), and the Science and Technology Facilities Council (STFC; IRS). We thank the anonymous referee for a detailed reading of the paper. We also thank Rick Davies for proving his sky-subtraction code, Bob Beswick and Rob Ivison for providing interpretation of the high-resolution MERLIN radio data, David Rupke for providing spectrocopic data on local ULIRGs, and Richard Bower for interesting discussions. This paper was based on observations obtained at the Gemini Observatory, which is operated by the Association of Universities for Research in Astronomy, Inc., under a cooperative agreement with the National Science Foundation (NSF) on behalf of the Gemini partnership: the NSF (United States), the STFC (United Kingdom), the National Research Council (Canada), CONICYT (Chile), the Australian Research Council (Australia), Ministério da Ciência e Tecnologia (Brazil) and SECYT (Argentina).
References
- (1) Alexander, D. M., Bauer, F. E., Chapman, S. C., Smail, I., Blain, A. W., Brandt, W. N., & Ivison, R. J. 2005a, ApJ, 632, 736
- (2) Alexander, D. M., Smail, I., Bauer, F. E., Chapman, S. C., Blain, A. W., Brandt, W. N., & Ivison, R. J. 2005b, Nature, 434, 738
- Alexander et al. (2008) Alexander, D. M., et al. 2008, AJ, 135, 1968
- Barger et al. (2003) Barger, A. J., et al. 2003, AJ, 126, 632
- Benson et al. (2003) Benson, A. J., Bower, R. G., Frenk, C. S., Lacey, C. G., Baugh, C. M., & Cole, S. 2003, ApJ, 599, 38
- Best et al. (2005) Best, P. N., Kauffmann, G., Heckman, T. M., Brinchmann, J., Charlot, S., Ivezić, Ž., & White, S. D. M. 2005, MNRAS, 362, 25
- Best et al. (2006) Best, P. N., Kaiser, C. R., Heckman, T. M., & Kauffmann, G. 2006, MNRAS, 368, L67
- Biggs & Ivison (2006) Biggs, A. D., & Ivison, R. J. 2006, MNRAS, 371, 963
- Binney & Tremaine (1987) Binney, J., & Tremaine, S. 1987, Princeton, NJ, Princeton University Press, 1987, 747 p.,
- Boroson (2005) Boroson, T. 2005, AJ, 130, 381
- Bower et al. (2004) Bower, R. G., et al. 2004, MNRAS, 351, 63
- Bower et al. (2006) Bower, R. G., Benson, A. J., Malbon, R., Helly, J. C., Frenk, C. S., Baugh, C. M., Cole, S., & Lacey, C. G. 2006, MNRAS, 370, 645
- Canalizo & Stockton (2001) Canalizo, G., & Stockton, A. 2001, ApJ, 555, 719
- (14) Chapman, S. C., Blain, A. W., Smail, I., & Ivison, R. J. 2005, ApJ, 622, 772
- Chartas et al. (2002) Chartas, G., Brandt, W. N., Gallagher, S. C., & Garmire, G. P. 2002, ApJ, 579, 169
- Chartas et al. (2007) Chartas, G., Brandt, W. N., Gallagher, S. C., & Proga, D. 2007a, AJ, 133, 1849
- Chartas et al. (2007) Chartas, G., Eracleous, M., Dai, X., Agol, E., & Gallagher, S. 2007b, ApJ, 661, 678
- Colina et al. (1999) Colina, L., Arribas, S., & Borne, K. D. 1999, ApJL, 527, L13
- Condon (1992) Condon, J. J. 1992, ARAA, 30, 575
- Coppin et al. (2008) Coppin, K. E. K., et al. 2008, MNRAS, 389, 45
- Crenshaw et al. (1999) Crenshaw, D. M., Kraemer, S. B., Boggess, A., Maran, S. P., Mushotzky, R. F., & Wu, C.-C. 1999, ApJ, 516, 750
- Crenshaw et al. (2003) Crenshaw, D. M., Kraemer, S. B., & George, I. M. 2003, ARAA, 41, 117
- Croton et al. (2006) Croton, D. J., et al. 2006, MNRAS, 365, 11
- Dalla Vecchia & Schaye (2008) Dalla Vecchia, C., & Schaye, J. 2008, MNRAS, 387, 1431
- Damen et al. (2009) Damen, M., Labbé, I., Franx, M., van Dokkum, P. G., Taylor, E. N., & Gawiser, E. J. 2009, ApJ, 690, 937
- Davies (2007) Davies, R. I. 2007, MNRAS, 375, 1099
- Di Matteo et al. (2005) Di Matteo, T., Springel, V., & Hernquist, L. 2005, Nature, 433, 604
- Elvis et al. (1994) Elvis, M., et al. 1994, APJS, 95, 1
- Erb et al. (2006) Erb, D. K., Steidel, C. C., Shapley, A. E., Pettini, M., Reddy, N. A., & Adelberger, K. L. 2006, ApJ, 646, 107
- Fabian (1999) Fabian, A. C. 1999, MNRAS, 308, L39
- García-Marín et al. (2009) García-Marín, M., Colina, L., Arribas, S., & Monreal-Ibero, A. 2009, A&AP, 505, 1319
- Ganguly & Brotherton (2008) Ganguly, R., & Brotherton, M. S. 2008, ApJ, 672, 102
- Genzel et al. (1998) Genzel, R., et al. 1998, ApJ, 498, 579
- Gibson et al. (2009) Gibson, R. R., Brandt, W. N., Gallagher, S. C., & Schneider, D. P. 2009, ApJ, 696, 924
- Granato et al. (2004) Granato, G. L., De Zotti, G., Silva, L., Bressan, A., & Danese, L. 2004, ApJ, 600, 580
- Granato et al. (2004) Granato, G. L., De Zotti, G., Silva, L., Bressan, A., & Danese, L. 2004, ApJ, 600, 580
- (37) Greve, T. R., et al.2005, MNRAS, 359, 1165
- Heckman et al. (1990) Heckman, T. M., Armus, L., & Miley, G. K. 1990, APJS, 74, 833
- Helou et al. (1985) Helou, G., Soifer, B. T., & Rowan-Robinson, M. 1985, ApJL, 298, L7
- Holt et al. (2008) Holt, J., Tadhunter, C. N., & Morganti, R. 2008, MNRAS, 387, 639
- Hooper et al. (1995) Hooper, E. J., Impey, C. D., Foltz, C. B., & Hewett, P. C. 1995, ApJ, 445, 62
- Hopkins et al. (2005) Hopkins, P. F., Hernquist, L., Cox, T. J., Di Matteo, T., Martini, P., Robertson, B., & Springel, V. 2005a, ApJ, 630, 705
- Hopkins et al. (2005) Hopkins, P. F., Hernquist, L., Martini, P., Cox, T. J., Robertson, B., Di Matteo, T., & Springel, V. 2005b, ApJL, 625, L71
- Hopkins et al. (2006) Hopkins, P. F., Hernquist, L., Cox, T. J., Di Matteo, T., Robertson, B., & Springel, V. 2006, APJS, 163, 1
- Jiang et al. (2007) Jiang, L., Fan, X., Ivezić, Ž., Richards, G. T., Schneider, D. P., Strauss, M. A., & Kelly, B. C. 2007, ApJ, 656, 680
- Juneau et al. (2005) Juneau, S., et al. 2005, ApJL, 619, L135
- Kawakatu et al. (2006) Kawakatu, N., Anabuki, N., Nagao, T., Umemura, M., & Nakagawa, T. 2006, ApJ, 637, 104
- Kellermann et al. (1989) Kellermann, K. I., Sramek, R., Schmidt, M., Shaffer, D. B., & Green, R. 1989, AJ, 98, 1195
- Kennicutt (1998) Kennicutt, R. C., Jr. 1998, ARAA, 36, 189
- King (2003) King, A. 2003, ApJL, 596, L27
- King & Pounds (2003) King, A. R., & Pounds, K. A. 2003, MNRAS, 345, 657
- Komossa et al. (2008) Komossa, S., Xu, D., Zhou, H., Storchi-Bergmann, T., & Binette, L. 2008, ApJ, 680, 926
- Laor & Brandt (2002) Laor, A., & Brandt, W. N. 2002, ApJ, 569, 641
- Lehnert & Heckman (1996) Lehnert, M. D., & Heckman, T. M. 1996, ApJ, 462, 651
- Lehnert et al. (2009) Lehnert, M. D., Nesvadba, N. P. H., Tiran, L. L., Matteo, P. D., van Driel, W., Douglas, L. S., Chemin, L., & Bournaud, F. 2009, ApJ, 699, 1660
- Lípari et al. (2009a) Lípari, S., et al. 2009a, MNRAS, 392, 1295
- Lípari et al. (2009b) Lípari, S., et al. 2009b, MNRAS, 398, 658
- Lutz et al. (2008) Lutz, D., et al. 2008, ApJ, 684, 853
- Marconi & Hunt (2003) Marconi, A., & Hunt, L. K. 2003, ApJL, 589, L21
- Martini & Weinberg (2001) Martini, P., & Weinberg, D. H. 2001, ApJ, 547, 12
- Martin (2005) Martin, C. L. 2005, ApJ, 621, 227
- Martin (2006) Martin, C. L. 2006, ApJ, 647, 222
- Murray et al. (2005) Murray, N., Quataert, E., & Thompson, T. A. 2005, ApJ, 618, 569
- Nesvadba et al. (2006) Nesvadba, N. P. H., Lehnert, M. D., Eisenhauer, F., Gilbert, A., Tecza, M., & Abuter, R. 2006, ApJ, 650, 693
- Nesvadba et al. (2007) Nesvadba, N. P. H., Lehnert, M. D., De Breuck, C., Gilbert, A., & van Breugel, W. 2007a, A&AP, 475, 145
- Nesvadba et al. (2007) Nesvadba, N. P. H., et al. 2007b, ApJ, 657, 725
- Nesvadba et al. (2008) Nesvadba, N. P. H., Lehnert, M. D., De Breuck, C., Gilbert, A. M., & van Breugel, W. 2008, A&AP, 491, 407
- Ohsuga et al. (2009) Ohsuga, K., Mineshige, S., Mori, M., & Kato, Y. 2009, PASJ, 61, L7
- Osterbrock (1989) Osterbrock, D. E. 1989, Research supported by the University of California, John Simon Guggenheim Memorial Foundation, University of Minnesota, et al. Mill Valley, CA, University Science Books, 1989, 422 p.,
- Panter et al. (2007) Panter, B., Jimenez, R., Heavens, A. F., & Charlot, S. 2007, MNRAS, 378, 1550
- Page et al. (2001) Page, M. J., Stevens, J. A., Mittaz, J. P. D., & Carrera, F. J. 2001, Science, 294, 2516
- Pérez-González et al. (2008) Pérez-González, P. G., et al. 2008, ApJ, 675, 234
- Pettini et al. (2001) Pettini, M., Shapley, A. E., Steidel, C. C., Cuby, J.-G., Dickinson, M., Moorwood, A. F. M., Adelberger, K. L., & Giavalisco, M. 2001, ApJ, 554, 981
- Pope et al. (2008) Pope, A., et al. 2008, ApJ, 675, 1171
- Porquet et al. (2004) Porquet, D., Reeves, J. N., Uttley, P., & Turner, T. J. 2004, A&AP, 427, 101
- Pounds et al. (2003) Pounds, K. A., Reeves, J. N., King, A. R., Page, K. L., O’Brien, P. T., & Turner, M. J. L. 2003, MNRAS, 345, 705
- Pounds & Reeves (2009) Pounds, K. A., & Reeves, J. N. 2009, MNRAS, 819
- Proga et al. (2000) Proga, D., Stone, J. M., & Kallman, T. R. 2000, ApJ, 543, 686
- Reeves et al. (2003) Reeves, J. N., O’Brien, P. T., & Ward, M. J. 2003, ApJL, 593, L65
- Robson (1996) Robson, I. 1996, Wiley-Praxis Series in Astronomy and Astrophysics, New York, NY: Wiley, Chichester: Praxis Publishing, —c1996,
- Rupke et al. (2005) Rupke, D. S., Veilleux, S., & Sanders, D. B. 2005a, ApJ, 632, 751
- Rupke et al. (2005) Rupke, D. S., Veilleux, S., & Sanders, D. B. 2005b, APJS, 160, 115
- Sanders & Mirabel (1996) Sanders, D. B., & Mirabel, I. F. 1996, ARAA, 34, 749
- Sanders et al. (1988) Sanders, D. B., Soifer, B. T., Elias, J. H., Madore, B. F., Matthews, K., Neugebauer, G., & Scoville, N. Z. 1988, ApJ, 325, 74
- Schweitzer et al. (2006) Schweitzer, M., et al. 2006, ApJ, 649, 79
- Seymour et al. (2007) Seymour, N., et al. 2007, APJS, 171, 353
- Shapley et al. (2003) Shapley, A. E., Steidel, C. C., Pettini, M., & Adelberger, K. L. 2003, ApJ, 588, 65
- Silk & Rees (1998) Silk, J., & Rees, M. J. 1998, A&AP, 331, L1
- Smail et al. (2003) Smail, I., Chapman, S. C., Ivison, R. J., Blain, A. W., Takata, T., Heckman, T. M., Dunlop, J. S., & Sekiguchi, K. 2003, MNRAS, 342, 1185
- Smolčić et al. (2009) Smolčić, V., et al. 2009, ApJ, 696, 24
- Spoon & Holt (2009) Spoon, H. W. W., & Holt, J. 2009, ApJL, 702, L42
- Springel et al. (2005) Springel, V., Di Matteo, T., & Hernquist, L. 2005, MNRAS, 361, 776
- Stevens et al. (2003) Stevens, J. A., et al. 2003, Nature, 425, 264
- Stevens et al. (2005) Stevens, J. A., Page, M. J., Ivison, R. J., Carrera, F. J., Mittaz, J. P. D., Smail, I., & McHardy, I. M. 2005, MNRAS, 360, 610
- Swinbank et al. (2005) Swinbank, A. M., et al. 2005, MNRAS, 359, 401
- (96) Swinbank, A. M., Chapman, S. C., Smail, I., Lindner, C., Borys, C., Blain, A. W., Ivison, R. J., & Lewis, G. F. 2006, MNRAS, 371, 465
- Swinbank et al. (2009) Swinbank, A. M., et al. 2009, MNRAS, 1512
- Tacconi et al. (2008) Tacconi, L. J., et al. 2008, ApJ, 680, 246
- (99) Takata, T., Sekiguchi, K., Smail, I., Chapman, S. C., Geach, J. E., Swinbank, A. M., Blain, A., & Ivison, R. J. 2006, ApJ, 651, 713
- Tremaine et al. (2002) Tremaine, S., et al. 2002, ApJ, 574, 740
- Tremonti et al. (2007) Tremonti, C. A., Moustakas, J., & Diamond-Stanic, A. M. 2007, ApJL, 663, L77
- Veilleux et al. (1999) Veilleux, S., Kim, D.-C., & Sanders, D. B. 1999, ApJ, 522, 113
- Veilleux et al. (2005) Veilleux, S., Cecil, G., & Bland-Hawthorn, J. 2005, ARAA, 43, 769
- Weaver et al. (1977) Weaver, R., McCray, R., Castor, J., Shapiro, P., & Moore, R. 1977, ApJ, 218, 377
- Willott et al. (1998) Willott, C. J., Rawlings, S., Blundell, K. M., & Lacy, M. 1998, MNRAS, 300, 625
- Wilman et al. (1999) Wilman, R. J., Crawford, C. S., & Abraham, R. G. 1999, MNRAS, 309, 299
- Wilman et al. (2005) Wilman, R. J., Gerssen, J., Bower, R. G., Morris, S. L., Bacon, R., de Zeeuw, P. T., & Davies, R. L. 2005, Nature, 436, 227
- Wyithe & Loeb (2003) Wyithe, J. S. B., & Loeb, A. 2003, ApJ, 595, 614
- Zheng et al. (2002) Zheng, X. Z., Xia, X. Y., Mao, S., Wu, H., & Deng, Z. G. 2002, AJ, 124, 18