A type IIn supernova with coronal lines in the low-metallicity compact dwarf galaxy J1320+2155
Abstract
We report the discovery of a type IIn supernova in the low-metallicity dwarf galaxy J1320+2155, with an oxygen abundance 12+logO/H = 8.00.2. This finding is based on SDSS (February 2008) and 3.5m Apache Point Observatory (February 2009) spectra taken one year apart, and on the observations that: the H and H emission lines show broad components corresponding to gas expansion velocities of 1600 km s-1; the Balmer decrement is exceeedingly high: the H/H flux ratio, being more than 30, implies a very dense environment (107 cm-3); and the H broad luminosity decreases slowly, by only a factor of 1.8 over the course of a year, typical of the slow luminosity evolution of a type IIn supernova. Several weak coronal lines of [Fe VII] and [Fe X] are also seen in the SDSS spectrum, implying ionization of the pre-shock circumstellar medium by shock-induced X-ray emission. The galaxy J1320+2155 is the first dwarf system ever to be discovered with a type IIn supernova exhibiting coronal lines in its spectrum.
1 Introduction
During the last few years, we have been carrying out a systematic search for very metal-deficient emission-line galaxies in the Sloan Digital Sky Survey (SDSS; York et al., 2000). The selection criteria and the first results of that search are given in Izotov & Thuan (2007, 2008, 2009) and Izotov et al. (2007). In the course of this study, we have focused in particular our attention on a small subset of these galaxies, those with spectra that exhibit broad components in their strong emission lines, mainly in H, [O III] 4959, 5007, and H. Izotov et al. (2007) have found that the most plausible origin of broad-line emission for the majority of galaxies is the evolution of massive stars and their interaction with the circumstellar and interstellar medium. Broad emission with H luminosities in the range from 1036 ergs s-1 to 1039 ergs s-1 is most likely produced in circumstellar envelopes around hot Ofp/WN9 and/or LBV stars (Izotov & Thuan, 2009). However, there is a handful of galaxies with broad H luminosities that can be as high as 1040-1042 ergs s-1. They probably arise from Type IIp or IIn supernovae (SNe) or from active galactic nuclei (AGN) containing intermediate-mass black holes (Izotov & Thuan, 2008).
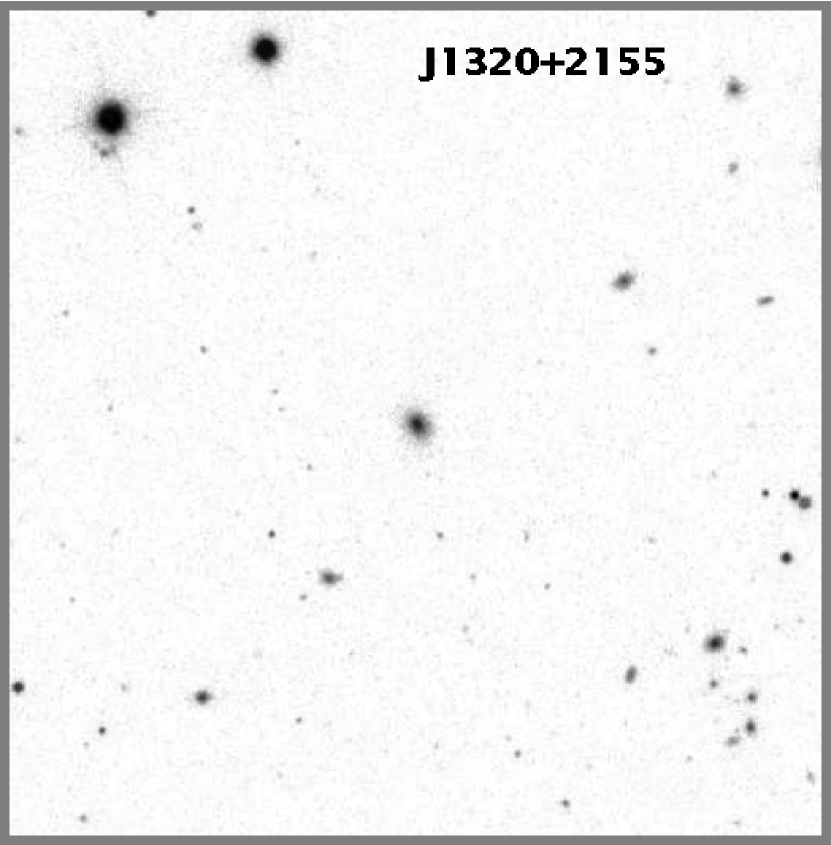
We report here the discovery of a SN in the dwarf emission-line galaxy J1320+2155, based on a spectrum in the Data Release 7 (DR7) of the Sloan Digital Sky Survey (SDSS) that became publicly available in November 2008. The general characteristics of the galaxy are shown in Table 1. The distance to the galaxy is = 92 Mpc, as inferred from its redshift and adopting a Hubble constant = 75 km s-1 Mpc-1. At this distance the absolute SDSS -band magnitude of the galaxy is 16.89, which qualifies it as a dwarf galaxy. In the SDSS image obtained on March 12, 2005 (Fig. 1), the galaxy shows a compact elongated shape, with an angular size of 33 (FWHM) that corresponds to a linear size of 1.5 kpc. Its colors ( = 0.76, = 0.38 and = 0.51) are typical of dwarf irregular galaxies.
The SDSS spectrum of J1320+2155, obtained on February 11, 2008 (Fig. 2), reduced to zero redshift, shows a H emission line that has a broad width (1400 km s-1), and a considerably more intense H emission line, also with a broad width (1700 km s-1). These broad features are very unusual for the spectrum of a dwarf emission-line galaxy. To better understand their origin, we have obtained new high- and low-resolution spectroscopic observations of J1320+2155. Together with the SDSS spectrum, these new observations will allow us to study the temporal evolution of the broad line features and constrain their origin: are they due to an AGN or to a luminous SN?
In section 2, we describe the new spectroscopic observations and data reduction. Section 3 discusses the physical properties of the SDSS and new spectra and section 4 summarizes our findings.
2 Observations and Data Reduction
We have obtained new optical spectra of the emission-line dwarf galaxy J1320+2155 on the night of February 23, 2009, using the 3.5 m Apache Point Observatory (APO) telescope111The APO 3.5 m telescope is owned and operated by the Astrophysical Research Consortium.. These new spectra allow us first to study the temporal variations of the H and H emission lines, and second to detect the [O ii] 3727 emission line needed for an accurate determination of the oxygen abundance in the galaxy. This line is absent in the SDSS spectrum (Fig. 2) because of the galaxy’s low redshift ( = 0.023): the [O ii] line is not redshifted enough to fall in the wavelength range covered by the SDSS spectra. The APO observations were made with the Dual Imaging Spectrograph (DIS) in both the blue and red wavelength ranges. Two different sets of gratings were used for the low- and high- spectral resolution observations. For the low-resolution observations in the blue range, we use the B400 grating with a linear dispersion of 1.83 Å/pix and a central wavelength of 4400Å, while in the red range we use the R300 grating with a linear dispersion of 2.31 Å/pix and a central wavelength of 7500Å. The above instrumental set-up gave a spatial scale along the slit of 04 pixel-1, a spectral range 3600 – 9600Å and a spectral resolution of 7Å FWHM. For the high-resolution observations, we use in the blue range the B1200 grating with a linear dispersion of 0.62 Å/pix and a central wavelength of 4400Å, while in the red range we use the R1200 grating with a linear dispersion 0.58 Å/pix and a central wavelength of 7300Å. This instrumental set-up gave a wavelength coverage 1200Å and a spectral resolution of 2Å FWHM in both the blue and red ranges. The total exposure time for the low and high resolution observations were 300s and 1800s, respectively, of which both were split into two equal exposures. Two Kitt Peak IRS spectroscopic standard stars G191B2B and Feige 34 were observed for flux calibration. Spectra of He-Ne-Ar comparison arcs were obtained at the beginning of the night for wavelength calibration. In all observations, a slit width of 2″ was used.
The two-dimensional spectra were bias subtracted and flat-field corrected using IRAF222IRAF is distributed by National Optical Astronomical Observatory, which is operated by the Association of Universities for Research in Astronomy, Inc., under cooperative agreement with the National Science Foundation.. We then use the IRAF software routines IDENTIFY, REIDENTIFY, FITCOORD, TRANSFORM to perform wavelength calibration and correct for distortion and tilt for each frame. One-dimensional spectra were then extracted from each frame using the APALL routine using an aperture of 2″44. This was chosen so that the APO aperture has the same area as the SDSS aperture, a 3″ round slit. A sensitivity curve was obtained by fitting a high-order polynomial to the observed spectral energy distribution of each of the two standard stars. The final adopted sensitivity curve is then the average of the two sensitivity curves.
The spectra of J1320+2155 obtained with the 3.5m APO are shown in Fig. 3, reduced to zero redshift. As in the SDSS spectrum, the H and H emission lines show both narrow and broad components. The high-resolution APO spectrum shows that the broad component of both the H and H emission lines is slightly asymmetric and blue-shifted (by 200 km s-1) with respect to the narrow component.
The SDSS spectrum (Fig. 2), obtained with an exposure time of 3000 s, exhibits some unusual emission lines that are atypical of dwarf emission-line galaxies. In addition to the broad H and H emission lines, other permitted lines, He i 4471, 5876, 6678, 7065 and O i 8445 also show a broad component. Furthermore, several narrow high-ionization coronal lines such as [Fe VII] and [Fe X] lines are detected, implying an extremely high electron temperature of the regions where they originate. The 3.5 m APO spectra were obtained with shorter exposure times, so do not show the high-ionization coronal lines. Furthermore, they were obtained in non-photometric conditions. To put the APO spectra on a photometric scale, we adjust the flux of its narrow H emission line to be equal to that in the SDSS spectrum.
The extinction-corrected nebular line fluxes () for the SDSS spectrum, normalized to (H) and multiplied by a factor of 100, and their errors, are given in Table 2. They were measured using the IRAF SPLOT routine. The listed line flux errors include statistical errors derived with SPLOT from non-flux calibrated spectra, in addition to errors introduced in the standard star absolute flux calibration, which we set to be 1% of the line fluxes. Data for two additional emission lines were available from the 3.5 m APO spectra. The flux of the [O ii] 3727 emission line was measured in the low-resolution spectrum. The [N ii] 6583 emission line is blended with the broad H in the SDSS spectrum (inset b in Fig. 2) but is well separated from the broad H in the high-resolution 3.5 m APO spectrum (Fig. 3b), allowing a measurement of its flux. All narrow lines, including the hydrogen lines, have widths of 2 – 3Å FWHM: they are thus unresolved.
It is seen from Table 2 that the observed fluxes of the hydrogen emission lines relative to the H flux are very close to their recombination values, for an electron temperature of 10000 K. This suggests that the narrow hydrogen lines arise in an ionized interstellar medium with a number density 107 cm-3. Adopting an electron temperature of 10000 K, we correct the narrow line fluxes for both reddening (using the extinction curve of Whitford, 1958) and underlying hydrogen stellar absorption, derived simultaneously by an iterative procedure as described in Izotov et al. (1994). The extinction coefficient is defined as (H) = 1.47, where = /3.2 and is the extinction in the band (Aller, 1984). The extinction coefficient (H), observed flux (H), equivalent width EW(H), and equivalent width EW(abs) of the hydrogen absorption stellar lines are also given in Table 2.
3 Results
3.1 Variability of the broad H luminosity
The most notable features in the spectra of J1320+2155 are the strong and relatively broad H and H emission lines. The parameters of these lines are shown in Table 3 for both the SDSS and high-resolution 3.5m APO spectra. Examination of Table 3 shows a striking fact: the H to H flux ratio is exceedingly high, being greater than 30, more than one order of magnitude greater than its recombination value. This implies that the broad hydrogen emission comes from a high-density gas with an electron density in excess of 107 cm-3. The large intensity of H relative to H is due to electron collisional excitation in a very dense environment. The H luminosity derived from the SDSS spectrum has the high value (H) = 6.431040 erg s-1. As discussed by Izotov & Thuan (2008), such a high luminosity can be explained by the presence in the dwarf galaxy of either an AGN or a type IIp or type IIn supernova. Thanks to the APO spectra taken about one year after the SDSS spectrum, we can ascertain that the broad H luminosity has decreased by a factor of 1.8 during that period. This drop in luminosity implies that the H emission is produced by an expanding supernova envelope. We would expect a roughly constant luminosity in the case of an AGN and a more rapid fading in the case of a type IIp supernova.
3.2 A type IIn supernova
We have no photometric observations of the supernova. We have therefore estimated its brightness from the continuum level of the SDSS spectrum obtained on February 11, 2008. In the wavelength range of 4300 – 4500Å which corresponds to the filter, we obtain 17.6 or about 0.3 mag brighter than the magnitude of J1320+2155 before the SN explosion, as derived from the SDSS image obtained on 12 March 2005 (Table 1). Thus, the absolute magnitude of the supernova on the date of the SDSS spectral observations was 15.6, as compared to the absolute magnitude of 16.9 of the galaxy before the supernova event. The broad H and continuum flux distributions along the slit, peak at the same location in the 3.5m APO high-resolution spectrum, in the central part of the galaxy. This implies that the supernova is located in the nucleus of the dwarf galaxy. Note that the continuum level near H did not change over a period of one year, the time interval between the SDSS and APO observations. The constancy of the continuum level, the slow decline of the H luminosity and a nearly constant expansion velocity of 1600 km s-1 as measured from the FWHM of the broad component of the H emission line, are all characteristics of a type IIn SN [SN 1988Z, Stathakis & Sadler (1991), Turatto et al. (1993), Salamanca et al. (2002); SN 1995N, Fransson et al. (2002); SN 1997eg, Hoffman et al. (2008); SN 2005ip, Smith et al. (2009); SN 2007rt, Trundle et al. (2009)].
3.3 Other lines with broad components
Besides the H and H lines, the He i 5876, 6678 and 7065 emission lines in the SDSS spectrum also show narrow and broad components. We use Gaussian profiles to fit both components. The narrow components fluxes of these lines are given in Table 2. They show a striking fact: depending on the line, they are larger by a factor 1.5 – 5 than the fluxes expected in a low-density ionized gas. This suggests a relatively dense environment in which the narrow He i lines are considerably enhanced by collisions in a dense pre-shock region of the supernova.
The fluxes relative to the broad H flux and widths of the He i broad components are given in Table 4. The broad component of the He i lines is also collisionally enhanced, but to a larger extent as compared to the narrow component, implying that they originate from larger density regions. In addition, a broad O i 8445 emission line is also detected in the SDSS spectrum. Its flux and width are also shown in Table 4. All these lines have fluxes that are significantly smaller than the broad H line flux. The errors of their fluxes and widths are consequently larger. Examination of Table 4 shows that the collisionally enhanced He i lines have widths that are lower but comparable within the errors to the widths of the broad hydrogen lines. These broad lines originate presumably in the post-shock circumstellar medium of the supernova.
3.4 Ionized gas diagnostics from nebular and auroral lines
Narrow nebular and auroral emission lines are frequently used for ionized gas diagnostics and for the determination of the electron temperature , the electron number density and the element abundances in H ii regions of dwarf emission-line galaxies. Applying the procedures of e.g. Izotov et al. (2006) and the semi-empirical method described by Izotov & Thuan (2007), based on the fluxes of the strong nebular [O ii] 3727, [O iii] 4959, 5007 emission lines, we derive an oxygen abundance 12+logO/H = 7.68 for the ionized gas in J1320+2155. However, this technique is applicable only in the case of a low density gas ionized by stellar radiation. Usually, the electron density in the H ii region is derived from the nebular [S ii] 6717/6731 line ratio. For J1320+2155, this ratio is high, 1, suggesting a low electron number density of the order of a few hundred cm-1 (Aller, 1984). However, as discussed above, there are indications that the narrow line-emitting region in J1320+2155 has a high density (for example, the narrow He i emission lines are significantly enhanced by collisions), so that the low-density assumption for abundance determinations is not valid. Additionally, the [O iii] 4363 and [N ii] 5755 auroral lines are relatively strong as compared to the nebular [O iii] 5007 and [N ii] 6583 emission lines. These lines are used for the determination of the electron temperature in H ii regions. Assuming a low density (100 cm-3), we derive an electron temperature of 32500 K from the [O iii] 4363/(4959+5007) flux ratio. As for the [N ii] 5755/6583 flux ratio, its value is so high that it cannot be explained by any temperature in the low density regime. Evidently, the regions that are emitting [O iii] and [N ii] are so dense that collisional deexcitation becomes important. This leads to an overestimate of the electron temperature and an underestimate of the abundances if a low density is assumed. Apparantly, these lines are emitted in the supernova pre-shock dense circumstellar region.
Since the critical densities for collisional deexcitation are significantly higher for auroral lines than for nebular lines, their emission comes preferentially from denser regions as compared to the emission of nebular lines. This fact may explain the apparent disagreement with the low density obtained from the low-ionization nebular [S ii] lines for which critical densities are low ( 104 cm-3): these originate mainly in low-density regions.
We can estimate the electron number density by using the auroral-to-nebular flux ratios for the [O iii] and [N ii] emission lines and the equations from Aller (1984) for temperature determination. These equations take into account collisional deexcitation. We find that for a reasonable range of temperatures, those varying between 10000 K and 15000 K, the electron number density must be in the range (1–2)106 cm-3 to account for the observed [O iii] 4363/(4959+5007) and [N ii] 5755/6583 flux ratios.
In such dense regions, element abundances cannot be derived because of the unknown spatial distribution of the gas density. We can obtain an estimate of the oxygen abundance of J1320+2155 by using the statistical luminosity-metallicity relation for dwarf irregular galaxies, e.g. the ones by Richer & McCall (1995) and Skillman et al. (1989). We find 12+logO/H = 8.00.2, higher (by 0.3 dex) than the value obtained by the semi-empirical method, as expected because of the high density.
3.5 Coronal lines and diagnostics of high-ionization regions
The SDSS spectrum of J1320+2155 exhibits several narrow high-ionization coronal lines of [Fe vii] and [Fe x] (Fig. 2). These lines have been seen before in spectra of type IIn SNe [SN 1988Z, Turatto et al. (1993), Salamanca et al. (2002); SN 1995N, Fransson et al. (2002); SN 1997eg, Hoffman et al. (2008); SN 2005ip, Smith et al. (2009); SN 2007rt, Trundle et al. (2009)] in spiral galaxies. However, their occurence is very rare. J1320+2155 is the first compact dwarf galaxy discovered with a type IIn SN spectrum showing coronal lines. If collisional ionization is the dominant mechanism, then the presence of these lines implies substantial amounts of gas at temperatures from several 105K to 106K (Bryans et al., 2009) and pre-shock ionization of the circumstellar medium by X-ray emission. The gas can be cooler if photoionization is the main mechanism.
The critical densities for coronal lines are 108 cm-3 (Nussbaumer & Story, 1982), considerably higher than those for nebular lines of low-ionization species. The coronal lines can act thus as diagnostics of much hotter and denser gas in the supernova circumstellar medium. In particular, the observed [Fe vii] 3759/6087 flux ratio of 1.5 yields densities 107 cm-3 for temperatures above 100 000 K (Nussbaumer & Story, 1982). The high [Fe vii] 5159/6087 flux ratio also implies that the electron density in the hottest regions is in the range 107 cm-3. This range of number densities is broadly consistent with our estimates from the auroral-to-nebular flux ratios for the lower ionization species. It is also in the range of number densities obtained by Smith et al. (2009) for SN 2005ip, the SN with the spectrum richest in coronal lines known to-date, and taken several hundred days after the explosion.
4 Conclusions
We present SDSS (11 February 2008) and 3.5 m APO (23 February 2009) spectra of a newly discovered type IIn supernova in the compact dwarf galaxy J1320+2155.
We have obtained the following results:
1) The supernova was not present in the SDSS image obtained in March 2005. The host dwarf galaxy J1320+2155 on that image exibits a compact regular morphology with a size of 1.5 kpc and an absolute SDSS magnitude of 16.89, for a distance of 92 Mpc. Its colors are typical of dwarf irregular galaxies. The oxygen abundance of the galaxy, estimated from the luminosity-metallicity relation for dwarf irregular galaxies, is 12+logO/H=8.00.2.
2. From the light distribution in the slit, we infer that the supernova, which appeared prior to 11 February 2008, is in the central part of the galaxy. The broad widths of the H and H emission lines, corresponding to velocities of 1600 km s-1 FWHM, an exceedingly high Balmer decrement (a H/H flux ratio 30), the slow decline of the H broad luminosity over a time scale of 1 year, all point to a type IIn SN. The spectrum also shows Helium lines that are broadened with velocities of 1000 km s-1 and that are collisionally enhanced.
3. Several narrow auroral and nebular emission lines of different low-ionization species are present in the SDSS spectrum. The auroral-to-nebular line flux ratios suggest that they originate in a dense ( 106 cm-3) pre-shock circumstellar region.
4. Several narrow coronal emission lines of [Fe VII] and [Fe X] are detected in the SDSS spectrum, implying ionization of the pre-shock circumstellar medium by shock-induced X-ray emission.
There are reasons to suggest that type IIn SNe may occur in low-metallicity dwarf galaxies. The low metallicity lead to less cooling of the gas and hence to the formation of the more massive stars that are progenitors of this type of SNe. We plan more observations of the supernova in J1320+2155 to further constrain its properties.
References
- Aller (1984) Aller, L. H. 1984, Physics of Thermal Gaseous Nebulae (Dordrecht: Reidel)
- Bryans et al. (2009) Bryans, P., Landi, E., & Savin, D. W. 2009, ApJ, 691, 1540
- Fransson et al. (2002) Fransson, C., Chevalier, R., Filippenko, A., et al. 2002, ApJ, 572, 350
- Hoffman et al. (2008) Hoffman, J. L., Leonard, D. C., Chornock, R., Filippenko, A. V., Barth, A. J., & Matheson, T. 2008, ApJ, 688, 1186
- Izotov & Thuan (2007) Izotov, Y. I., & Thuan, T. X. 2007, ApJ, 665, 1115
- Izotov & Thuan (2008) ———. 2008, ApJ, 687, 133
- Izotov & Thuan (2009) ———. 2009, ApJ, 690, 1797
- Izotov et al. (1994) Izotov, Y. I., Thuan, T. X., & Lipovetsky, V. A. 1994, ApJ, 435, 647
- Izotov et al. (2006) Izotov, Y. I., Stasińska, G., Meynet, G., Guseva, N. G., & Thuan, T. X. 2006, A&A, 448, 955
- Izotov et al. (2007) Izotov, Y. I., Thuan, T. X., & Guseva, N. G. 2007, ApJ, 671, 1297
- Nussbaumer & Story (1982) Nussbaumer, H., & Storey, P. J. 1982, A&A, 113, 21
- Richer & McCall (1995) Richer, M. G., & McCall, M. L. 1995, ApJ, 445, 642
- Salamanca et al. (2002) Salamanka, I., Terlevich, R. J., & Tenorio-Tagle, G. 2002, MNRAS, 330, 844
- Skillman et al. (1989) Skillman, E. D., Kennicutt, R. C., Jr. & Hodge, P. W. 1989, ApJ, 347, 875
- Smith et al. (2009) Smith, N., Silverman, J. M., Chornock, R., et al. 2009, ApJ, 695, 1334
- Stathakis & Sadler (1991) Stathakis, R. A., & Sadler, E. M. 1991, MNRAS, 250, 786
- Trundle et al. (2009) Trundle, C., Pastorello, A., Benetti, S., et al. 2009, A&A, 504, 945
- Turatto et al. (1993) Turatto, M., Capellaro, E., Danziger, I. J., Benetti, S., Gouiffes, C., & Della Valle, M. 1993, MNRAS, 262, 128
- Whitford (1958) Whitford, A. E. 1958, AJ, 63, 201
- York et al. (2000) York, D. G., et al. 2000, AJ, 120, 1579
| R.A.(J2000.0) | Dec.(J2000.0) | redshift | aaDistance in Mpc calculated from the redshift, adopting =75 km s-1Mpc-1. | |||||
|---|---|---|---|---|---|---|---|---|
| 13 20 53.67 | +21 55 10.3 | 0.02319 | 92 | 18.680.04 | 17.920.01 | 17.540.01 | 17.410.01 | 17.370.04 |
| Line | 100/(H) | 100/(H) |
|---|---|---|
| 3727 [O ii] | 327.0 9.2aaFrom the low-resolution 3.5m APO spectrum. | 308.510.5 |
| 3759 [Fe vii] | 10.4 2.1 | 9.8 2.2 |
| 3868 [Ne iii] | 43.9 1.9 | 41.3 2.0 |
| 4101 H | 22.8 1.4 | 25.1 2.0 |
| 4340 H | 47.3 2.0 | 48.3 2.6 |
| 4363 [O iii] | 13.4 1.8 | 12.5 1.9 |
| 4629 Fe ii | 5.6 2.4 | 5.2 2.4 |
| 4658 [Fe iii] | 4.6 1.1 | 4.3 1.1 |
| 4686 He ii | 5.5 1.0 | 5.1 1.0 |
| 4861 H | 100.0 3.5 | 100.0 4.4 |
| 4959 [O iii] | 70.7 2.7 | 65.4 2.7 |
| 5007 [O iii] | 215.9 6.5 | 199.7 6.5 |
| 5159 [Fe vii] | 9.4 2.3 | 8.7 2.3 |
| 5200 [N i] | 7.3 3.6 | 6.7 3.6 |
| 5276 [Fe vii] | 10.5 2.6 | 9.7 2.8 |
| 5316 Fe ii | 10.9 2.8 | 10.0 2.9 |
| 5755 [N ii] | 28.5 1.8 | 26.1 1.8 |
| 5876 He i | 21.7 1.7 | 19.8 1.7 |
| 6087 [Fe vii] | 6.7 2.7 | 6.1 3.7 |
| 6300 [O i] | 15.3 1.5 | 13.9 1.5 |
| 6312 [S iii] | 2.5 1.0 | 2.3 0.9 |
| 6373 [Fe x] | 6.3 2.3 | 5.8 2.2 |
| 6563 H | 309.210.9 | 288.012.1 |
| 6583 [N ii] | 40.4 2.0bbFrom the high-resolution 3.5m APO spectrum. | 36.7 2.0 |
| 6678 He i | 4.3 1.6 | 3.5 1.5 |
| 6717 [S ii] | 60.8 2.7 | 55.2 2.8 |
| 6731 [S ii] | 43.2 2.2 | 39.3 2.2 |
| 7065 He i | 11.1 1.6 | 10.0 1.6 |
| 7135 [Ar iii] | 9.8 4.0 | 8.8 3.9 |
| (H) | 0.025 | |
| (H)ccIn units 10-16 erg s-1 cm-2. | 12.3 | |
| EW(H), Å | 6.9 | |
| EW(abs), Å | 0.6 | |
| Telescope | Date | H | H | |||||
|---|---|---|---|---|---|---|---|---|
| FluxaaIn 10-15 erg s-1 cm-2. | Luminosity | FWHM | FluxaaIn 10-15 erg s-1 cm-2. | Luminosity | FWHM | |||
| erg s-1 | km s-1 | erg s-1 | km s-1 | |||||
| SDSS | 11 Feb 2008 | 2.090.32 | 2.120.321039 | 1438271 | 63.551.06 | 6.430.111040 | 1659 22 | |
| 3.5m APO | 23 Feb 2009 | 0.780.12 | 0.790.121039 | 1663310 | 35.560.85 | 3.590.091040 | 1596 15 | |
| Line | 100/(H)aa(H)= 2.0910-15 erg s-1 cm-2. | FWHM |
|---|---|---|
| km s-1 | ||
| 5876 He i | 32.2 5.8 | 1194 260 |
| 6678 He i | 12.2 9.1 | 938 620 |
| 7065 He i | 21.010.5 | 1267 679 |
| 8445 O i | 32.210.5 | 671 223 |