The faintest Seyfert radio cores revealed by VLBI
Abstract
In this letter, we report on dual-frequency European VLBI Network (EVN) observations of the faintest and least luminous radio cores in Seyfert nuclei, going to sub-mJy flux densities and radio luminosities around W Hz-1. We detect radio emission from the nuclear region of four galaxies (NGC 4051, NGC 4388, NGC 4501, and NGC 5033), while one (NGC 5273) is undetected at the level of Jy. The detected compact nuclei have rather different radio properties: spectral indices range from steep () to slightly inverted (), brightness temperatures vary from K to larger than K and cores are either extended or unresolved, in one case accompanied by lobe-like features (NGC 4051). In this sense, diverse underlying physical mechanisms can be at work in these objects: jet-base or outflow solutions are the most natural explanations in several cases; in the case of the undetected NGC 5273 nucleus, the presence of an advection-dominated accretion flow (ADAF) is consistent with the radio luminosity upper limit.
Subject headings:
galaxies: active — galaxies: Seyfert — radio continuum: galaxies1. Introduction
Active Galactic Nuclei (AGN) are traditionally divided in radio quiet (RQ) and radio loud (RL). The latter are typically powerful radio sources (W Hz-1), with large scale radio lobes and bright compact cores; VLBI observations routinely target their nuclear regions, showing high brightness temperatures and in some cases jet knots with superluminal motions. Radio quiet AGN, such as Seyfert galaxies, are much fainter radio sources and their radio emission is confined to the sub-kpc scale. However, moderately deep VLA surveys show that most AGN are radio sources at some level (Nagar et al., 2002; Ho & Ulvestad, 2001, hereinafter HU01). While the origin of the radio emission in RL AGN is well established as synchrotron radiation from energetic particles in jets and lobes, the case for RQ AGN is much less clear.
Since nuclear structures in most Seyfert galaxies show complex morphologies, it is of fundamental importance to resolve them with high spatial resolution. Indeed, it has been shown that VLBI observations of the pc-scale and subpc-scale region of Seyfert nuclei and Low-luminosity AGNs (LLAGNs) are often successful in the determination of the physical parameters of the nuclear radio components (such as the brightness temperature, the spectral index, the jet motions, etc.) and therefore in the comprehension of the underlying physical mechanisms. For example, the VLBA study of the classical Seyfert 2 galaxy NGC 1068 has allowed the identification of the location of the hidden active nucleus and the attribution of the core radio emission to thermal free-free emission from an X-ray heated corona or wind arising from the disk (Gallimore et al., 2004). In the case of the type 1 Seyfert NGC 4151 it has been possible to resolve the 0.2 pc two-sided base of a jet whose low speeds indicate non-relativistic jet motions, possibly due to thermal plasma (Ulvestad et al., 2005). On the contrary, the VLBA analysis of the LLAGN NGC 4278 has shown that the radio emission of this source is emitted via synchrotron process by relativistic particles similarly to ordinary radio-loud AGN (Giroletti et al., 2005). These studies indicate that the analysis of individual sources is very important for the determination of the different spatial components and physical parameters.
The five sources here presented belong to a complete distance limited (Mpc) sample of 27 nearby Seyfert galaxies (Cappi et al., 2006). Accurate multi-wavelength studies are available for this sample. In particular, VLA radio images at 1.4 and 5 GHz are presented in HU01, and VLA data at 15 GHz are also available for sample sources (Nagar et al., 2002). VLBI observations have become available for a few sources through the years; sources of the sample have 5 GHz VLBA observations (Nagar et al., 2002), while for the radio brightest galaxies, e.g. NGC 1068 and NGC 3031, dedicated works are available (Gallimore et al., 2004; Bietenholz et al., 2004). However, most of the weakest sources in the sample have never been observed with milliarcsecond resolution.
In the present letter, we report on new high sensitivity VLBI observations of five sources with mJy, aimed at answering two fundamental questions: (1) how common/frequent is the presence of (sub-)parsec scale radio sources even in the weakest nuclei and (2) what do the properties of the detected radio sources tell us about the physics of individual sources and the viability of jet-base versus Advection-Dominated Accretion Flow (ADAF, Narayan & Yi, 1994) explanations. The observations are detailed in §2 and the results presented in §3. A discussion and the main conclusions are given in §4 and §5, respectively. Throughout the paper, we define spectral indices such that and adopt km s-1 Mpc-1, and (Spergel et al., 2003).
2. Observations
We observed the nuclei of five Seyfert galaxies with the European VLBI Network (EVN) at 1.6 and 5 GHz, namely NGC 4051 (catalog ), NGC 4388 (catalog ), NGC 4501 (catalog ), NGC 5194 (catalog ), and NGC 5273 (catalog ); a basic summary of the observational parameters is given in Table 1. We used the maximum recording rate of 1 Gbps and each source was observed for about 6 hrs, switching between targets in order to improve the coverage of the -plane. Amplitude calibration was done a priori in the standard EVN pipeline; phase corrections were obtained using observations of bright nearby () calibrators, in the so-called phase referencing technique. The same calibrators were used to check the consistency of the amplitude calibration, which results accurate to within 10%.
Phase coherence was clearly detected on the baselines with large sensitive telescopes in four cases at 1.6 GHz and in two cases at 5 GHz. Significant weather and hardware problems affected some of the largest apertures during the 5 GHz observations, resulting in generally higher noise levels and lack of short spacings, which is a serious problem given the characteristics of our targets. The typical off-source noise level is Jy beam-1 at 1.6 GHz, and Jy beam-1 at 5 GHz. Owing to the low flux density of the targets, no self-calibration was attempted.
We derive flux densities and positions from Gaussian fits to the image plane in AIPS. As a check, we have also performed a visibility model fit in Difmap in the cases where the signal-to-noise ratio is sufficient to well constrain the best fit parameters. The results turn out to be in agreement. The final parameters are reported in Table 2, along with the resulting spectral indices and brightness temperature limits. Positions are generally determined with sub-mas accuracy ( mas).
3. Results
Radio emission is detected at both 1.6 and 5 GHz in the cores of NGC 4051 and NGC 5033, at 1.6 GHz with upper limits at 5 GHz in NGC 4388 and NGC 4501, while NGC 5273 remains undetected at either frequencies. The detected galaxies have a flux density at milliarcsecond scales that ranges from little more than 1 mJy down to about the threshold set by sensitivity limit of our observation ( a few 100’s Jy). In general, this corresponds to a fraction between 5 and 40% of the corresponding VLA flux density in the same sources.
The estimated sizes are of order mas (FWHM), although several components are unresolved and could actually be more compact. At the distance of our targets ( Mpc), this corresponds to linear sizes parsec. The brightness temperatures limits for such components have been calculated assuming sizes of of the model-fit FWHM, and are typically in excess of K. Details on the single sources are given in the following subsections.
3.1. NGC 4051
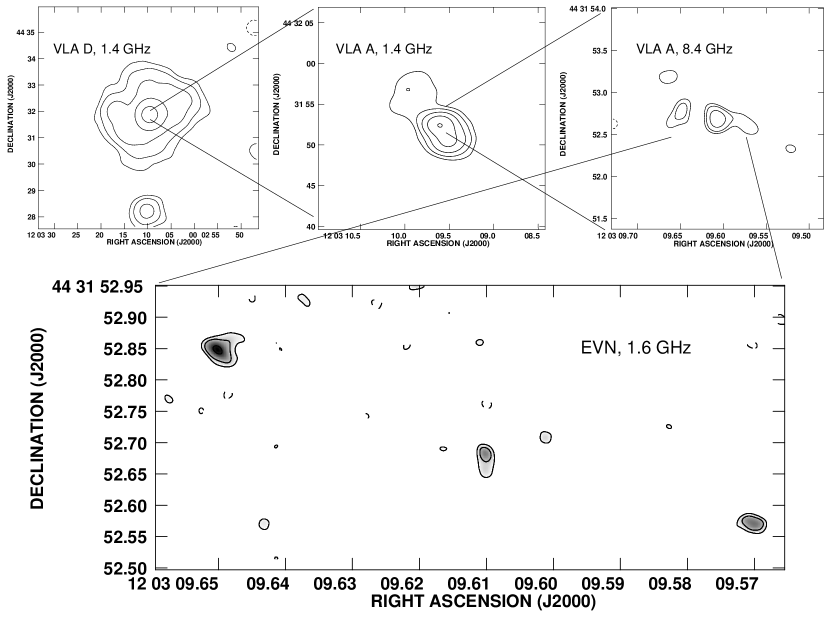
NGC 4051 is a Seyfert 1.2 galaxy with a complex radio structure at all scales. On scales of a few arcseconds, it is dominated by emission extending toward the southwest (HU01), while at higher resolution the central core splits into a small-scale double/triple separated by , roughly in the east-west direction (Ulvestad & Wilson, 1984; Kukula et al., 1995).
We detect radio emission at sub-parsec scales in NGC 4051 at both 1.6 and 5 GHz. At 1.6 GHz, we detect three sub-mJy components (see Fig. 1). Two of these, separated by 20 parsecs, are clearly associated with the small-scale double structure imaged with the VLA by Ulvestad & Wilson (1984). The third component (0.67 mJy) is symmetric to the easternmost one with respect to the central one, and aligned with the southwestern emission revealed at larger scale. This is also associated with emission at 8.4 GHz as shown by Kukula et al. (1995) and in the top right panel of Fig. 1.
The central component is detected also at 5 GHz, with a moderately steep spectral index (). The upper limit for the source radius is 0.31 pc, which corresponds to , a factor of 50 larger than the measured BLR size ( 0.006 pc, Kaspi et al., 2000).
3.2. NGC 4388
Arcsecond and sub-arcsecond resolution images of this Sy 1.9 galaxy have revealed a complex morphology with a compact, flat spectrum component detected up to 15 GHz (Carral et al., 1990; Falcke et al., 1998), while the only previous VLBI observation of this galaxy resulted in a non detection with the VLBA at 8.4 GHz (Mundell et al., 2000).
We clearly detect the source at 1.6 GHz, with a flux density of 1.3 mJy and an extension of 0.48 pc ( mas). This is in agreement with the lower and upper limits, derived by Mundell et al. (2000) and Carral et al. (1990), respectively, which constrained the emitting region to a size .
The 5 GHz data are difficult to interpret owing to the almost complete lack of data from the Effelsberg-Westerbork and Effelsberg-Jodrell baselines. Since these are the shortest and most sensitive baselines in our array, it is hard to tell whether the non detection has to be ascribed to the large rms noise, the too narrow resolution, or a combination of both. Still, the result remains somewhat surprising in the light of the flat spectral index observed with the VLA.
3.3. NGC 4501
Known also as M 88, NGC 4501 is a Sy 1.9 galaxy hosting an unresolved VLA radio source (HU01). We detected this source at 1.6 GHz, as an unresolved component with a peak brightness of 0.71 mJy beam-1. This corresponds to a brightness temperature in excess of K and a linear size of 0.6 pc (or ).
Our data thus account for a 40% fraction of the VLA detected flux density at 1.4 GHz, suggesting that the radio source is quite compact. The data for this source are subject to the same observational limits reported for NGC 4388, so that it is difficult to tell if the non detection is due to a moderately steep spectral index, or a resolved structure at higher frequency.
3.4. NGC 5033
VLA data at 1.4 and 5 GHz show a slightly resolved core in this Sy 1.5 galaxy, with a short jet-like extension to the East (\al@Ho2001,Perez-Torres2007; \al@Ho2001,Perez-Torres2007). We detect this source at both 1.6 and 5 GHz, revealing an unresolved, flat spectrum component. Indeed, this source shows the flattest spectral index (), the highest brightness temperature limit ( K), and the smallest size limit ( pc, equivalent to ) among our sample.
3.5. NGC 5273
VLA observations of the Sy 1.5 galaxy NGC 5273 had revealed an unresolved component () at 1.4 and 5 GHz, with a rather flat spectral index (, HU01, ). Nagar et al. (1999) had also revealed a 0.6 mJy compact component () at 8.4 GHz.
It is therefore remarkable that our observations do not reveal any emission from the nuclear region of this source at neither 1.6 or 5 GHz. The upper limit peak brightness is Jy beam-1 at 1.6 GHz and Jy at 5 GHz. This implies either a significant resolution of the sub-arcsecond emission ( of the flux density at angular scales ), significant variability (by one order of magnitude), or a combination of both.
4. Discussion and conclusions
With the VLBI observations presented in this letter, we have targeted the faintest and least luminous nuclei among well known local AGN, going to sub-mJy flux densities and radio luminosities around W Hz-1.
These sources belong to a complete sample of nearby Seyfert galaxies, in which previous VLBI observations – albeit limited to the brightest members – had revealed an ubiquitous presence of sub-parsec cores and/or structures. Similar findings had been reported on other relatively bright flat spectrum radio sources in LLAGN; for instance, Nagar et al. (2002) found that almost all LLAGNs in the Palomar sample with S mJy show mas-scale or sub mas-scale radio cores. The 80% detection rate in the present sub-sample extends these findings to the lowest luminosity and flux density regimes.
While the presence of sub-pc scale radio emission appears thus to be ubiquitous, it is remarkable that it accounts only for a fraction between 5% and 40% of the emission detected on scales of a few tens of parsecs (eg. as seen in VLA observations). As a consequence, a large fraction of the parsec scale radio luminosity is emitted in a diffuse region. This could be the case of NGC 4388 and NGC 4501, in which we completely resolve the VLA sources at 5 GHz, but detect them at 1.6 GHz (size mas). Similarly, the non detection of NGC 5273 requires that of the VLA 1.6 GHz flux density is emitted on scales larger than 20 mas (1.6 pc).
Even though much of the intermediate scale emission is resolved out, the majority of the nuclear regions do host compact radio sources at sub-parsec scales. In Table 3, we report the multi-wavelength properties of the sources presented in this letter. The common features in these nuclei are: (i) their extremely low radio luminosity (Cols. 4-6), at the level of the least luminous Seyfert nuclei (such as the sub-mJy source NGC 4395, Wrobel & Ho, 2006); (ii) their extreme radio-quietness, for instance the ratios between the radio and nuclear X-ray emission (Col. 8) are among the lowest ever measured for LLAGN (Panessa et al., 2007; Terashima & Wilson, 2003); and (iii) their low Eddington ratios (Col. 9), a common trait in low luminosity nuclei (Ho, 2009).
Radio emission from LLAGN cores is generally associated with accretion/ejection processes in the vicinity of a supermassive black hole (Falcke et al., 2000; Ulvestad & Ho, 2001; Nagar et al., 2002). While some of the resolved extended emission could be of thermal origin, the small linear scales ( pc) and comparatively high brightness temperatures ( K) measured in our sources suggests that the weakest Seyfert nuclei could also be scaled-down versions of more luminous AGN. In this scenario, the origin of radio emission can be generally attributed to synchrotron emission from the base of a jet coupled with a low-power accretion disk (Falcke & Biermann, 1999). Alternatively, the presence of an ADAF (Narayan & Yi, 1994) is invoked to explain the low luminosity of these sources, although the predicted radio emission often fails to reproduce the data, requiring combined jet/ADAF models (see e.g., Yuan et al., 2002). On average, our results do not seem consistent with the presence of an ADAF alone, on the basis of the observed structures, sizes, flux densities, and spectral indices.
The two sources detected at both 1.6 and 5 GHz (NGC 4051 and NGC 5033) are most easily explained in terms of jet-base/outflow phenomena. First, the detection of three aligned sub-mJy components in NGC 4051 is indeed suggestive of ejection processes. The brightness temperature ( K) does not completely rule out a thermal origin, consistent with the presence of an outflow rather than a relativistic jet, similar to the case of NGC 4395, which shows an elongated low brightness temperature nuclear structure, tracing possible outflow emission (Wrobel & Ho, 2006; Christopoulou et al., 1997). The EVN radio core is also positionally coincident with a low luminosity H2O maser, suggesting that the radio continuum may arise from the inner regions of a molecular disk or from a nuclear wind (Hagiwara, 2007).
As for NGC 5033, its core presents all the hallmarks of a jet-base feature, being detected and unresolved at both at 1.6 and 5 GHz, with a brightness temperature lower limit of K, and a flat spectrum (consistent with ). While these would somewhat be consistent with ADAF expectations, the 5 GHz luminosity is 4 times in excess of what predicted on the basis of the observed L2-10keV luminosity, implying that the ADAF model alone fails to account for the observed radio emission. The presence of a jet or an outflow component is therefore required and more consistent with the data. Indeed, the short jet-like extension found at larger scale with VLA (\al@Ho2001,Perez-Torres2007; \al@Ho2001,Perez-Torres2007) favours the jet-base hypothesis.
With all the caveats related to the unfavourable observing conditions at 5 GHz, the two sources detected only at 1.6 GHz (NGC 4388 and NGC 4501) seem to be also at odds with an ADAF scenario. The non detection at high frequency points to a steep spectral index and/or to a rather extended structure, at scales of or more, in contrast with the flat/inverted spectrum and the compact structure predicted by ADAF models. Although consistent with an angular scale of several mas, thermal emission is also unlikely given the K brightness temperatures observed at 1.6 GHz. NGC 4388 and NGC 4501 are also the only type 1.9 Seyferts in our sample, showing heavily absorbed/weak X-ray spectra (Cappi et al., 2006).
Interestingly, the only undetected source in our sample is NGC 5273, a type 1.5 Seyfert, in which the nucleus is seen directly, displaying broad emission lines and a bright X-ray spectrum (Cappi et al., 2006). Either the VLA emission is resolved out or the source is variable. Indeed, the source was initially not revealed at 8 GHz with the VLA ( mJy, Kukula et al., 1995) and lately detected with mJy by Nagar et al. (1999). The comparison between the X-ray and the EVN radio luminosity upper limit reveals that this source is extremely radio quiet. Indeed, this is the only case in which the radio data are consistent with a pure ADAF accretion mechanism, since our upper limit for this nucleus is 4 times above the radio core luminosity derived from the observed X-rays (Yi & Boughn, 1998).
5. Conclusions
The five Seyfert galaxies presented in this letter are the faintest observed to date among a larger sample, extending the availability of VLBI observations to the regime of mJy flux density. With compact components detected in 4/5 of our sources, we confirm that parsec scales radio emission is almost ubiquitous in Seyfert nuclei.
Despite this common trait, the observational and derived physical parameters display heterogeneous behaviours, not easy to interpret within a common physical scenario. Spectral indices range from quite steep () to slightly inverted () and brightness temperatures between K and K; the emitting regions are either extended or unresolved, in one source accompanied by lobe-like features and in an extreme case not even detected.
As long as the present data set seems generally in favour of jet-like or outflow interpretation for most sources, more data are necessary for a complete understanding of the physical processes at work. The peculiar double/triple morphology of NGC 4051 is certainly worth a dedicated project (e.g. to look for proper motion of the external components); it also seems necessary to constrain the angular size and spectral index of NGC 4388 and NGC 4501 with new 5 GHz data, not affected by the severe failures on short baselines faced by the present observations. Finally, even deeper observations are needed to constrain the viability of an ADAF scenario in NGC 5273, as well as to probe the faintest members of the parent sample.
References
- Barbosa et al. (2006) Barbosa, F. K. B., Storchi-Bergmann, T., Cid Fernandes, R., Winge, C., & Schmitt, H. 2006, MNRAS, 371, 170
- Bietenholz et al. (2004) Bietenholz, M. F., Bartel, N., & Rupen, M. P. 2004, ApJ, 615, 173
- Cappi et al. (2006) Cappi, M., et al. 2006, A&A, 446, 459
- Carral et al. (1990) Carral, P., Turner, J. L., & Ho, P. T. P. 1990, ApJ, 362, 434
- Christopoulou et al. (1997) Christopoulou, P. E., Holloway, A. J., Steffen, W., Mundell, C. G., Thean, A. H. C., Goudis, C. D., Meaburn, J., & Pedlar, A. 1997, MNRAS, 284, 385
- Falcke & Biermann (1999) Falcke, H., & Biermann, P. L. 1999, A&A, 342, 49
- Falcke et al. (2000) Falcke, H., Nagar, N. M., Wilson, A. S., & Ulvestad, J. S. 2000, ApJ, 542, 197
- Falcke et al. (1998) Falcke, H., Wilson, A. S., & Simpson, C. 1998, ApJ, 502, 199
- Gallimore et al. (2004) Gallimore, J. F., Baum, S. A., & O’Dea, C. P. 2004, ApJ, 613, 794
- Giroletti et al. (2005) Giroletti, M., Taylor, G. B., & Giovannini, G. 2005, ApJ, 622, 178
- Hagiwara (2007) Hagiwara, Y. 2007, AJ, 133, 1176
- Ho (2009) Ho, L. C. 2009, ApJ, 699, 626
- Ho & Ulvestad (2001) Ho, L. C., & Ulvestad, J. S. 2001, ApJS, 133, 77
- Kaspi et al. (2000) Kaspi, S., Smith, P. S., Netzer, H., Maoz, D., Jannuzi, B. T., & Giveon, U. 2000, ApJ, 533, 631
- Kukula et al. (1995) Kukula, M. J., Pedlar, A., Baum, S. A., & O’Dea, C. P. 1995, MNRAS, 276, 1262
- Mundell et al. (2000) Mundell, C. G., Wilson, A. S., Ulvestad, J. S., & Roy, A. L. 2000, ApJ, 529, 816
- Nagar et al. (2002) Nagar, N. M., Falcke, H., Wilson, A. S., & Ulvestad, J. S. 2002, A&A, 392, 53
- Nagar et al. (1999) Nagar, N. M., Wilson, A. S., Mulchaey, J. S., & Gallimore, J. F. 1999, ApJS, 120, 209
- Narayan & Yi (1994) Narayan, R., & Yi, I. 1994, ApJ, 428, L13
- Pérez-Torres & Alberdi (2007) Pérez-Torres, M. A., & Alberdi, A. 2007, MNRAS, 379, 275
- Panessa et al. (2007) Panessa, F., Barcons, X., Bassani, L., Cappi, M., Carrera, F. J., Ho, L. C., & Pellegrini, S. 2007, A&A, 467, 519
- Spergel et al. (2003) Spergel, D. N., et al. 2003, ApJS, 148, 175
- Terashima & Wilson (2003) Terashima, Y., & Wilson, A. S. 2003, ApJ, 583, 145
- Ulvestad & Wilson (1984) Ulvestad, J. S., & Wilson, A. S. 1984, ApJ, 285, 439
- Ulvestad & Ho (2001) Ulvestad, J. S., & Ho, L. C. 2001, ApJ, 562, L133
- Ulvestad et al. (2005) Ulvestad, J. S., Wong, D. S., Taylor, G. B., Gallimore, J. F., & Mundell, C. G. 2005, AJ, 130, 936
- Wrobel & Ho (2006) Wrobel, J. M., & Ho, L. C. 2006, ApJ, 646, L95
- Yi & Boughn (1998) Yi, I., & Boughn, S. P. 1998, ApJ, 499, 198
- Yuan et al. (2002) Yuan, F., Markoff, S., & Falcke, H. 2002, A&A, 383, 854
| 1.6 GHz observations | 5 GHz observations | |||
|---|---|---|---|---|
| Galaxy | Date | FWHM | Date | FWHM |
| (mas mas, ∘) | (mas mas, ∘) | |||
| (1) | (2) | (3) | (4) | (5) |
| NGC 4051 | 2007 Jun 6 | 2007 Jun 1 | ||
| NGC 4388 | 2008 Feb 28 | 2008 Mar 10 | ||
| NGC 4501 | 2008 Feb 28 | 2008 Mar 10 | ||
| NGC 5033 | 2007 Jun 6 | 2007 Jun 1 | ||
| NGC 5273 | 2007 Jun 6 | 2007 Jun 1 | ||
Note. — Col. (1): galaxy name. Col. (2): date of 1.6 GHz observation. Col. (3): beam size and orientation at 1.6 GHz. Col. (4): date of 5 GHz observation. Col. (5): beam size and orientation at 5 GHz.
| Galaxy | RA (J2000) | Dec. (J2000) | Size1.6, PA1.6 | Size5, PA5 | ||||
|---|---|---|---|---|---|---|---|---|
| (mas mas, ∘) | (mJy) | (mas mas, ∘) | (mJy) | (K) | ||||
| (1) | (2) | (3) | (4) | (5) | (6) | (7) | (8) | (9) |
| NGC 4051 | 12 03 09.6102 | +44 31 52.678 | ||||||
| 12 03 09.6504 | +44 31 52.848 | |||||||
| 12 03 09.5700 | +44 31 52.572 | |||||||
| NGC 4388 | 12 25 46.7814 | +12 39 43.768 | aaThe 5 GHz upper limits for NGC 4388 and NGC 4501 are rms noise levels measured on images with the same resolution of the 1.6 GHz ones | |||||
| NGC 4501 | 12 31 59.1529 | +14 25 13.169 | aaThe 5 GHz upper limits for NGC 4388 and NGC 4501 are rms noise levels measured on images with the same resolution of the 1.6 GHz ones | |||||
| NGC 5033 | 13 13 27.4711 | +36 35 37.924 |
Note. — Col. (1): galaxy name. Col. (2, 3): absolute coordinates of radio position. Col. (4): size and position angle (PA) at 1.6 GHz. Col. (5): flux density at 1.6 GHz. Col. (6): size and PA at 5 GHz. Col. (7): flux density at 5 GHz. Col. (8): spectral index between 1.6 and 5 GHz. Col. (9): brightness temperature.
| Galaxy | D | Class | Log P1.6 | Log L1.6 | Log L5 | Log LX | Log L5/LX | Log LX/LEdd | Log MBH | Log |
|---|---|---|---|---|---|---|---|---|---|---|
| (Mpc) | (W Hz-1) | (ergs s-1) | (ergs s-1) | (ergs s-1) | () | (pc) | ||||
| (1) | (2) | (3) | (4) | (5) | (6) | (7) | (8) | (9) | (10) | (11) |
| NGC 4051 | 9.3 | S1.2 | 18.7 | 34.9 | 35.0 | 40.8 | 5.80 | 3.41 | 6.11 | 6.89 |
| NGC 4388 | 16.7 | S1.9 | 19.6 | 35.8 | 35.7 | 41.7 | 6.06 | 3.17 | 6.80 | 6.20 |
| NGC 4501 | 16.8 | S1.9 | 19.4 | 35.6 | 35.4 | 39.6 | 4.21 | 6.39 | 7.90 | 5.10 |
| NGC 5033 | 18.7 | S1.5 | 19.4 | 35.7 | 36.2 | 41.1 | 4.90 | 4.31 | 7.30 | 5.70 |
| NGC 5273 | 16.5 | S1.5 | 18.5 | 34.7 | 35.4 | 41.4 | 6.02 | 3.24 | 6.51 | 6.49 |
Note. — Col. (1): galaxy name. Col. (2): galaxy distance. Col. (3): optical classification. Col. (4): monochromatic power at 1.6 GHz. Col. (5): luminosity at 1.6 GHz. Col. (6): luminosity at 5 GHz. Col. (7): X-ray 2-10 keV luminosity. Col. (8): ratio of radio to X-ray luminosity. Col. (9): ratio of X-ray to Eddington luminosity. Col. (10): black hole mass. Col. (11): Schwarzschild radius. Data in cols. (2), (3), (7) and (10) are taken from Panessa et al. (2007), except for NGC 4051, whose distance is from Barbosa et al. (2006).