11email: clio.gielen@ster.kuleuven.be 22institutetext: The Royal Meteorological Institute of Belgium, Department Observations, Ringlaan 3, 1180 Brussels, Belgium 33institutetext: Jodrell Bank Centre for Astrophysics, Alan Turing Building, University of Manchester, Oxford Road, Manchester, M13 9PL, United Kingdom 44institutetext: SUPA, School of Physics and Astronomy, University of St Andrews, North Haugh, St Andrews, Fife KY16 9SS, United Kingdom 55institutetext: Space Telescope Science Institute, 3700 San Martin Drive, Baltimore, MD 21218, USA 66institutetext: Department of Astronomy, University of Virginia, PO Box 3818, Charlottesville, VA 22903-0818, USA 77institutetext: Harvard-Smithsonian Center for Astrophysics, 60 Garden Street, MS 65, Cambridge, MA 02138-1516, USA 88institutetext: UCL-Institute of Origins, Department of Physics and Astronomy, University College London, Gower Street, London WC1E 6BT, United Kingdom 99institutetext: UCL-Institute of Origins, Mullard Space Science Laboratory, University College London, Holmbury St. Mary, Dorking, Surrey RH5 6NT, United Kingdom 1010institutetext: Department of Astronomy, Cornell University, Ithaca, NY 14853-6801, USA 1111institutetext: Leiden Observatory, J.H. Oort Building, Niels Bohrweg 2, 2333 CA Leiden, The Netherlands 1212institutetext: National Radio Astronomy Observatory, 520 Edgemont Road, Charlottesville, VA 22906, USA 1313institutetext: Astrophysics Group, Lennard-Jones Laboratories, Keele University, Staffordshire, ST5 5BG, United Kingdom
Chemical depletion in the Large Magellanic Cloud: RV Tauri stars and the photospheric feedback from their dusty discs. ††thanks: This research has made use of the SIMBAD database, operated at CDS, Strasbourg, France.
Abstract
Aims. By studying the photospheric abundances of 4 RV Tauri stars in the LMC, we test whether the depletion pattern of refractory elements, seen in similar Galactic sources, is also common for extragalactic sources. Since this depletion process probably only occurs through interaction with a stable disc, we investigate the circumstellar environment of these sources.
Methods. A detailed photospheric abundance study was performed using high-resolution UVES optical spectra. To study the circumstellar environment we use photometric data to construct the spectral energy distributions of the stars, and determine the geometry of the circumstellar environment, whereas low-resolution Spitzer-IRS infrared spectra are used to trace its mineralogy.
Results. Our results show that, also in the LMC, the photospheres of RV Tauri stars are commonly affected by the depletion process, although it can differ significantly in strength from source to source. From our detailed disc modelling and mineralogy study, we find that this process, as in the Galaxy, appears closely related to the presence of a stable Keplerian disc. The newly studied extragalactic objects have similar observational characteristics as Galactic post-AGB binaries surrounded by a dusty disc, and are therefore also believed to be part of a binary system. One source shows a very small infrared excess, atypical for a disc source, but still has evidence for depletion. We speculate this could point to the presence of a very evolved disc, similar to debris discs seen around young stellar objects.
Key Words.:
stars: AGB, post-AGB - stars: binaries - stars: circumstellar matter - stars: abundances - Magellanic Clouds1 Introduction
With a distance of 50 kpc (Feast 1999), the Large Magellanic Cloud (LMC) is one of the best galaxies to study stellar evolution. The known distance allows us to calculate the luminosity for stellar sources and it is the ideal laboratory to study physical and chemical processes in an environment with a sub-solar metallicity of Z⊙ (Westerlund 1997). Moreover, it is close enough to allow detailed studies of individual sources using large-aperture ground based telescopes.
Here we focus on a sample RV Tauri stars in the LMC. RV Tauri stars are pulsating evolved stars with a characteristic light curve showing alternating deep and shallow minima. They are located in the high luminosity end of the Population II Cepheid instability strip (Wallerstein 2002). The post-AGB status of RV Tauri stars was a long standing debate, but the detection of circumstellar dust around many objects (Jura 1986), and the detection of extragalactic pulsators and their large derived absolute luminosities, were in line with the expected evolutionary tracks of post-AGB stars. The first extragalactic RV Tauri stars in the LMC were discovered by the MACHO experiment (Alcock et al. 1998).
Reyniers & Van Winckel (2007) and Reyniers et al. (2007) performed a chemical study on two LMC RV Tauri stars, selected from those reported by Alcock et al. (1998), and found that, like in the Galaxy (Van Winckel 2003), post-AGB stars are chemically much more diverse than previously anticipated. One of the stars, MACHO 47.2496.8, proved to be strongly enhanced in s-process elements, in combination with a very high carbon abundance (C/O 2 and 12C/13C 200). The metallicity of [Fe/H] is surprisingly low for a field LMC star. The s-process enrichment is large: the light s-process elements of the Sr-peak are enhanced by 1.2 dex compared to iron ([ls/Fe] ), while for the heavy s-process (Ba-peak) elements, an even stronger enrichment is measured: [hs/Fe] . Lead was not found to be strongly enhanced. The patterns can only be understood assuming a very low efficiency of the 13C pocket (Bonačić Marinović et al. 2007) which is created during the dredge-up phenomenon and the associated partial mixing of protons into the intershell. It was the first detailed study of the s-process of a post-AGB star in an external galaxy.
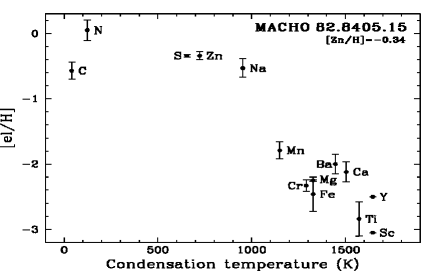
Another object, MACHO 82.8405.15, turned out to be chemically altered by the depletion phenomenon (Reyniers & Van Winckel 2007). Depletion of refractory elements in the photosphere is a chemical process in which chemical elements with a high dust condensation temperature are systematically underabundant (e.g. Maas et al. 2005; Giridhar et al. 2005). The special photospheric abundance patterns are the result of gas-dust separation in the circumstellar environment, followed by re-accretion of only the gas, which is poor in refractory elements. The photospheres become deficient in refractories (as Fe, Ca and the s-process elements), while the non-refractories are not affected. The best abundance tracers of the depletion phenomenon are the Zn/Fe and S/Ti ratios because the elements involved in either ratio have a similar nucleosynthetic formation channel, but have very different condensation temperatures. Intrinsically Fe-poor objects have [Zn/Fe] and [S/Ti] close to solar, which is not the case for depleted objects. With [Fe/H] 2.6, in combination with [Zn/Fe] 2.3 and [S/Ti] 2.5, in MACHO 82.8405.15, there is no doubt that the depletion affected the photosphere of this LMC star very strongly. The very low abundances, as well as the clear correlation with condensation temperature, are shown in Figure 4, which is a reproduction of the figure in Reyniers & Van Winckel (2007).
Photospheric depletion is surprisingly common in Galactic post-AGB stars (e.g. Giridhar et al. 2005; Maas et al. 2005, and references therein). In almost all depleted post-AGB objects, there is observational evidence that a stable circumbinary disc is present (De Ruyter et al. 2006; Van Winckel 2007). The discs are very compact (e.g. Deroo et al. 2006; Deroo 2007) and very likely only found around binary post-AGB stars (e.g. Van Winckel et al. 2009, and references therein).
Also in their infrared spectra, the RV Tauri stars show unique spectral features. One of the best studied Galactic RV Tauri stars is AC Her (Molster et al. 1999). Infrared studies with ISO have shown very strong crystalline silicate bands from 10–50 m. Recent studies with Spitzer show that this strong crystallinity is commonly observed, also in other post-AGB binary sources (Gielen et al. 2008).
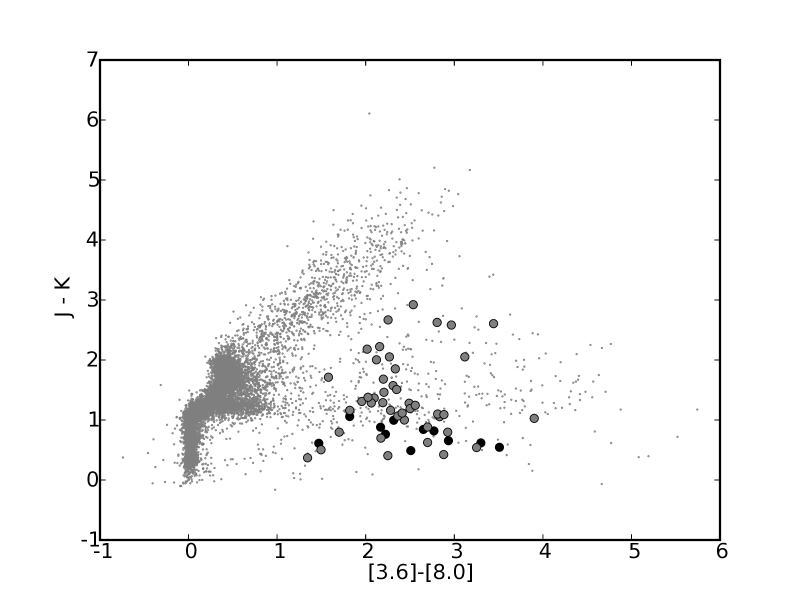
Thanks to the efficient infrared detectors of the Spitzer satellite, very sensitive infrared observations allow us to probe for circumstellar dust, even around individual objects in external galaxies. The SAGE (Surveying the Agents of a Galaxy’s Evolution) Spitzer LMC survey (Meixner et al. 2006) mapped the LMC, using all photometric bands of the Spitzer IRAC (InfraRed Array Camera, Fazio et al. 2004) and MIPS (Multiband Imaging Photometer for Spitzer, Rieke et al. 2004) instruments. This survey resulted in the detection of over 4 million sources. Thanks to the release of this database, we found that the LMC RV Tauri stars as discovered with the MACHO experiment in the visible, indeed have infrared excesses with very similar SED shapes as many Galactic post-AGB binaries (see Fig. 1). Since only those LMC sources with strong enough optical fluxes were selected, some observational bias exists to stars where we see the disc more face-on, since edge-on disc would obscure the star too much.
| Name | other name | (J2000) | (J2000) | [Fe/H] | ||||||
|---|---|---|---|---|---|---|---|---|---|---|
| (h m s) | (∘ ’ ”) | (K) | (cgs) | (%) | L⊙ | (days) | ||||
| MACHO 79.5501.13 | J051418.1-691235 | 05 14 18.1 | -69 12 34.9 | 5750 | 0.5 | -2.0 | 48.5 | |||
| HV 915 | ||||||||||
| MACHO 81.8520.15 | J053254.5-693513 | 05 32 54.5 | -69 35 13.2 | 6250 | 1.0 | -1.5 | 42.1 | |||
| MACHO 81.9728.14 | J054000.5-694214 | 05 40 00.5 | -69 42 14.6 | 5750 | 1.5 | -1.0 | 47.1 | |||
| MACHO 82.8405.15 | J053150.9-691146 | 05 31 51.0 | -69 11 46.4 | 6000 | 0.5 | -2.5 | 46.5 |
Note: The name, equatorial coordinates and (J2000), effective temperature , surface gravity and metallicity [Fe/H] of our sample stars. Also given are the total reddening , the energy ratio , the calculated luminosity (computed by integrating the dereddened photosphere), assuming a distance of kpc, and the period as given in (Alcock et al. 1998).
| Star | Exp. Time | Wavelength | S/N |
|---|---|---|---|
| (sec.) | (nm) | ||
| MACHO 79.5501.13 | 3600 | 375.8 – 498.3 | 70 |
| 670.5 – 1008.4 | 100 | ||
| MACHO 81.8520.15 | 3600 | 478.0 – 680.8 | 70 |
| MACHO 81.9728.14 | 3600 | 478.0 – 680.8 | 65 |
Note: The S/N is measured in the middle of the spectral window covered.
In this contribution we focus on the MACHO RV Tauri objects in the LMC as detected by the MACHO experiment (Alcock et al. 1998), and we connect the chemical studies based on high-resolution optical spectroscopy to the SED energetics and the infrared spectra obtained by Spitzer. Prior to this study, only 1 depleted post-AGB star in the LMC was known. Here we analyse the abundances of 4 more similar sources, testing if depletion is also a common process in the RV Tauri stars of the LMC. As the distance to the LMC is known, we are able to discuss the evolutionary status of these extragalactic sources using their accurate position in the H-R diagram, which sofar has been impossible for Galactic post-AGB stars.
This research was possible thanks to the SAGE-Spec international program (http://sage.stsci.edu/). The goal of this large spectroscopic infrared program is to complement the wealth of photometric data from the SAGE photometric survey, with an extensive spectroscopic follow-up programme using the infrared IRS spectrograph aboard of Spitzer (Kemper et al., 2009, submitted). The main goal of the survey is to determine the composition, origin and evolution, and observational characteristics of interstellar and circumstellar dust and its role in the LMC. A total of about 200 stars, in all stages of stellar evolution, HII and diffuse regions were observed in Spitzer-IRS and MIPS-SED mode.
2 Observations and data reduction
2.1 Optical high-resolution programme
The optical high-spectral-resolution data were obtained with the UVES (Dekker et al. 2000) spectrograph mounted on the Nasmith focus of UT2 of the VLT, in February 2005 in visitor mode under mediocre sky conditions.
To cover a wide spectral domain, two wavelength settings of the spectrograph were used: one with the dichroic, to use both arms of the spectrograph simultaneously (Dic2 860+437 nm setting) and one centered on 580 nm using only the red arm. The detailed log of the observations is given in Table 2. The run was plagued with bad weather conditions, so for none of the three stars discussed here, we could obtain the full optical spectral window.


The data were reduced using the dedicated UVES context in the MIDAS software package and include the standard reduction steps of echelle data reduction. Spectral normalisation was performed by fitting polynomial functions through interactively determined continuum windows. For the lower S/N data, optimal extraction was used. Sample spectra are shown in Figures 3 and 3.
2.2 IRS-spectroscopy
In the follow-up programme SAGE-Spec to the SAGE LMC survey several post-AGB sources, showing RV Tauri-like behaviour, were observed with the IRS instrument aboard the Spitzer Space Telescope (Houck et al. 2004; Werner et al. 2004). IRS was used in low-resolution SL and LL spectroscopic staring modes. SL (=5.3-14.5 m) and LL (=14-37 m) spectra have a resolving power of R= 100. Exposure times were chosen to achieve a S/N ratio of around 60 for the SL modes, LL modes have a S/N of 30. For a detailed description of the observations we refer to Kemper et al. (in prep.). Spitzer-IRS spectra for three of our sample stars are shown in Figure 5.
The extraction was done from intermediate droop data products, version S17.0.4 up to S18.0.2, as delivered by the Spitzer Science Center. SMART reduction package tools (Higdon et al. 2004), and reduction tools developed by the FEPS (the Spitzer legacy program “Formation and evolution of planetary systems”) team, were used for further extraction. For a detailed description of the different reduction steps we refer to Hines et al. (2005). The spectra are background-corrected and bad/hot-pixel-corrected and a fixed-width aperture is used for the extraction. The spectra are then combined and order matched. For the defringing of the spectra the IRSFRINGE (Lahuis & Boogert 2003) package was used. Calibration spectral response functions were calculated, derived from standard stars and corresponding stellar models.
In this contribution we limit the IRS spectral analyses to those objects for which we also have UVES data.
![[Uncaptioned image]](/html/0910.5624/assets/x4.png)
![[Uncaptioned image]](/html/0910.5624/assets/x5.png)
![[Uncaptioned image]](/html/0910.5624/assets/x6.png)
![[Uncaptioned image]](/html/0910.5624/assets/x7.png)
![[Uncaptioned image]](/html/0910.5624/assets/x8.png)
![[Uncaptioned image]](/html/0910.5624/assets/x9.png)
3 Photospheric abundance results
One of the features of the spectra displayed in Figures 3 and 3 is the general weakness of metallic lines. The LMC RV Tauri stars are proven to be spectral analogues of the Galactic RV Tauri star AC Her, also shown in the figures. This Galactic RV Tauri star is considered to be one of the prototypes of its pulsation class, but it is also known to be a strongly depleted object (Giridhar & Ferro 1989; Van Winckel et al. 1998).
Our analysis of the final product spectra is similar to those used in Van Winckel & Reyniers (2000) and Reyniers et al. (2007). We performed a line identification using the solar line lists of Thevenin (1989, 1990). Weak lines, on the linear part of the curve-of-growth are the best tracers of the chemical conditions of the photospheres, as they are not saturated and are formed deeper in the photosphere, where possible non-LTE effects are known to be weaker. For the chemical analysis, we only used lines with strength below 150 mÅ and accurate oscillator strengths (Van Winckel & Reyniers 2000).
As the stars seem chemically peculiar, we performed a relative abundance analysis using the Galactic RV Tauri star AC Her. The quantified abundance analysis was performed using the latest Kurucz model atmospheres of the appropriate metallicity (http://kurucz.harvard.edu/), and the LTE abundance analysis program MOOG (April 2002 version) written by Prof. C. Sneden (http://verdi.as.utexas.edu/moog.html).

3.1 MACHO 79.5501.13
3.1.1 Photospheric model
To determine the most appropriate photospheric model, we combined the classical spectroscopic methods with Balmer line-profile fitting and the constraints from the star being a member of the LMC. We refer to Reyniers et al. (2007) for a more detailed description of the methods.
The spectroscopic analysis assumes that the excitation of the Fe I lines follow a Boltzman distribution and by requiring that the abundances of lines from low and high excitation levels must be the same, a spectroscopic temperature is deduced. The gravity is determined by imposing that the abundance of different ions must be the same (e.g. Van Winckel & Reyniers 2000). For pulsating stars with large amplitude pulsations and associated shocks, this method turns out to be too sensitive to non-LTE effects. We therefore refined the effective temperature and gravity determination by fitting the Balmer and line profiles with synthetic models. As the object is known to be a member of the LMC, we assumed the distance to be 50 kpc, and determined the absolute luminosity after dereddening of the colours. A surface gravity estimate is then deduced using a standard mass for a post-AGB star of 0.6 M⊙. With this process, we find best values of K, and a [Fe/H] abundance of . Typical errors are K for the , and 0.5 for the .
3.1.2 Chemical analysis
The results of our quantitative analyses are given in Table 3 and displayed in Figure 4. The spectral coverage of this object is not optimal as the intermediate spectral window of UVES with central wavelength of 580 nm was not observed. The results of our chemical study clearly confirm that the object is a spectral analogue to AC Her. Its Fe abundance is low ([Fe/H] ), even for the LMC, but this does not reflect the initial abundance. A clear correlation is found when depicting the abundance of a given element to its condensation temperature (Fig. 4): refractory elements are strongly depleted. Zn and S may be tracing the original metallicity which was likely to be around . This indicates that the object was originally slightly metal deficient compared to the overall metallicity of the LMC.
Also in this LMC source, the depletion is found to be affecting the chemical content of the photosphere very strongly. For Sc, an element with one of the highest condensation temperatures, the abundance is about 250 times lower than what we would expect from a star of this initial metallicity ([Fe/H]original ). Also Y and Ce, the only two s-process elements for which we found lines suitable for abundance determination, the underabundance is a factor 80 and 20 respectively.
3.2 MACHO 81.8520.15
3.2.1 Photospheric model
The spectrum of MACHO 81.8520.15 is of high quality which is reflected in the number of lines used in our chemical analyses and in a smaller line-to-line scatter.
The star is found to be somewhat hotter than previous objects. This is also seen directly in the spectra, more specifically in the ratio of line strengths between lines of ionised versus neutral ions of the same species. Our best spectroscopic estimate is a K with a gravity of .
3.2.2 Chemical analysis
Also in MACHO 81.8520.15, the abundances are significantly lower than the mean metallicity of the LMC. Assuming the Zn abundance reflects the initial condition, a [Zn/H] = 1.4 makes MACHO 81.8520.15 too a star of rather low initial metallicity.
The abundance pattern shown in Figure 4 does show a general trend with condensation temperature. The main difference is that the C abundance turned out to be very high. The carbon abundance is determined on the basis of 8 lines which show little internal scatter, so the high C abundance is certainly significant.
The low Zn abundance can be interpreted either as the initial value, which means that the object increased its C abundance by a factor of 10, or it is the C abundance which reflects the initial conditions. In this case the depletion has been efficient to such low temperatures that even the Zn abundance was affected.
| MACHO 79.5501.13 | MACHO 81.9728.14 | MACHO 81.8520.15 | ||||||||||||
| ion | N | [el/H] | N | [el/H] | N | [el/H] | Sun | Tcond | ||||||
| C i | 6 | 7.65 | 0.12 | -0.92 | 2 | 7.52 | 0.04 | -1.05 | 8 | 8.08 | 0.08 | -0.49 | 8.57 | 40. |
| Na i | 2 | 5.07 | 0.21 | -1.26 | 6.33 | 958. | ||||||||
| Mg i | 2 | 6.09 | 0.33 | -1.45 | 1 | 6.78 | -0.76 | 2 | 6.34 | 0.05 | -1.20 | 7.54 | 1336. | |
| Si i | 2 | 6.48 | 0.20 | -1.06 | 4 | 6.69 | 0.12 | -0.85 | 7.54 | 1310. | ||||
| Si ii | 2 | 6.18 | 0.06 | -1.36 | 7.54 | 1310. | ||||||||
| S i | 5 | 6.71 | 0.06 | -0.62 | 7.33 | 664. | ||||||||
| Ca i | 2 | 4.67 | 0.13 | -1.69 | 9 | 5.25 | 0.14 | -1.11 | 12 | 4.86 | 0.19 | -1.50 | 6.36 | 1517. |
| Sc ii | 1 | 0.19 | -2.98 | 2 | 1.15 | 0.17 | -2.02 | 5 | 1.23 | 0.20 | -1.94 | 3.17 | 1659. | |
| Ti i | 1 | 3.13 | -1.89 | 5.02 | 1582. | |||||||||
| Ti ii | 6 | 2.20 | 0.25 | -2.82 | 4 | 3.26 | 0.29 | -1.76 | 16 | 3.03 | 0.18 | -1.99 | 5.02 | 1582. |
| Cr i | 3 | 3.85 | 0.02 | -1.82 | 3 | 4.39 | 0.30 | -1.28 | 4 | 3.91 | 0.16 | -1.76 | 5.67 | 1296. |
| Cr ii | 10 | 3.76 | 0.16 | -1.91 | 11 | 4.70 | 0.18 | -0.97 | 12 | 4.05 | 0.19 | -1.62 | 5.67 | 1296. |
| Mn i | 6 | 4.34 | 0.21 | -1.05 | 2 | 4.32 | 0.31 | -1.07 | 1 | 3.58 | -1.81 | 5.39 | 1158. | |
| Fe i | 41 | 5.85 | 0.15 | -1.66 | 73 | 6.43 | 0.16 | -1.08 | 122 | 5.92 | 0.17 | -1.59 | 7.51 | 1334. |
| Fe ii | 14 | 5.56 | 0.22 | -1.95 | 14 | 6.47 | 0.15 | -1.04 | 23 | 5.95 | 0.15 | -1.56 | 7.51 | 1334. |
| Ni i | 2 | 4.27 | 0.22 | -1.98 | 10 | 4.99 | 0.11 | -1.26 | 6 | 4.47 | 0.12 | -1.78 | 6.25 | 1353. |
| Zn i | 3 | 3.98 | 0.04 | -0.62 | 1 | 3.38 | -1.22 | 1 | 3.21 | -1.39 | 4.60 | 726. | ||
| Y ii | 1 | -0.26 | -2.50 | 1 | 0.49 | -1.75 | 2 | 0.11 | 0.01 | -2.13 | 2.24 | 1659. | ||
| Zr ii | 1 | 0.74 | -1.86 | 2.60 | 1741. | |||||||||
| Ba ii | 4 | 0.23 | 0.06 | -1.90 | 2.13 | 1455. | ||||||||
| Ce ii | 1 | -0.28 | -1.86 | 1.58 | 1478. | |||||||||
| Eu ii | 2 | 0.12 | 0.08 | -0.40 | 0.52 | 1356. | ||||||||
Note: The explanation of the columns is as follows: N gives the number of lines used; is the absolute abundance derived (N(X)/N(H))+12; is the line-to-line scatter; and [el/H] is the abundance relative to the Sun. For the references of the solar abundances needed to calculate the [el/H] values: see Reyniers & Van Winckel (2007). The dust condensation temperatures are taken from Lodders (2003), and references therein. They are computed using a solar abundance mix at a pressure of 10-4 atm. The abundance table of MACHO 82.8405.15 can be found in Reyniers et al. (2007).
3.3 MACHO 81.9728.14
3.3.1 Photospheric model
We obtained a good spectroscopic solution for the model atmosphere parameters, showing that this star is a slightly cooler analogue of the previous object. The only Balmer lines covered are Hβ and Hα and these are affected by emission cores which make them unsuitable for model parameter determination.
3.3.2 Chemical analysis
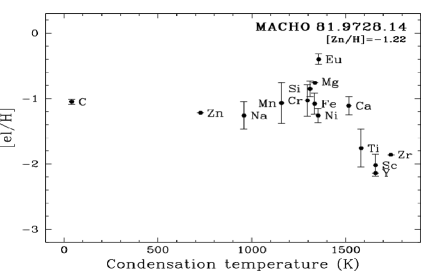
The chemical pattern displayed by this star is depicted in Figure 4. This object has the poorest quality spectrum, and the line-to-line scatter in the abundances remains quite high.
The abundance distribution is different in this object, since we find the Zn abundance to be very low ([Zn/H] ). Interpreting this as the initial chemical condition, this star is intrinsically of low metallicity, even for the LMC. The abundance pattern is flat except for the refractory elements with the highest condensation temperature. These refractories show abundances which are significantly lower, down by up to relative to the [Zn/H] abundance. Therefore, we interpret these abundances as affected by depletion. The effect has been marginal and only detectable for elements with the highest condensation temperature.
The metallicity dependence of the depletion phenomenon has been found in the Galactic sample as well (Giridhar et al. 2005; Maas et al. 2005), and may be confirmed here: at low initial metallicity, the effect is strongly reduced and often only visible for elements with the highest condensation temperature.
4 Infrared spectroscopy
Depletion was found to be very efficient in the RV Tauri stars for which we have UVES spectra available. In the Galaxy, depletion patterns are abundant but only around stars where stable dusty discs are present (with some noticeable exceptions like BD+39.4926 (Van Winckel et al. 1995)). We therefore used the infrared catalogue released by the SAGE team (Meixner et al. 2006) to investigate the spectral energy distributions. We used the photospheric parameters from our UVES study and dereddened the data until the match between the photometry and the Kurucz photospheric model was optimal. The SED figures are shown in Figure 4. It is clear that also around these objects, which were selected on the basis of their light curve, circumstellar dust is present with specific colours typical of discs (De Ruyter et al. 2006). In the next sections we discuss our analysis of the spectrophotometric data we obtained for these objects.
4.1 MACHO 81.9728.14
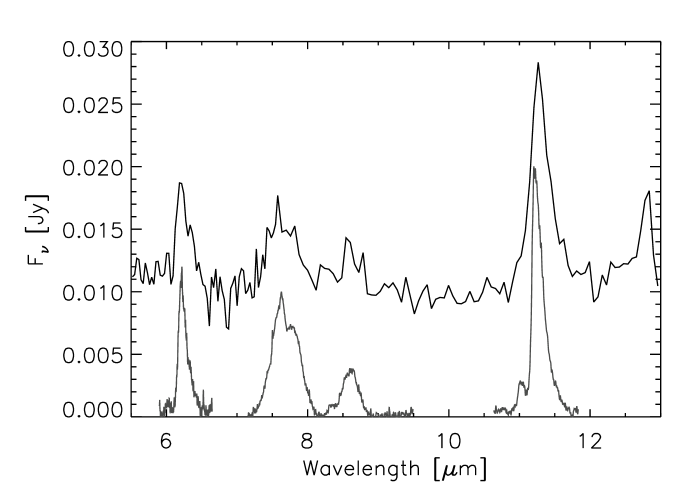
For this star we unfortunately only possess spectral information in the m region. The spectrum is unique in our sample, and is dominated by strong emission features at and 14 m, which can be identified as PAH emission (Tielens 2008, and references therein).
The C-C stretching and bending modes produce features with typical central wavelengths at 6.2 and 7.7 m. The 8.6 m feature is due to C-H in-plane bending modes and features longward of 10 m can be attributed to C-H out-of-plane bending modes.
Following the classification as described in Peeters et al. (2002), which is based on the central wavelength of the main emission bands, the PAH emission bands are characterised as being of class A. This class A is usually linked to very processed PAHs residing in interstellar material, directly illuminated by a star.
PAH bands are seen in the infrared spectra of several post-AGB sources, but surprisingly almost always together with features of silicate dust species. Such mixed chemistry objects include HR 4049 (Johnson et al. 1999; Dominik et al. 2003; Antoniucci et al. 2005; Hinkle et al. 2007), and HD 44179, the central star of the ‘Red Rectangle’ (Men’shchikov et al. 2002; Cohen et al. 2004). In these stars the PAH emission is classified as of class B. Class B sources are mainly associated with circumstellar material. HR 4049 and HD 44179 are both binary post-AGB stars surrounded by an O-rich circumstellar disc. The PAH carriers, however, do not reside in the disc of these objects, but in a more recent C-rich bipolar outflow. In Gielen et al. (2009) we describe some post-AGB sources where the less frequent class C PAHs are seen. Class A PAH features are seen in other post-AGB sources, both post-AGB stars with evidence for a carbon-rich chemistry, e.g. IRAS 16594-4656 (García-Hernández et al. 2006; van de Steene et al. 2008) as in mixed-chemistry sources, e.g. IRAS 16279-4757 (Molster et al. 1999; Matsuura et al. 2004). In these two examples there is evidence for a dusty disc/torus and bipolar outflow in which the PAH carriers reside.
If the PAH carriers reside in the disc then there has to be a formation process where carbon-rich species can be formed in an oxygen-rich environment. Such a scenario was proposed by Jura et al. (2006) to explain PAH features observed in the oxygen-rich giant HD 233517. The spectrum of MACHO 81.9728.14 does not show any other features due to C-rich or O-rich dust species, such as SiC or silicates, although it cannot be ruled out that these features are present at longer wavelengths, for which no Spitzer-IRS spectrum is available unfortunately. Our chemical analysis of the photosphere shows that although the photosphere is affected by depletion, there is no evidence for carbon enhancement by a previous 3rd dredge-up episode.
4.2 MACHO 79.5501.13 and MACHO 82.8405.15
MACHO 79.5501.13 and MACHO 82.8405.15 both show clear emission around 10 m. This emission feature is mainly due to amorphous silicates, namely olivine (Mg2xFe2(1-x)SiO4) and pyroxene (MgxFe1-xSiO3), which peak near 9.8 m and 18 m. The observed shoulder near 11.3 m is likely caused by crystalline silicate dust, namely forsterite (Mg2SiO4), the Mg-rich end member of the olivine family. We cannot exclude the presence of other amorphous silicate species, but will focus here only on the olivine and pyroxene members.
MACHO 79.5501.13 shows a strong slope in the continuum, and no strong features of amorphous or crystalline silicates at wavelengths longer than 10 m are detected. Some emission might be seen around and 23 m. This shows that there is little cool silicate dust in the circumstellar environment. The peak at 36 m is probably a reduction residual at the end of the spectrum.
In MACHO 82.8405.15 some small features around and 33 m are seen. These features can also be attributed to the crystalline silicates forsterite and enstatite (MgSiO3). The 18 m amorphous silicate bump is detected, albeit not very strongly.
4.3 Comparison with infrared spectra of the Galactic sample
Both MACHO 79.5501.13 and MACHO 82.8405.15 show a strong similarity to our sample of Galactic post-AGB sources, with similar spectral shapes and emission of amorphous and crystalline silicates. On average the Galactic sources do show a slightly higher fraction of crystallinisation.
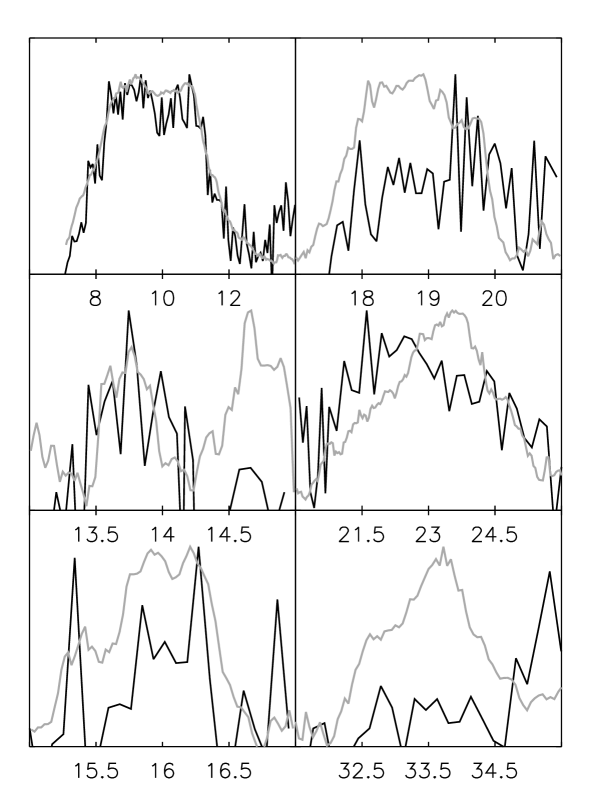
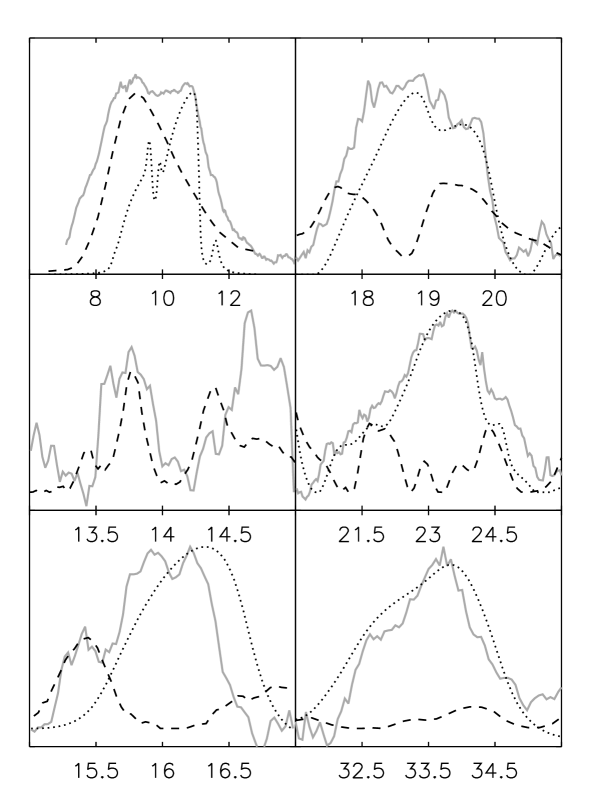
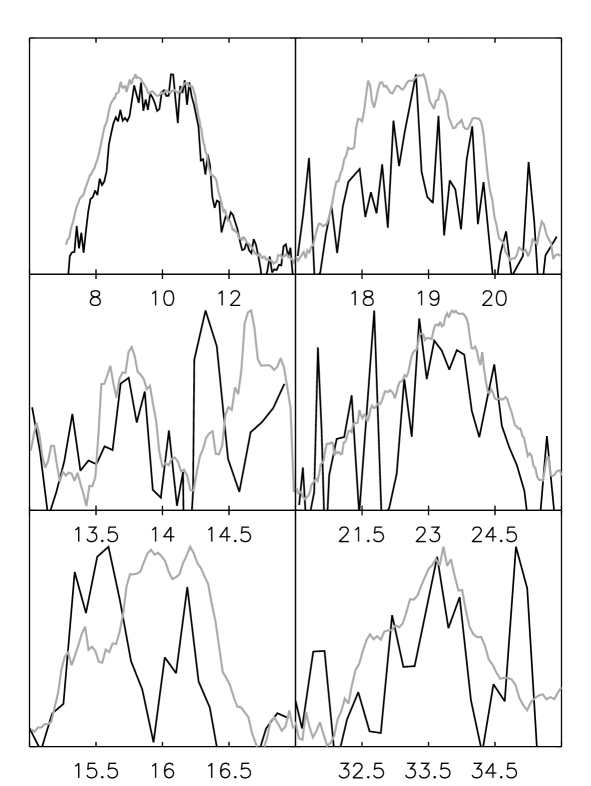
In our previous study of the Galactic sample stars (Gielen et al. 2008) we defined 6 different complexes ( m complexes), and compared these to a calculated mean complex for the 21 Galactic sources. We will use this calculated mean Galactic spectrum to compare the observed features of these extragalactic sources. For this we subtracted a linear continuum from the different complexes and then normalised them. The comparison can be seen in Figure 7.
The low signal-to-noise for these stars makes it hard to make a detailed comparison, but we can already see that several features appear in both Galactic and extragalactic sources. For both stars the 10 m complex is very similar to the Galactic mean complex, although it seems slightly narrower in MACHO 82.8405.15. The double-peaked structure due to the presence of both amorphous silicates and forsterite is apparent in both stars.
Around 14 m we do find the enstatite 13.8 m, and possibly the 14.4 m, feature, but not the strong unidentified feature near 14.8 m which is seen in the Galactic stars.
For the Galactic sample we found the forsterite 16 m to be shifted to shorter wavelengths. In MACHO 79.5501.13 we do not find strong evidence for this feature. The peak at 16 m could be due to forsterite but note that the noise is large and enhanced by the continuum subtraction and normalisation. A strong feature at 15.5 m is seen in MACHO 82.8405.15. If this is due to forsterite the feature is shifted to even shorter wavelengths in this star. In both stars there appear features around 19 and 23 m, but only MACHO 82.8405.15 shows a strong resemblance to the Galactic mean feature. The 23 m complex in MACHO 79.5501.13 seems to be tilted to shorter wavelengths, instead of longer wavelengths. Whether this points to the presence of a large enstatite fraction is unclear, since the other enstatite features seem to be only minimal.
The 33.6 m forsterite feature is clearly present in MACHO 82.8405.15, albeit rather noisy, but can not be detected in MACHO 79.5501.13.
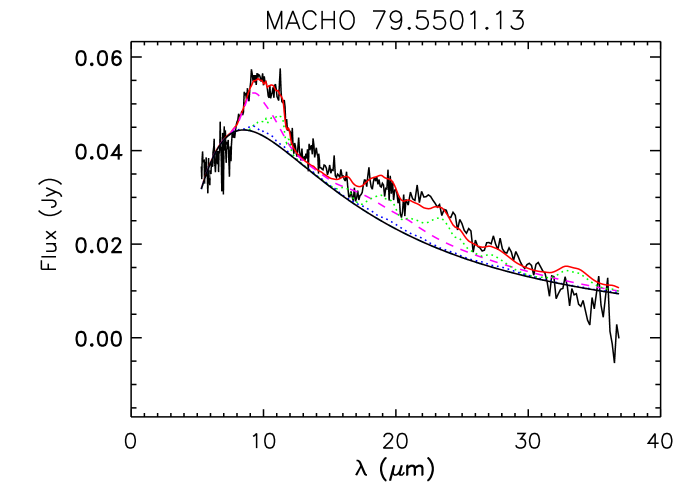
5 Full spectral fitting
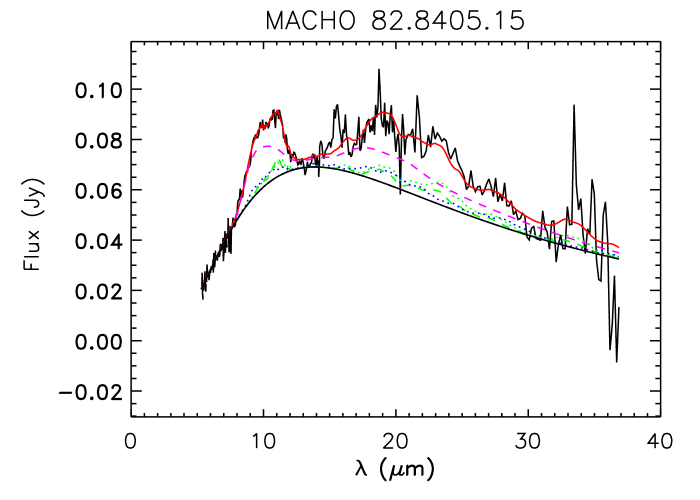
For MACHO 79.5501.13 and MACHO 82.8405.15 we perform a full spectral fitting as already discussed in Gielen et al. (2008). In short we assume the flux to originate from an optically thin region, so we can make linear combinations of the absorption profiles to calculate the model spectrum. We allow for different dust species, grain sizes (from 0.1 to 4.0 m) and dust approximations, such as Mie theory (Toon & Ackerman 1981), Gaussian Random Fields (GRF, Shkuratov & Grynko 2005) and Distribution of Hollow Spheres (DHS, Min et al. 2005) approximations. We allow for two temperatures to describe the spectrum. Unfortunately, the lack of strong emission features and the low signal-to-noise makes it hard to distinguish between different models, and the calculated values are thus quite similar. Similar to what was seen in the Galactic sources (Gielen et al. 2008), we find that the best fit is obtained using irregular grain compositions, and not a spherical description, such as applied in Mie theory. In Figure 8 and Table 4, we give the result of our calculated best fit, consisting of small grains ( m) in GRF dust approximation.
For MACHO 79.5501.13 we find a good fit to the observed spectrum. The model continuum does not follow the strong downward trend, meaning that the modelled continuum temperature is too high. The 10 m feature is nicely reproduced, as are the small bumps near 15, 19 and 23 m. The small feature around 13.5 m is not explained by the model but could be due to enstatite, and was also seen in some Galactic sources. We find the model produces a significant 33.6 m forsterite feature, which is not observed and thus shows that the amount of cool dust is overestimated.
A good fit is also obtained for MACHO 82.8405.15. Again the 10 m feature and features near 20 m are very well fitted. There appears to be a rather strong feature at 15.5 m which is not reproduced in the model. Forsterite has an emission feature at 16 m and for the Galactic sources we already found that this features seemed to be shifted to shorter wavelengths (Gielen et al. 2008), but the strength was generally well reproduced. The feature observed here however seems to be too strong to be explained by this shifted forsterite feature alone.
| Name | Fraction | Fraction | |||||
|---|---|---|---|---|---|---|---|
| (K) | (K) | - | (K) | (K) | - | ||
| MACHO 79.5501.13 | 5.1 | ||||||
| MACHO 82.8405.15 | 3.9 |
| Name | Olivine | Pyroxene | Forsterite | Enstatite | Continuum |
|---|---|---|---|---|---|
| Small - Large | Small - Large | Small - Large | Small - Large | ||
| MACHO 79.5501.13 | |||||
| MACHO 82.8405.15 |
Note: Listed are the , dust and continuum temperatures and their relative fractions. The abundances of small (0.1 m) and large (2.0 m) grains of the various dust species are given as fractions of the total mass, excluding the dust responsible for the continuum emission. The last column gives the continuum flux contribution, listed as a percentage of the total integrated flux over the full wavelength range. The errors were obtained using a monte-carlo simulation based on 100 equivalent spectra. Details of the modelling method are explained in Gielen et al. (2008).
6 2D disc modelling
To model the energetics of the observed RV Tauri stars, we use the disc model as described in Gielen et al. (2007), namely the 2D radiative transfer passive disc model given by Dullemond et al. (2001) and Dullemond & Dominik (2004). The first part of this model consists of a 2D radiative transfer code which calculates the dust opacity and temperature. The gas component of the disc is assumed to be thermally coupled to the dust. The second part of the model is a 1D hydrostatic equilibrium code which calculates iteratively the vertical density profile. Stellar input parameters are the mass, luminosity and effective temperature of the star. For the total mass of the system we use a value of 1 M⊙. We use the estimated luminosity as given in Table 1, which corresponds to a distance kpc. The disc parameters consist of the disc size, total mass, the different dust components and grain sizes and the surface-density distribution , with the power-law index and a normalisation factor at reference distance . The disc is made up from an astronomical silicate dust mixture with a gas-to-dust ratio of 100. We use a value for the surface-density distribution, as expected in a disc environment. The inclination is kept fixed at .
The observed feature-to-continuum ratio can be used to determine the grain sizes in the disc, as small grains will produce much stronger feature-to-continuum ratios than larger grains. For the Galactic sources we already modelled (Gielen et al. 2007, 2009), we opted to include an extra opacity source such as metallic iron and/or larger grains (up to 20 m), but for these extragalactic stars we need to use considerably smaller grain sizes, ranging from 0.1 m to m. In the Galactic sources, we found grain growth to be very efficient in a disc environment. This will produce dust particles with larger grain sizes, which will settle towards the midplane. This will cause the disc to be inhomogeneous, consisting of a disc made up from small grains and a cool midplane of larger grains.
For a few stars in the Galactic sample we possessed submillimetre data showing a blackbody slope from 60 m to 850 m, pointing to the presence of extremely large grains, up to centimetre size or larger. The presence of such large grains in the disc can not be confirmed for these LMC stars since we lack data longwards of 40 m.
The models are calculated using the canonical gas-to-dust ratio of 100. Since this value for the LMC may very well be higher (Gordon et al. 2003) because of the overall lower metallicity, we tested how a higher ratio influences the disc structure. Increasing the gas-to-dust ratio means that dust formation and grain growth were less effective, and will thus give less pronounced dust signatures. We find that using a gas-to-dust ratio of 400, we need to increase the total disc mass by about a factor to get a similar dust mass, and thus to get a similar fit to observed infrared dust features. Changing the gas-to-dust ratio does not strongly influence the disc structure itself so the scaleheight of the disc is not very dependent on the gas-to-dust ratio.
As noted in Gielen et al. (2007, 2009) the models are quite degenerate and equally fitting models with slightly different sizes, total masses and surface-density distributions can be found. Interferometric measurements, combined with the disc model, are invaluable to constrain further the disc geometry (Gielen et al. 2009). Unfortunately, the stars are too distant and too faint for current interferometric facilities, like the MIDI and AMBER instruments on the VLTI.
| grain size | ||||
|---|---|---|---|---|
| m | AU | M⊙ | ||
| MACHO 79.5501.13 | 1 | -1.5 | ||
| MACHO 81.9728.14: S | 2 | -1.5 | ||
| MACHO 81.9728.14: C | 0.6 | -1.0 | ||
| MACHO 82.8405.15 | 6 | -1.3 |
Note: Given are the used grain-size distribution, the inner and outer radius (-), the total disc mass for the homogeneous disc model and the surface-density distribution power law . For MACHO 81.9728.14 we give both the results of the silicate disc model (S), and the carbon disc model (C).
6.1 MACHO 79.5501.13
For MACHO 79.5501.13 we find we need a very small outer radius ( AU) to fit the observed SED. This could already have been deduced from the spectrum, where the strong downward slope of the continuum pointed to the presence of little cool dust in the disc. A good fit was obtained by using an outer radius of 30 AU and an inner radius of 10 AU. With these radii the inner rim has a temperature of 1200 K, close to the canonical dust sublimation temperature for silicates ( K). The result of our modelling is shown in Figure 4.
We find that at longer wavelengths the observed Spitzer spectrum falls more quickly than the model (even within the error bars), which still overestimates the amount of cool dust. The observed infrared spectrum at the longest wavelengths is typically less reliable so we would need longer wavelength photometric observations to confirm the very steep slope at longer wavelengths detected in the infrared spectrum.
6.2 MACHO 81.9728.14
Modelling the SED of MACHO 81.9728.14 using the 2D disc model is less straightforward. The main problem lies in the fact that we only possess the PAH dominated Spitzer spectrum from m, and no information at longer wavelengths. In other post-AGB sources the observed PAH carriers do not reside in the disc but in a more recent outflow, and so we cannot use the disc model to reproduce this part of the spectrum. Moreover, PAHs are small and subject to single photon heating effects, so they are not in equilibrium.
If we do try to fit the SED with a standard silicate disc, we find that the model gives a strong 10 m silicate feature, which should have been detected in the Spitzer spectrum. If the PAH features do come from the disc, then the silicate grains must be either very large, to avoid producing a strong silicate feature, or very optically thick. Some small grains, however, have to be present to explain the observed near-IR excess. Another explanation would be that the disc is made up from another, probably carbon-rich, dust species. The chemical composition of the photosphere does not show evidence for a possible strong carbon enhancement.
A disc consisting of 5 m grains, and with inner and outer radii of 7 and 100 AU, proves a good fit to the observed spectrum. A similar fit however can be found using a carbon-rich disc, with grain sizes of m and a disc size of AU. The result of our modelling is shown in Figure 4.
6.3 MACHO 82.8405.15
The 2D disc model also provides a good fit to the observed SED of MACHO 82.8405.15. For this star we find an inner radius around 17 AU. At this distance the inner rim reaches a temperature of 1000 K, slightly below the dust sublimation temperature. The outer radius is less well constrained, but we find that it cannot be as small as in MACHO 79.5501.13. In this star we see a clear 20 m silicate feature, which can only be reproduced using an outer radius AU, with a value of for the surface-density distribution. The result of our modelling is shown in Figure 4.
6.4 MACHO 81.8520.15
The light curve of MACHO 81.8520.15 was studied by Alcock et al. (1998). The classification of the light curve is uncertain but the period of 42.1 days makes it, together with the calculated stellar parameters, a possible RV Tauri candidate. This star has a very low amplitude light curve with slight variability in the depth of its minima, but the period seems to be relatively stable. Alcock et al. (1998) suggest that it also might be classified as a long-period, low-amplitude W Vir pulsator.
Looking at the spectral energy distribution of MACHO 81.8520.15 (Fig. 4), we see that the star has a very small infrared excess, starting near 8 m. This is very different from the typical strong infrared excesses seen in RV Tauri stars.
The small infrared excess shows that some circumstellar material is present, but it remains unclear what the exact location, geometry and origin of this material is.
Interestingly the stellar photosphere is depleted. Photospheric chemical depletion is the result of a process which seems to occur only in objects surrounded by a dusty disc (see introduction), so we have at least indirect evidence that such a stable disc must be, or must have been, present around this object.
The actual SED mimics that of a debris disc around younger stellar objects. These stars are surrounded by a very evolved circumstellar disc, which still contains trace amounts of dust and likely planetesimals of other macroscopic objects. These disc have been cleared of most of their original gas content. Debris discs have been found around main-sequence stars of all spectral types (e.g. Bryden et al. 2006; Chen et al. 2006).
As the photosphere is depleted, one could speculate the dust excess seen in MACHO 81.8520.15 as also coming from a very evolved and processed disc. Unfortunately, the lack of more photometric or spectroscopic data at long wavelengths makes it impossible to model the circumstellar environment of this star.
7 Discussion
The stellar parameters derived from high-resolution optical spectra, combined with ample photometric data, allow for a good estimate of the total reddening of the object. The high luminosities and the effective temperature prove the suspected post-AGB nature of these stars. All sample stars have effective temperatures ranging from 5750 to 6250 K and luminosities between 4000 and 5000 L⊙, assuming a typical LMC distance of 50 kpc.
Our chemical study shows that, also in the LMC, the photospheres of RV Tauri stars are commonly affected by the depletion process. The analysis of the Spitzer observations shows that, in the LMC as well as in the Galaxy, this depletion process is very closely related to the presence of a stable, dusty circumstellar disc in the system in which dust processing has been very active. The postulated long life-time of the dusty disc near the luminous star is a favourable circumstance for the gas-dust separation to occur, and for subsequent gas accretion (Waters et al. 1992).
For three sample stars we possess Spitzer low-resolution infrared spectra. Two sample stars have spectra strongly resembling our previously studied Galactic post-AGB disc sources, with clear emission features due to amorphous and, in lesser degree, crystalline silicates. The atmospheric abundances, combined with the infrared spectral characteristics and the evidence for dust processing, show that RV Tauri stars in the LMC have, on average, very similar observational characteristics to the dusty RV Tauri stars in our own Galaxy.
Based on our very limited sample here, the depletion patterns as observed in the LMC differ significantly from star to star, as was also observed in the Galactic sample.
The most remarkable object in the infrared is MACHO 81.9728.14, which is dominated by emission peaks due to PAHs and does not show evidence for the presence of oxygen-rich dust species. In the photosphere, there is no evidence for an enhanced carbon abundance. The object shows some evidence of depletion, but only marginally so. The abundance pattern is flat with abundances around and and with depletion affecting only the elements of the highest condensation temperature. With a [C/H] (based on two lines), the carbon follows this trend, and we interpret this total distribution as coming from an object with low initial metallicity. Despite this low initial metallicity, the dust excess is significant and the / of 53% shows that the inner rim of the dusty disc covers a wide solid angle as seen from the star. The PAH carriers can be categorised as being of class A, which are the strongly processed interstellar PAHs. So far, it remains unclear whether the PAH carriers reside in the disc, or more likely, in an outflow from the central star.
Also the abundance pattern of MACHO 81.8520.15 is remarkable. The star shows a very high [C/Zn] ratio and a very clear correlation of the underabundances with the condensation temperature. If we interpret the high [C/Zn] value as due to depletion, the Zn abundance does not reflect the initial condition, but must also be affected by gas-dust separation and subsequent accretion. This is remarkable as Zn is an element with one of the lower dust condensation temperatures. The alternative interpretation, in which MACHO 81.8520.15 is an intrinsically low metallicity object and carbon is enhanced by the 3rd dredge-up, is problematic: in such a scenario the s-process elements should be strongly enhanced as well, which is clearly not observed.
Interestingly MACHO 81.8520.15 has a very small infrared excess, which seems to contradict the presence of a stable dusty disc. However, as the star is depleted we postulate that a disc must have been present at some time during its evolution. The SED does show a resemblance to the debris discs seen around young stellar objects. In these debris discs, grain growth has already formed dust particles of considerable size (rocks and possibly even planetesimals), and the gas component has been removed. If there is a disc around MACHO 81.8520.15 which is now strongly evolved, this would be the first time this late stage of disc evolution has been seen around a post-AGB star. The low Zn abundance would then indicate that the active gas-dust separation and accretion of the cleaned gas also takes place in colder regions of the evolving disc.
MACHO 79.5501.13 and MACHO 82.8405.15 are very similar in photospheric chemical composition, SED, and in infrared spectral appearance to the strongly depleted Galactic objects. The underabundance in some elements is a factor of 1000 smaller than the solar value. The initial metallicity of both objects is harder to recover, but the flat abundance distribution of C, Zn, S and Na suggests that both stars have an intrinsic metallicity of about 0.5, which is only slightly lower than the average value of the LMC.
The spectral energy distributions of the sample stars are well modelled using a passive disc model. The inner radius is close to the dust sublimation radius for all stars, while the outer radius is poorly constrained, but a good fit is obtained with outer radii around AU. We find, in comparison to most Galactic sources, that there is no need for an extra opacity source, such as metallic iron or larger grains, to reproduce the observed feature-to-continuum ratio of the dust emission. This could be an effect of the lower metallicity of the LMC sample which reduces the formation of metallic iron. Dust formation itself, and the subsequent processing, has been efficient enough to produce the large scale height needed for explaining the infrared luminosity. Unfortunately, we lack submillimetre data to probe the component of large grains. Individual crystalline silicate bands do show some differences from the Galactic mean spectrum. To deduce whether this is a general trend in the LMC, and thus points to a different dust composition, grain size or dust model, we need to considerably enlarge the LMC sample. This will be done in a future study. This extension of the sample will hopefully give a wider range in evolutionary phases in the post-AGB history of these sources, which we then hope to relate to other observed parameters, such as element abundances, disc parameters or infrared mineralogy.
8 Conclusions
Clearly the formation of stable dusty discs and the significant feedback of this disc on the central star is not exclusive to our Galaxy alone. Four out of five LMC RV Tauri objects, for which we have high-resolution data, are found to be strongly affected by the depletion process in which the atmospheres became poor in refractory elements. Moreover, the infrared colours and spectral data show that three sources are surrounded by a highly processed, stable disc in which dust processing has been efficient. In one source PAH particles are formed, while there is no other evidence for intrinsic carbon enhancement in the photosphere. This object is intrinsically the most metal poor object of the sample. For MACHO 81.8520.15 we only found a small dust excess at 8 m and we could interpret this as evidence for strong disc evolution. In this star, even the Zn abundance is affected by depletion which means that the gas-dust separation occurred at low temperatures.
Overall the RV Tauri stars in the LMC display many characteristics of their Galactic peers. Whether these extragalactic stars also reside in a binary system remains unclear with the available data at hand. The low magnitude of these stars does not allow for a long-term radial velocity monitoring programme but, given the strong similarities to the Galactic binaries, a binary evolutionary channel is very likely needed to understand the RV Tauri stars in the LMC as well.
Acknowledgements.
CG and HVW acknowledge support of the Fund for Scientific Research of Flanders (FWO) under the grant G.0178.02. and G.0470.07. This work is based on observations made with the Spitzer Space Telescope, which is operated by the Jet Propulsion Laboratory, California Insitute of Technology, under a contract with NASA.References
- Alcock et al. (1998) Alcock, C., Allsman, R. A., Alves, D. R., et al. 1998, AJ, 115, 1921
- Antoniucci et al. (2005) Antoniucci, S., Paresce, F., & Wittkowski, M. 2005, A&A, 429, L1
- Bonačić Marinović et al. (2007) Bonačić Marinović, A., Lugaro, M., Reyniers, M., & van Winckel, H. 2007, A&A, 472, L1
- Bryden et al. (2006) Bryden, G., Beichman, C. A., Trilling, D. E., et al. 2006, ApJ, 636, 1098
- Chen et al. (2006) Chen, C. H., Sargent, B. A., Bohac, C., et al. 2006, ApJS, 166, 351
- Cohen et al. (2004) Cohen, M., Van Winckel, H., Bond, H. E., & Gull, T. R. 2004, AJ, 127, 2362
- De Ruyter et al. (2006) De Ruyter, S., Van Winckel, H., Maas, T., et al. 2006, A&A, 448, 641
- Dekker et al. (2000) Dekker, H., D’Odorico, S., Kaufer, A., Delabre, B., & Kotzlowski, H. 2000, in Society of Photo-Optical Instrumentation Engineers (SPIE) Conference Series, Vol. 4008, Society of Photo-Optical Instrumentation Engineers (SPIE) Conference Series, ed. M. Iye & A. F. Moorwood, 534–545
- Deroo (2007) Deroo, P. 2007, PhD thesis, KULeuven
- Deroo et al. (2006) Deroo, P., Van Winckel, H., Min, M., et al. 2006, A&A, 450, 181
- Dominik et al. (2003) Dominik, C., Dullemond, C. P., Cami, J., & van Winckel, H. 2003, A&A, 397, 595
- Dullemond & Dominik (2004) Dullemond, C. P. & Dominik, C. 2004, A&A, 417, 159
- Dullemond et al. (2001) Dullemond, C. P., Dominik, C., & Natta, A. 2001, ApJ, 560, 957
- Fazio et al. (2004) Fazio, G. G., Hora, J. L., Allen, L. E., et al. 2004, ApJS, 154, 10
- Feast (1999) Feast, M. 1999, PASP, 111, 775
- García-Hernández et al. (2006) García-Hernández, D. A., Manchado, A., García-Lario, P., et al. 2006, ApJ, 640, 829
- Gielen et al. (2009) Gielen, C., Van Winckel, H., Matsuura, M., et al. 2009, A&A
- Gielen et al. (2008) Gielen, C., Van Winckel, H., Min, M., Waters, L. B. F. M., & Lloyd Evans, T. 2008, A&A, 490, 725
- Gielen et al. (2007) Gielen, C., Van Winckel, H., Waters, L. B. F. M., Min, M., & Dominik, C. 2007, A&A, 475, 629
- Giridhar & Ferro (1989) Giridhar, S. & Ferro, A. A. 1989, Journal of Astrophysics and Astronomy, 10, 47
- Giridhar et al. (2005) Giridhar, S., Lambert, D. L., Reddy, B. E., Gonzalez, G., & Yong, D. 2005, ApJ, 627, 432
- Gordon et al. (2003) Gordon, K. D., Clayton, G. C., Misselt, K. A., Landolt, A. U., & Wolff, M. J. 2003, ApJ, 594, 279
- Higdon et al. (2004) Higdon, S. J. U., Devost, D., Higdon, J. L., et al. 2004, PASP, 116, 975
- Hines et al. (2005) Hines et al. 2005, “FEPS Data Explanatory Supplement”, Version 3.0, Pasadena SSC
- Hinkle et al. (2007) Hinkle, K. H., Brittain, S. D., & Lambert, D. L. 2007, ApJ, 664, 501
- Houck et al. (2004) Houck, J. R., Roellig, T. L., van Cleve, J., et al. 2004, ApJS, 154, 18
- Johnson et al. (1999) Johnson, J. J., Anderson, C. M., Bjorkman, K. S., et al. 1999, MNRAS, 306, 531
- Jura (1986) Jura, M. 1986, ApJ, 309, 732
- Jura et al. (2006) Jura, M., Bohac, C. J., Sargent, B., et al. 2006, ApJ, 637, L45
- Lahuis & Boogert (2003) Lahuis, F. & Boogert, A. 2003, in SFChem 2002: Chemistry as a Diagnostic of Star Formation, ed. C. L. Curry & M. Fich, 335–+
- Lodders (2003) Lodders, K. 2003, ApJ, 591, 1220
- Maas et al. (2005) Maas, T., Van Winckel, H., & Lloyd Evans, T. 2005, A&A, 429, 297
- Matsuura et al. (2004) Matsuura, M., Zijlstra, A. A., Molster, F. J., et al. 2004, ApJ, 604, 791
- Meixner et al. (2006) Meixner, M., Gordon, K. D., Indebetouw, R., et al. 2006, AJ, 132, 2268
- Men’shchikov et al. (2002) Men’shchikov, A. B., Schertl, D., Tuthill, P. G., Weigelt, G., & Yungelson, L. R. 2002, A&A, 393, 867
- Min et al. (2005) Min, M., Hovenier, J. W., & de Koter, A. 2005, A&A, 432, 909
- Molster et al. (1999) Molster, F. J., Yamamura, I., Waters, L. B. F. M., et al. 1999, Nature, 401, 563
- Peeters et al. (2002) Peeters, E., Hony, S., Van Kerckhoven, C., et al. 2002, A&A, 390, 1089
- Reyniers et al. (2007) Reyniers, M., Abia, C., van Winckel, H., et al. 2007, A&A, 461, 641
- Reyniers & Van Winckel (2007) Reyniers, M. & Van Winckel, H. 2007, A&A, 463, L1
- Rieke et al. (2004) Rieke, G. H., Young, E. T., Engelbracht, C. W., et al. 2004, ApJS, 154, 25
- Shkuratov & Grynko (2005) Shkuratov, Y. G. & Grynko, Y. S. 2005, Icarus, 173, 16
- Thevenin (1989) Thevenin, F. 1989, A&AS, 77, 137
- Thevenin (1990) —. 1990, A&AS, 82, 179
- Tielens (2008) Tielens, A. G. G. M. 2008, ARA&A, 46, 289
- Toon & Ackerman (1981) Toon, O. B. & Ackerman, T. P. 1981, Appl. Opt., 20, 3657
- van de Steene et al. (2008) van de Steene, G. C., Ueta, T., van Hoof, P. A. M., Reyniers, M., & Ginsburg, A. G. 2008, A&A, 480, 775
- Van Winckel (2003) Van Winckel, H. 2003, ARA&A, 41, 391
- Van Winckel (2007) —. 2007, Baltic Astronomy, 16, 112
- Van Winckel et al. (2009) Van Winckel, H., Lloyd Evans, T., Briquet, M., et al. 2009, ArXiv e-prints
- Van Winckel & Reyniers (2000) Van Winckel, H. & Reyniers, M. 2000, A&A, 354, 135
- Van Winckel et al. (1995) Van Winckel, H., Waelkens, C., & Waters, L. B. F. M. 1995, A&A, 293, L25
- Van Winckel et al. (1998) Van Winckel, H., Waelkens, C., Waters, L. B. F. M., et al. 1998, A&A, 336, L17
- Wallerstein (2002) Wallerstein, G. 2002, PASP, 114, 689
- Waters et al. (1992) Waters, L. B. F. M., Trams, N. R., & Waelkens, C. 1992, A&A, 262, L37
- Werner et al. (2004) Werner, M. W., Roellig, T. L., Low, F. J., et al. 2004, ApJS, 154, 1
- Westerlund (1997) Westerlund, B. E. 1997, Cambridge Astrophysics Series, 29