11email: saglia@mpe.mpg.de 22institutetext: Universitäts-Sternwarte München, Scheinerstrasse 1, D-81679 München, Germany
The old and heavy bulge of M31
We present new optical long-slit data along 6 position angles of the bulge region of M31. We derive accurate stellar and gas kinematics reaching 5 arcmin from the center, where the disk light contribution is always less than 30%, and out to 8 arcmin along the major axis, where the disk makes 55% of the total light. We show that the velocity dispersions of McElroy (1983) are severely underestimated (by up to 50 km/s). As a consequence, previous dynamical models have underestimated the stellar mass of M31’s bulge by a factor 2. As a further consequence, the light-weighted velocity dispersion of the galaxy grows to 166 km/s and to 170 km/s if also rotation is taken into account, thus reducing the discrepancy between the predicted and measured mass of the black hole at the center of M31 from a factor 3 to a factor 2. The kinematic position angle varies with distance, pointing to triaxiality, but a quantitative conclusion can be reached only after simultaneous proper dynamical modeling of the bulge and disk components is performed. We detect gas counterrotation near the bulge minor axis. We measure eight emission-corrected Lick indices. They are approximately constant on circles. Using simple stellar population models we derive the age, metallicity and -element overabundance profiles. Except for the region in the inner arcsecs of the galaxy, the bulge of M31 is uniformly old ( Gyr, with many best-fit ages at the model grid limit of 15 Gyr), slightly -elements overabundant () and at solar metallicity, in agreement with studies of the resolved stellar components. The predicted u-g, g-r and r-i Sloan color profiles match reasonably well the dust-corrected observations, within the known limitations of current simple stellar population models. The stellar populations have approximately radially constant mass-to-light ratios ( for a Kroupa IMF), in agreement with stellar dynamical estimates based on our new velocity dispersions. In the inner arcsecs the luminosity-weighted age drops to 4-8 Gyr, while the metallicity increases to above 3 times the solar value. Starting from 6 arcmin from the center along the major axis, the mean age drops to Gyr, with slight supersolar metallicity ( dex) and element overabundance ( dex), for a mass-to-light ratio . Diagnostic diagrams based on the [OIII]/H and [NI]/H emission line equivalent widths (EWs) ratios indicate that the gas is ionized by shocks outside 10 arcsec, but an AGN-like ionizing source could be present near the center. We speculate that a gas-rich minor merger happened some 100 Myr ago, causing the observed minor axis gas counterrotation, the recent star formation event, and possibly some nuclear activity.
Key Words.:
Galaxies: individual: M31, kinematics and dynamics, stellar content1 Introduction
This is the first of two papers presenting new optical spectra for the bulge of M31 to study its stellar populations and assess its triaxiality through dynamical modeling. Here we present the new data and constrain the stellar populations.
In the past 50 years papers studying the dynamics of our neighbour galaxy M31 have been published on a regular basis, discussing gas kinematics, both by optical spectroscopy (Boulesteix et al. Boulesteix87 (1987), Pellet Pellet76 (1976)), and in HI (Kent 1989a , Braun Braun91 (1991), Chemin et al. Chemin09 (2009) and references therein), stellar kinematics concentrating on the central regions to probe the black hole dynamics (Bender et al. Bender05 (2005)) or considering the whole bulge (McElroy McElroy83 (1983)). The data are used to construct dynamical models of the galaxy (Widrow et al. Widrow03 (2003), Klypin, Zhao and Somerville Klypin02 (2002)) and possibly probe the tridimensional distribution of its stellar components. The question of the triaxiality of M31 bulge has been posed early on (Stark Stark77 (1977), Gerhard Gerhard86 (1986)) and is of significant importance for the understanding of M31, but a definitive quantitative modeling of both photometry and kinematics is still missing. A bar could also be present (Athanassoula & Beaton Athanassoula06 (2006), Beaton et al. Beaton07 (2007)). Moreover, investigations of the stellar populations of the central regions of M31 through the measurement of Lick indices have been performed (Davidge Davidge97 (1997)). They indicate the presence of a young and metal rich population in the inner arcsecs of the galaxy. Parallely, studies of the resolved stellar population of the bulge of M31 have assessed that the global stellar population of the M31 bulge must be as old as the bulge of Milky Way, resolving previous claims of younger ages as due to crowding problems (Stephens et al. Stephens03 (2003)).
Two considerations convinced us of the necessity to collect new optical spectroscopic information for the bulge of M31, in addition to the old age of the dataset of McElroy (McElroy83 (1983)). The first one is the start of PAndromeda, an extensive monitoring campaign of M31 with the PanSTARRS-1 telescope and camera system (Kaiser Kaiser04 (2004)), that is in principle able to deliver hundreds of pixel lensing events, probing both bulge and disk regions. Detailed stellar population and dynamical models, based on accurate spectral information, are needed to interpret these events as due to a compact baryonic dark matter component (the so-called MACHOs) rather than self-lensing of stellar populations (Kerins et al. Kerins01 (2001), Riffeser et al. Riffeser06 (2006)). The second is the development of new modeling techniques of both simple stellar populations and stellar dynamical systems. On the one hand, the interpretation of Lick indices (Worthey et al Worthey94 (1994)) in terms of the most recent simple stellar population models (Maraston Maraston98 (1998), Maraston05 (2005)) that take into account the variation of Fe] (Thomas, Maraston and Bender TMB03 (2003)), allows the accurate determination of the stellar population ages, metallicities and overabundances, and therefore the prediction of stellar mass-to-light ratios. On the other hand, new dynamical modeling codes, like N-MAGIC (De Lorenzi et al. DeLorenzi07 (2007)) allow the flexible dynamical modeling of triaxial structures, optimally exploiting the information contained in the line-of-sight velocity distributions that modern programs for the analysis of the galaxy optical spectra are able to extract (Bender, Saglia and Gerhard BSG94 (1994)), well beyond the mean velocities and velocity dispersions of McElroy (McElroy83 (1983)).
In the following we discuss our new spectroscopic observations of the bulge of M31. A future paper (Morganti et al. Morganti09 (2009)) will report on the dynamical modeling. In Sect. 2 we present the observations and the data reduction. In Sec. 3 we derive the stellar and gas kinematics and the strengths of the absorption and emission lines. In Sec. 4 we discuss the modeling of the new spectroscopic data. We analyze the stellar population in Sect. 4.1 and discuss previous axisymmetric dynamical models of the bulge of M31 in Sect. 4.2. Sect. 4.3 considers the possible excitation sources compatible with the observed emission line EW ratios. We draw our conclusions in Sect. 5.
2 Observations and Data reduction
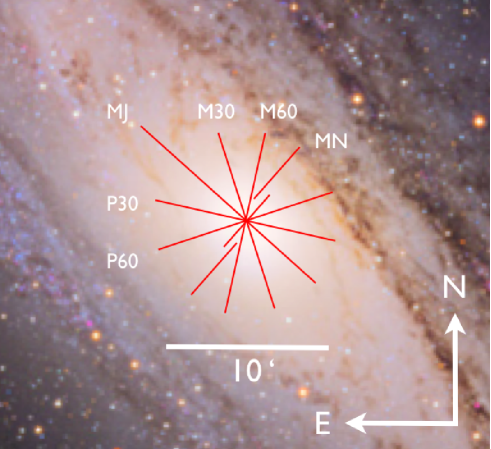
We observed the bulge of M31 using the Low Resolution Spectrograph (LRS, Hill et al. Hill98 (1998)) at the Hobby-Eberly Telescope equipped with a 1.5 arcsec wide, 3.5 arcmin long slit, the E2 grism and a Ford Aerospace CCD device, with 30721024 15m pixels (usable range 2750900 pixels) and a scale of 0.235 arcsec per pixel. We covered the wavelength range Å with 0.36 Å per pixel and an instrumental resolution of km/s. During the period 10th-19th August 2007 (see Table 1) M31 was observed in service mode along 6 position angles. The seeing varies from 1.3 to 2.5 arcsec. At each position angle three 10 minutes exposures were taken, the first one centered on the galaxy, the second one shifted to the west (decreasing RA) 3.5 arcmin in the slit direction, and the third one shifted to the east (increasing RA) 3.5 arcmin in the slit direction. Finally, on the 15th of September 2009 we collected a 20 minutes exposure along the major axis, shifted 5 arcmin from the center in the eastern direction. Fig. 1 shows the distribution of the 19 slit M31 pointings on the sky with the naming convention given in Table 1, where MJ shortens for the major axis and MN for the minor axis. The position angle of the bulge MJ axis is fixed from our 2MASS photometry (see Sect. 4.2 and Fig. 13). Note that this is different from the position angle of the major axis of the disk of M31 (, de Vaucoulers devauc58 (1958)). Apart from the MN pointings, the slits with a given position angle are always well aligned and with small overlaps, providing spectra out to 5 arcmin from the center. In addition, the MJEE slit probes the major axis out to 8 arcmin from the center. The MNE and MNW are slighly shifted from the MNC central slit (by 34” orthogonal to the slit to the west and to the east respectively). Furthermore, 10 minutes exposures of empty sky regions were also taken, as well as several kinematic and Lick standard stars, wiggled and trailed along the slit.
| Date | Name | PA | FWHM | Comment |
|---|---|---|---|---|
| (deg.) | (“) | |||
| 20070812 | MJC | 48 | 1.40 | Centered major axis |
| 20070812 | MJE | 48 | 1.46 | Eastern major axis |
| 20070812 | MJW | 48 | 1.38 | Western major axis |
| 20090915 | MJEE | 48 | 2.13 | Eastern major axis |
| 20090915 | SKYMJEE | 48 | - | Empty sky |
| 20070813 | P30C | 78 | 1.59 | Centered |
| 20070813 | P30E | 78 | 1.91 | Eastern |
| 20070813 | P30W | 78 | 2.08 | Western |
| 20070813 | P30SKY | 90 | - | Empty sky |
| 20070814 | MNC | 138 | 1.28 | Centered minor axis |
| 20070814 | MNE | 138 | 1.36 | Eastern minor axis, shifted |
| 20070814 | MNW | 138 | 1.41 | Western minor axis, shifted |
| 20070814 | MNSKY | 90 | - | Empty sky |
| 20070816 | P60C | 108 | 1.61 | Centered |
| 20070816 | P60E | 108 | 1.57 | Eastern |
| 20070816 | P60W | 108 | 1.63 | Western |
| 20070816 | P60SKY | 90 | - | Empty sky |
| 20070817 | M30C | 18 | 2.53 | Centered |
| 20070817 | M30E | 18 | 2.21 | Eastern |
| 20070817 | M30W | 18 | 2.21 | Western |
| 20070819 | M60C | 168 | 1.43 | Centered |
| 20070819 | M60E | 168 | 1.78 | Eastern |
| 20070819 | M60W | 168 | 1.94 | Western |
| 20070819 | M60SKY | 90 | - | Empty sky |
The data reduction followed the usual procedure described in Mehlert et al. (Mehlert00 (2000)) under MIDAS with some additional steps needed to correct for the spectral alignment and the anamorphism of the LSR spectrograph. After bias subtraction and flatfielding, the 2∘ tilt between the wavelength direction and the CCD was removed through appropriate rebinning. Two bad columns at positions corresponding to Å were corrected by interpolation. The wavelength calibration used Cd and Ne calibration lamps frames taken at the end of each night, and a 3rd order polynomial fitting 9 lines and giving an rms of less than one pixel. Residual overall shifts in the starting wavelength of the wavelength calibrated science frames were corrected by referencing to the 5577 Å sky line. After filtering cosmic ray hits, the science frames were rebinned to a logarithmic wavelength scale. The sky subtraction for the M31 frames was performed through the four empty sky frames available. The averaged sky continuum amounted to 3.5 counts per pixels (varying by at most 10% from frame to frame). This is only 14% of the averaged flux measured at the extreme ends of the MJE and MJW slits, 23% at the end of the MJEE slit, but 44% at those of the MNE and MNW slits. In contrast, the flux per pixel in the strongest sky line at 5577 Å is 160 counts with variations to up to 50% from frame to frame. We constructed a line-free and a line-only average sky spectrum for each of the available sky frames and subtracted it with proper scaling from the corresponding science frames. The average of the available sky frames was used for the nights without empty sky observations. Stars were extracted tracing the peaks corresponding to their trails across the slit as a function of wavelength and averaging over a 10 pixel wide window. The final spectra are averages of the extracted ones. This procedure also allowed us to map the anamorphic distortions of the spectrograph, that at the short and long wavelengths bend the spectra upwards in the upper end and downwards in the lower end of the slit (see Fig. 2). Moreover, the sky was estimated at the ends of the slit and subtracted. Finally, the anamorphic mapping was used to rebin the sky subtracted frames of M31 on a cartesian grid. Finally, the M31 spectra were rebinned in the radial direction to give approximately constant signal-to-noise ratio.

3 Kinematics and Line Strengths
The stellar kinematics were derived using the Fourier Correlation Quotient technique (Bender Bender90 (1990)), with the addition of an iterative procedure to correct for the emission clearly detected in the H line and the [OIII] and [NI] doublets, similar to the method of Sarzi et al. (Sarzi06 (2006)). The best fitting stellar template convolved to the derived line-of-sight velocity distribution (LOSVD) is subtracted from the galaxy spectra. Five Gaussian functions are fitted to the residuum spectrum, in correspondence to the two doublets and the H line. Six parameters are derived: the recessional velocity of the gas emission and its velocity dispersion (determined by fitting just the [OIII] lines), plus 5 normalization factors. The best-fitting Gaussians are subtracted from the original spectrum and the stellar kinematics is derived a second time, using the wavelength range Å. The final parameters of the gas emission are derived by fitting the original spectrum where the improved, iterated best-fitting stellar kinematic template is subtracted. The best-fitting template is chosen from a pool of single star spectra and simple stellar population models from Vazdekis (Vazdekis99 (1999)), by minimizing the between the galaxy and the LOSVD-convolved template, and results in an almost mismatch-free description of the galaxy spectrum. An 8th order polynomial is used to subtract the continuum and the first and last three channels in Fourier space are filtered out. Monte Carlo simulations as described in Mehlert et al. (Mehlert00 (2000)) are performed to derive the final errors on the estimated parameters and estimate the size of systematic errors. With the choice of continuum fitting and filtering given above the systematic errors are always smaller than the statistical ones. We have tested that none of the results presented below depend on the precise order of the continuum subtraction within the errors, as soon as it is larger than 6. The measured kinematics are very precise, with statistical errors on velocities of the order of 2 km/s, of the order of 3 km/s (i.e. 3%), on , less than 0.02 on and . We investigated the systematic effects of sky subtraction by deriving the kinematics from frames where % of the sky was additionally subtracted. At the extreme ends of the slits differences in velocities up to 5 km/s, in up to 12 km/s, in up to 0.03 and in up to 0.05 are seen.
Fig. 3 shows the derived stellar line of sight recessional velocity , velocity dispersion and Hermite-Gauss coefficients and following Bender, Saglia and Gerhard (BSG94 (1994)). Overall, the kinematic data are symmetric with respect to the center within the errors. Stellar rotation is detected at some level at all position angles. Along the major axis (MJ) it keeps rising with increasing distance from the center, reaching km/s at the last measured point at arcmin, where the disk light dominates. The velocity dispersion reaches a maximum of 170 km/s at arcsec from the center. Along or near the major axis, where stellar rotation is clearly detected, the parameter anticorrelates (as expected, see Bender et al. BSG94 (1994)) with the stellar velocity out to arcsec, to change sign at larger distances (see discussion in Sect. 4.2). In the inner arcsecs the signature of the central supermassive black hole is clearly visible, with a steep increase in velocity and velocity dispersion. In the inner region, the comparison with the kinematics of van der Marel et al. (vdMarel94 (1994)) along the major and minor axis shows overall good agreement; however they measure systematically () lower values of . Since we agree with the data of Kormendy and Bender (Kormendy99 (1999)) and we do not expect residual systematics from our Monte Carlo tests (see above), we trust our profiles as the correct ones. The comparison with McElroy (McElroy83 (1983)) shows that this old dataset gives seriously underestimated velocity dispersions. The smallest differences are observed along the minor axis. The discrepancy is probably due to the sensitivity of McElroy analysis’s method to the disk light contamination (see discussion in Sect. 4.2). The recessional velocities are in reasonable agreement.

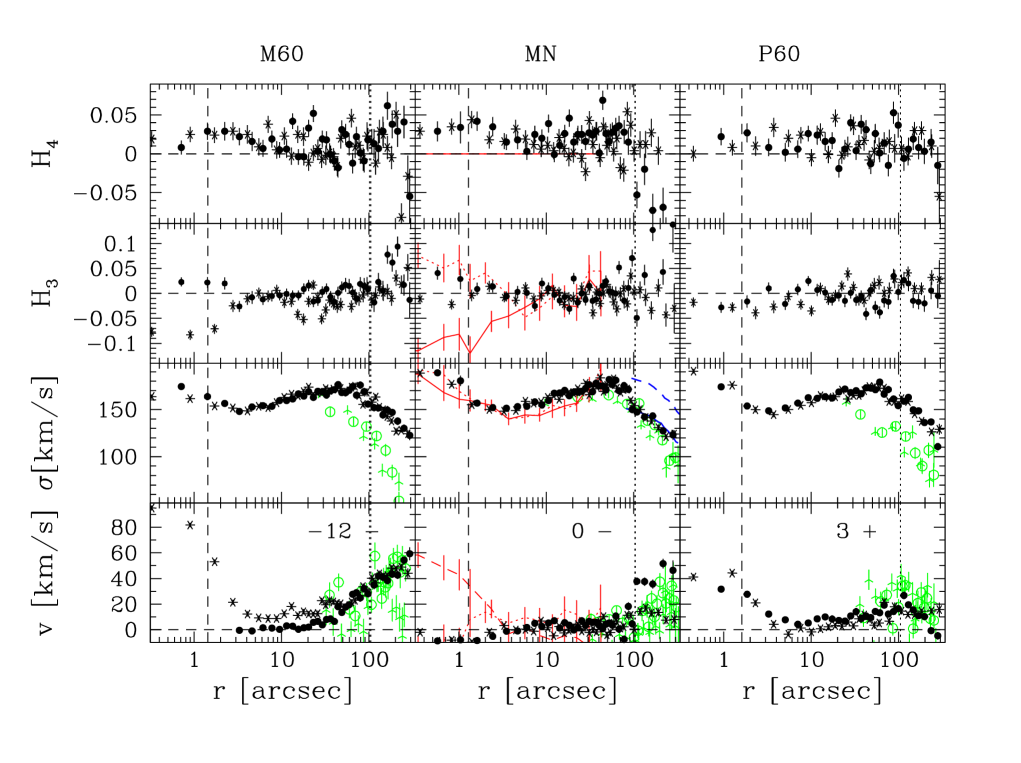

As a consequence, the mean velocity dispersion used to predict the mass of the black hole at the center of M31 (160 km/s, Gültekin et al. Gueltekin09 (2009), corresponding to , 3 times smaller than the measured value) has to be revised upwards. Fig. 4, top, shows that the (angle averaged) light-weighted velocity dispersion converges to 166 km/s and to almost 170 km/s if the rotational velocity is added in quadrature. This results in a black hole mass only a factor 2 smaller than observed. The same figure, bottom, shows that lower values are derived as a function of the distance from the center, if the weighting is performed using the total isophotal light.
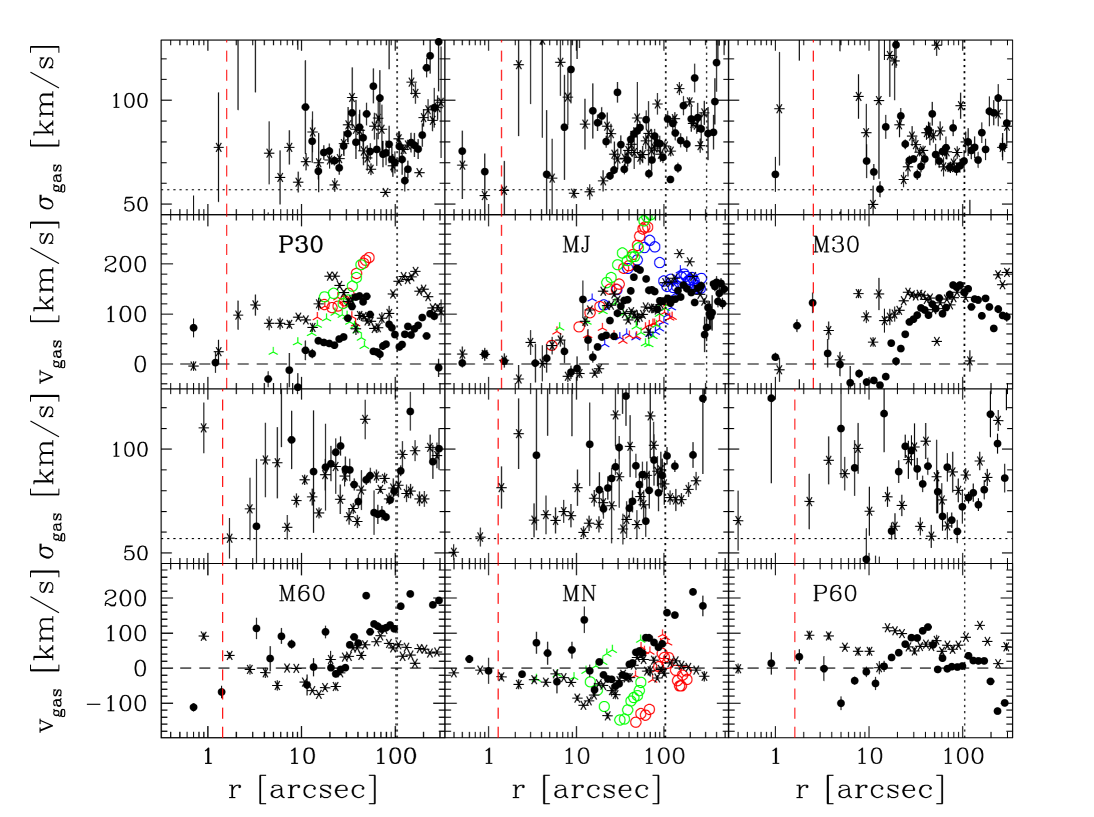
The gas kinematics ( and ) are shown in Fig. 5. Gas velocities are almost a factor two higher than stellar velocities, but less axisymmetric and regular. Gas velocity dispersions are slightly larger than the instrumental resolution, indicating intrinsic velocity dispersions less than 80 km/s. In the inner 10-20 arcsec near the minor axis gas counterrotation (i.e., the orientation of the gas rotation changes) is observed. The gas velocities compare reasonably well with the H measurements of Pellet (Pellet76 (1976)) or Boulesteix et al. (Boulesteix87 (1987)).
We measured Lick line strength index profiles on the M31 emission-corrected spectra as in Mehlert et al. (Mehlert00 (2000)), from H to Fe5789.
As a first check, we verify that we measure line indices uniformly well across the slit. For this purpose, we analyse the spectra of the Lick standard star HD 72324 (= HR 3369) that was observed trailed along the slit. Fig. 6 shows the variation of its line indices as a function of the position on the slit. The measured molecular indices Mg1 and Mg2 with their widely spread continuum windows are increasingly biased towards the ends of the slit, probably because of inaccurate spectral flat fielding where vignetting becomes important. In contrast, all the other indices are well determined and do not vary much . In the following we do not consider Mg1 and Mg2 anymore. As a consequence, all (atomic) indices presented here below are measured in Angstrom.

As a second step, we assess how well we are on the Lick system, since our spectra are not flux calibrated. Our indices are measured following the bands definitions of Worthey et al. (Worthey94 (1994)) with the corrections of Trager et al. (Trager98 (1998)). Fig. 7 demonstrates that no tilt nor shift are needed within the errors, with a typical rms of 0.2 Å. The largest shift, 0.32 Å, significant at the 2.5 sigma level, is observed for the H line, where, as discussed above, we have interpolated two bad columns. We have added in quadrature the rms of each relation to the errors of the galaxy indices.

Finally, Fig. 8 shows the typical effect of the correction for gas emission applied to the spectra. The plot shows the differences between the emission corrected index and the values measured before the correction. Before the correction, the H and Fe5015 indices are smaller (since the emission is present in the index window) by typically 0.29 Å and 0.41 Å respectively, and Mgb is larger (since the emission is present in the redder continuum window) by 0.07 Å. While the H and [NI] match fully the EW of the emission, [OIII] amounts to the difference between the EWs of the [OIII] doublet redder line (that falls in the band window of the Fe5015 index) and the bluer line (that falls in the bluer continuum window of the index). The other indices are not affected. Again, we add in quadrature the errors on the emission EWs of H, [OIII] and [NI] to the ones of the absorption line strengths H, Fe5015 and Mgb, respectively.

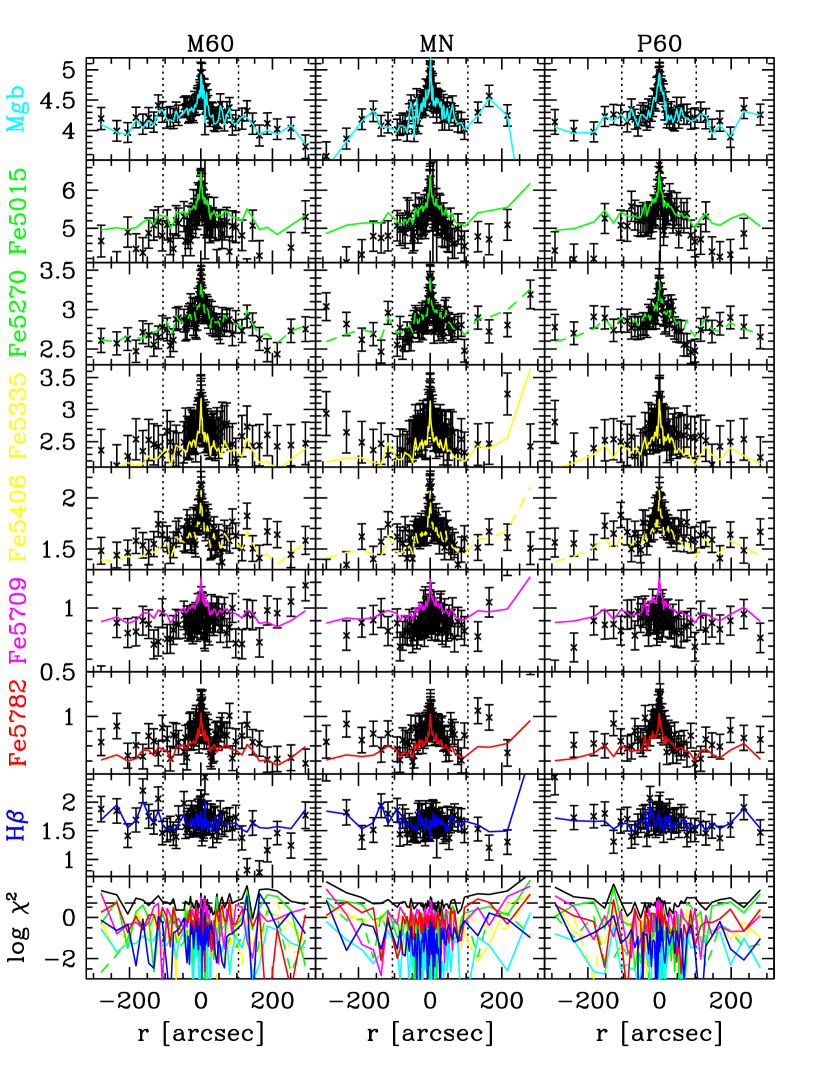
Fig. 9 shows the measured Lick indices profiles for M31. Apart from the central regions, where rapid variations are measured, the indices show very mild gradients, indicative of homogeneous stellar populations (see discussion in Sect. 4.1). Along the major axis and at distances larger than arcmin, where the disk light starts to dominate, making 55% of the total at 500 arcsec from the center, the strenght of the line increases, indicative of a younger stellar population (see discussion in Sect. 4.1). Overall, the indices appear not only symmetric with respect to the center, but also approximately symmetric on circles. As an example, if we compute the rms of the differences of the Mgb index measured at the same distance on the major axis and on one of the other slit positions, we get values between 0.15 and 0.18 Å. If we now repeat the procedure interpolating at the same isophotal distance (using the ellipticity profile derived in Sect. 4.2, see Fig. 13), the rms increases to 0.20-0.25 Å. The same applies to the H or the Iron indices.
Davidge (Davidge97 (1997)) measured Lick indices (not corrected for gas emission) in a 2260 arcsec area centered on M31. His values along the centered East-West slit are shown in Fig. 8, on the plots for the P30 slit (nearest to the EW position). The agreement is good.

In Fig. 10 we plot the equivalent widths (EWs) of the H emission line in Å, together with the EW ratios [OIII]/H and [NI]/H of the emission lines considered above in logarithmic units. Note that we expect the EW ratios to vary by no more than 10% with respect to the ratios of the emission line fluxes, due to the restricted wavelength range spanned by the three lines. Given the logarithmic units, this does not affect the discussion given in Sect. 4.3. While the H and [OIII] lines are almost always well detected, with a signal to noise ratio larger than 4, the [NI] doublets are often weak, if not undetected. The H EW is approximately constant with radius. At radii larger than arcsec the same is true for the [OIII]/H ratio (at the value of 3) and the [NI]/H ratio (at low values smaller than ). Near the center [OIII]/H increases to , combined with an increased [NI]/H ratio ().

Tables 2, 3, and 4 give format examples of the measured stellar and gaseous kinematics, and Lick indices as a function of distance and position angle, respectively. The full listing is available electronically.
| R | PA | ||||
|---|---|---|---|---|---|
| (“) | (km/s) | (km/s) | |||
| -289 | MJ |
| R | PA | H | [OIII]/H | [NI]/H | ||
|---|---|---|---|---|---|---|
| (“) | (km/s) | (km/s) | Å | |||
| -289 | MJ |
| R | PA | H | Mgb | Fe5015 | Fe5270 | Fe5335 | Fe5406 | Fe5709 | Fe5782 |
| (“) | Å | Å | Å | Å | Å | Å | Å | Å | |
| -289 | MJ |
4 An old and massive bulge?
Before discussing the stellar populations (Sect. 4.1) and dynamics (Sect. 4.2) of the central 300 arcsec of M31, it is important to assess what is the light contribution of the bulge and the disk of M31 as a function of distance and position angle. According to the decomposition of Kormendy and Bender (Kormendy99 (1999)), based on a Sersic plus exponential law fit to the MJ photometry and very similar to the one of Kent (1989b ), the disk makes 1% of the total light at the center, 10% at 100 arcsec and 31% at a distance of 300 arcsec along the major axis, and 9% and 25% along the minor axis respectively. The disk light amounts to ¡ 55% of the total at the end of the MJEE slit, 500 arcsec from the center. The results discussed in Sect. 4.1 show that generally old stellar populations are found out to 300 arcsec from the center. In agreement with Stephens et al. (Stephens03 (2003)), who start detecting (younger) disk stars only at distances larger than 7 arcmin from the center, we see the effect of the increasing importance of the younger disk component only at distances of 400-500 arcsec from the center. In contrast, the kinematic imprint of the disk stars is probably visible already at distances arcsec, especially on the major axis (see Fig. 3 and Sect. 3). We discuss it in Sect. 4.2.
4.1 Stellar populations
We study the stellar populations of the inner 5 arcmin of M31 (and out to 8 arcmin along the major axis) using the simple stellar population (SSP) models of Maraston (Maraston98 (1998), Maraston05 (2005)) with a Kroupa (Kroupa01 (2001)) IMF, and the modeling of the Lick indices (LSSP) with elements overabundance of Thomas, Maraston and Bender (TMB03 (2003)). The models cover ages up 15 Gyr, metallicities [Z/H] from -2.25 dex to +0.67, and overabundances [/Fe] from -0.3 to +0.5. We spline-interpolate the LSSP models on a finer grid in , [Z/H] and [/Fe] and determine values of , [Z/H] and [/Fe] that minimize the :
| (1) |
at each radius , where is:
| (2) |
where is the error on the index measured at distance and is the value predicted by the LSSP models for the given set of age, metallicity and overabundance. Note that we do not extrapolate to values outside the model grid. Therefore the minimum solutions are sometimes found at the edges of the parameter space. Once the set that minimizes has been determined, we compute the values of the colors and mass-to-light (M/L) ratios of the corresponding SSP models. Errors on all quantities are derived by considering the minimal and maximal parameter variations compatible with .
Fig. 11 shows the resulting age, metallicity, overabundance, color and M/L profiles along the different slit positions. The corresponding best-fit lines to the measured indices profiles are shown in Fig. 9. We fit 8 Lick indices to derive three parameters, so the expected should be around 5. This matches rather well the derived values (see bottom plot of Fig. 9), indicating that the SSP models are a good representation of the data within their sizeable errors.
The six age, metallicity and overabundance slit profiles are very similar when overplotted as a function of radius. This is a consequence of the approximately constancy of the indices along circles discussed above and indicates that the region with homogeneous stellar populations is not as flattened as a disk component would be, in agreement with what found by Davidge (Davidge97 (1997)) for the inner 30 arcsec. Fig. 12 shows the age, metallicity, overabundance, and profiles averaged over position angles and binned logarithmically in radius (for the MN profile, only the central slit data are included in the average).


The picture emerging from Fig. 11 and 12 is the following. At radii larger than a few arcsec and out to arcmin from the center, the stars of the bulge of M31 are on average almost as old as the universe, tend to solar metallicity and are overabundant by 0.2-0.25 dex. This is in agreement with Stephens et al. (Stephens03 (2003)), who find that the near infrared luminosity function of the red giant stars of the bulge of M31 is indistinguishable from the one of the Milky Way bulge. Of course, the point to point scatter in age in the single slit profiles is large and formally the 1-sigma lines would allow sometimes ages as small as 5 Gyr. This is driven by the scatter in the H, that ultimately correlates with the emission correction applied. There is a metallicity gradient of 0.2 dex per radial decade out to 40 arcsec, and essentially no gradient at larger distances, where solar metallicity is reached. There is no obvious radial variation in age or overabundance. This translates in moderate u-g and M/LB gradients, and almost no detectable gradients in the g-r, r-i, M/LV and M/LR. The exact values of the stellar mass-to-light ratios depend on the assumed IMF (Kroupa Kroupa01 (2001)), that has a slope for the mass range and at larger masses. Changing the break mass from to lowers the from 4 to 3.
Along the major axis and at distances larger than arcmin, the mean age of the stellar population drops to Gyr, again in agreement with Stephens et al. (Stephens03 (2003)), who find disk stars only at distances larger than 7 arcmin from the center. The metallicity is slightly supersolar (by dex). The overabunce remains high. As a consequence, the derived mass-to-light ratio drops to .
The situation is different in the inner arcsecs, where the stellar population age drops down to 4-8 Gyr, the metallicity increases to above 3 times solar, but the overabundance remains at dex. This is in broad agreement with the conclusions of Davidge (Davidge97 (1997)), who however hints to a possible further increase of the overabundance towards the center, not seen here.
We compare the predicted Sloan color profiles to the ones derived from the Sloan survey, that have been dereddened using the extinction map discussed in Montalto et al. (Montalto09 (2009)). Following Maraston (private communication) we apply a correction of -0.05 mag to the model and of +0.07 mag to the model r-i colors. The comparison is surprisingly good in u-g and good in r-i, with deviations mag. Some residual systematic deviations are still present in g-r (where the models are too red) and r-i (where the models are slightly too blue), in qualitative agreement with the discussion of Maraston et al. (Maraston09 (2009)). This overall match provides an independent assessment of the line index analysis.
4.2 Axisymmetric dynamical modeling
The kinematics shown in Fig. 3 describe the light averaged stellar motions of the bulge and disk components. In the inner arcmin this follows closely the bulge kinematics, but at larger distances the contamination by the disk becomes more and more important. Therefore, a dynamical model for the sum of the two components should be compared to Fig. 3. Qualitatively, we can expect the stellar disk to rotate much faster, possibly up to the 150 km/s observed in the gas (see Fig. 5), and to be colder (with velocity dispersions of the order of 60-70 km/s) than the bulge. As a consequence, the true rotational velocity of the bulge could be smaller than, and the bulge velocity dispersion could be larger than shown in Fig. 3. Moreover, the line of sight velocity distribution in the outer regions will be dominated in the high velocity tail by disk stars. This can balance the intrinsic asymmetry of the bulge (that anticorrelates with the mean rotational velocity), possibly explaining the change in sign of the coefficient observed near the major axis at distances larger than 100 arcsec. We have tested that this scheme could work with a simple bulge plus disk kinematical model that follows the light decomposition of Kent (1989b ), but we postpone a quantitative analysis to Morganti et al. (Morganti09 (2009)).
The blue lines in Fig. 3 show the fits to the data of McElroy (McElroy83 (1983)) by Widrow et al. (Widrow03 (2003)), model A (full) and model K1 (dashed). From the discussion given above, it is clear that it is dangerous to assume that McElroy’s data describe the kinematics of the bulge component alone, as done by Widrow et al. (Widrow03 (2003)). Indeed, McElroy (McElroy83 (1983)) recognises that he might be underestimating the true stellar velocity dispersion due to how his analysis method reacts to disk light contamination (see his Table 3), but concludes that the effect is not large on the basis of the disk to bulge decomposition available at the time, that severely downplayed the role of the disk in the inner 5 arcmin.
Letting aside this intrinsic problem, the best-fit model A of Widrow et al. (Widrow03 (2003)) predicts a mass-to-light ratio for the bulge () that is smaller than the one of the disk (), and this despite overestimating the velocity dispersions along the minor axis. Only model K1, well above McElroy s, delivers for the bulge. Widrow et al. go on discussing why it is so, not taking into account the possibility that McErloy velocities are in fact systematically too small. Of course Widrow et al. model A fails to match our kinematics, while model K1 slightly overestimates our velocity dispersions. Fig. 11 shows that for arcsec the analysis of the Lick indices predicts , in line with model K1. As a consequence, the microlensing events estimated by Widrow et al. (Widrow03 (2003)), that are based on their model A, are clearly underestimates. Similarly, an upward revision of the event rate estimates of Riffeser et al. (Riffeser06 (2006)) is needed, since this paper assumes a stellar mass-to-light ratio for the bulge of . The extremely low value (0.8 ) favoured by Chemin et al. (Chemin09 (2009)) based on a simple mass modeling of the HI velocities is completely ruled out and points to the inadequacy of underlying modeling assumptions (circular motions and spherical mass distributions).
Finally, a word on the triaxiality of the bulge or the possible presence of a bar. A rotating axisymmetric structure shows equal velocity curves along slits inclined at positive or negative angles with respect to the major or minor axis. In general, this does not happen if the structure is triaxial or a bar is present (see Fig. 12 of Athanassoula & Beaton Athanassoula06 (2006)). In the case of the bulge of M31 the maximal rotation velocity achieved on the slits M60 and M30 are larger than the ones reached on slits P60 and P30 respectively, or, in other words, the kinematic minor axis of the M31 bulge does not coincide with its isophotal minor axis. We quantify this effect by measuring how the position angle of the kinematic major axis varies as a function of semi-major distance. At each semi-major distance from the center we find the parameters and that minimize the function:
| (3) |
where the twelve angles correspond to the ones of the slits shown in Fig. 1 and listed in Table 1, and are the stellar velocities relative to the center shown in Fig. 3, interpolated at the distance proper to the isophote ellipse determined below (see top panel of Fig. 13). In Eq. 3 we exclude the velocities measured along the minor axis at distances arcsec, where the slits are shifted with respect from the center. A perfectly axisymmetric system has , where is the position angle of the isophotal major axis. In general, the function is a fair representation of the measured data, with rms deviations of 8 km/s. Fig. 13, bottom, shows the resulting profile , together with as derived from a 2MASS K image of M31 using the ellipse fitting package of Bender and Möllenhoff (BM87 (1987)). The corresponding ellipticity profile is shown at the top. The isophotal PA and ellipticity profiles agree with Beaton et al. (Beaton07 (2007)). Both the isophotal and the kinematic PAs move with distance from the center. But, while the isophotal PA oscillates around the value of (the major axis PA of the M31 bulge, see Table 1), the kinematic PA drifts away from it, approaching , 6 degrees smaller than the PA of the major axis of the disk. This suggests that the observed drift is due only partially to the increasing importance of the stellar disk rotation and might point to an intrinsic triaxiality of the bulge and/or the presence of a bar.

However, only a proper dynamical model that takes into account the disk contribution, on top of the triaxiality of M31’s bulge and its possible figure rotation, and fits not only the light distribution, mean velocities and velocity dispersion fields, but also the higher moments of the LOSVDs, can address these issues quantitatively. We postpone this discussion to Morganti et al. (Morganti09 (2009)).
4.3 The sources of ionizing radiation
Sarzi et al. (Sarzi09 (2009)) discuss in detail how to exploit the [OIII]/H vs. [NI]/H diagram to constrain the properties of the ionizing sources for the gas in elliptical and lenticular galaxies. Their Fig. 1 shows that the diagram neatly separates the regions where dusty AGNs, shocks and startburst activity are responsible for the production of emission lines, in analogy with the standard [OI]/H vs. [OIII]/H diagram of Veilleux and Osterbrook (VO87 (1987)).
As discussed by Sarzi et al. (Sarzi09 (2009)), the constancy of the H EW with radius indicates that the H emission flux follows the stellar light distribution. To first approximation, this should apply also to the case discussed here. Values of [OIII]/H with low [NI]/H ratios occupy the region where shocks are responsible for the gas excitation (see Fig. 1 of Sarzi et al. Sarzi09 (2009)). In contrast, [OIII]/H ratios as high as 10, like the ones measured in the inner arcsecs of M31, fall in the region where photoionization by a central AGN is the working mechanism.
5 Discussion and Conclusions
We have presented new optical spectroscopic observations of the bulge of M31. We have measured the stellar and gas kinematics, emission line strength ratios and absorption Lick indices profiles along 6 position angles out to distances of 5 arcmin from the center. Along the major axis we probed regions out to 8 arcmin. We show that the old kinematics of McElroy (McElroy83 (1983)) provides too small velocity dispersions (by up to 30%), therefore biasing the dynamical modeling towards too small bulge stellar masses (by a factor 2). Moreover, the new higher averaged velocity dispersion predicts a mass for the central supermassive black hole of M31 that is only a factor 2 below what measured. The new velocity dispersion profiles are now in better agreement with axisymmetric dynamical models with large bulge mass-to-light ratio (Widrow et al. Widrow03 (2003)), that now match the values derived from stellar population models (, see below). This implies an upward revision of the predicted self-lensing microlensing event rate of Widrow et al. (Widrow03 (2003)), and Riffeser et al. (Riffeser06 (2006)), that are based on lower stellar mass-to-light ratios.
The inner ( arcsec) bulge is slowly rotating, with a . At distances from the center larger than arcsec the measured kinematics becomes increasingly influenced by the rapidly rotating stellar disk. Therefore, the observed variation of the kinematic position angle is suggestive of bulge triaxiality, but needs a proper dynamical modeling of both disk and bulge components to be quantified. The measured gas kinematics confirms the well studied large scale disk rotation. However, a more complex structure, with gas minor axis counter-rotation, is detected in the inner bulge. This might be evidence for a (recent) minor merger, possibly connected to the younger stellar population detected in the inner arcsecs of the galaxy discussed below.
The analysis of eight Lick index profiles shows that the bulge of M31 is old, of solar-metallicity and a factor 2 overabundant in -elements, in agreement with studies of its resolved stellar component (Stephens et al. Stephens03 (2003)). The line indices and stellar population parameters appear approximately constant on circles, i.e. their isocontours are rounder than the galaxy isophotes, as seen in many ellipticals and bulges (Kuntschner et al. Kuntschner06 (2006); Falcón-Barroso et al. Falcon06 (2006)). Together with the derived old ages, this confirms that the stellar disk out to 5 arcmin from the center is either old (similar to what found for other spiral galaxies, Peletier and Balcells Peletier96 (1996)) or not sufficiently probed by the spectral features considered here. However, we do detect smaller ages ( Gyr) along the major axis at distances arcmin. The u-g SLOAN colors predicted from our stellar population analysis match reasonably well with the observed ones. The redder colors g-r and r-i are systematically offset, a well known problem of the flux calibration of current simple stellar population models (Maraston et al. Maraston09 (2009)). The derived mass-to-light ratios (in the Johnson R band and with a Kroupa IMF we get ) agree with the dynamical estimates (see above). They drop to along the major axis at distances arcmin, where the disk light starts to dominate.
In the inner arcsecs the situation changes and a population with a light-weighted younger age ( Gyr inside the seeing disk or 2 arcsec, with values as low as 4 Gyr) and metal richer ( times solar) appears. This agrees with the findings of Davidge (Davidge97 (1997)). In addition, the emission line EW ratios [OIII]/H increase in this region. Their values are compatible with being excited by shocks in the main body of the bulge, but near the center they increase to levels pointing to the presence of an AGN-like photo-ionizing source. Combined with the detection of counterrotating gas along the minor axis of the galaxy (see above), this suggests that a gas-rich minor merger probably happened some 100 Myr ago, that triggered an episode of star formation and possibly boosted the nuclear activity of the central supermassive black hole of M31. We estimate how broad a range of star burst ages and masses can be to give the measured mean value of 8 Gyr in the inner 2 arcsec, when superimposed to the old bulge stars background. To this purpose we compute composite spectra of an old (12.6 Gyr) plus a young (from 100 Myr to 4 Gyr) simple stellar population, using the Vazdekis (Vazdekis99 (1999)) library, and measure their SSP ages through the analysis of the Lick indices observed here. We find that global ages smaller than 8 Gyr are found when considering a young component younger than Myr and a mass fraction lower than 10%. Higher mass fractions are possible for older ages. From Kormendy and Bender (Kormendy99 (1999)), inside an aperture of 2 arcsec diameter we measure a V mag of 12.5, or . In this region we estimate and therefore an enclosed mass of . As a consequence, of some 100 Myr old stars would be needed. Note that in the inner nucleus of M31, at fractions of an arcsec, a disk of 200 Myr old stars is found (Bender et al. Bender05 (2005)), with a mass of . Of course the spatial resolution of our spectra is too low to probe this scale. Moreover, our result, based on the H line as an age tracer, depends heavily on the details of the emission correction and might be affected by the bad column’s interpolation (see Sect. 2). Spectra of the higher order Balmer lines, taken with better seeing, are needed to improve our conclusions.
In a second paper (Morganti et al. Morganti09 (2009)), a dynamical model of the data presented here, that takes into account the contributions of the bulge and disk components, will assess in a quantitative way the bulge triaxiality issue and will give a proper estimate of the microlensing event rates due to self-lensing.
Acknowledgements.
The Hobby-Eberly Telescope (HET) is a joint project of the University of Texas at Austin, the Pennsylvania State University, Stanford University, Ludwig-Maximilians-Universität München, and Georg-August-Universität Göttingen. The HET is named in honor of its principal benefactors, William P. Hobby and Robert E. Eberly. The Marcario Low Resolution Spectrograph is named for Mike Marcario of High Lonesome Optics who fabricated several optics for the instrument but died before its completion. The LRS is a joint project of the Hobby-Eberly Telescope partnership and the Instituto de Astronomía de la Universidad Nacional Autónoma de México. The grism E2 used for these observations has been bought through the DFG grant BE1091/9-1.References
- (1) Athanassoula, E., Beaton, R.L., 2006, MNRAS, 370, 1499
- (2) Beaton, R.L, Majewski, S.R., Guthakurta, P., Skrutskie, M.F., Cutri, R.M., Good, J., Patterson, R.J., Athanassoula, E., Bureau, M., 2007, ApJ, 658, L91
- (3) Bender, R. 1990, A& A, 229, 441
- (4) Bender, R., Möllenhoff, C., 1987, A&A, 117, 71
- (5) Bender, R., Saglia, R.P., Gerhard, O., 1994, MNRAS, 269, 785
- (6) Bender, R., Kormendy, J., Bower, G., Green, R., Thomas, J., Danks, A.C., Gull, T., Hutchings, J.B., Joseph, C.L., Kaiser, M.E., Lauer, T.R., Nelson, C.H., Richstone, D., Weistrop, D., Woodgate, B. 2005, ApJ, 631, 280
- (7) Boulesteix, J., Geolgelin, Y.P., Lecoarer, E., Marcelin, M., Monnet, G., 1987, A& A, 178, 91
- (8) Braun, R. 1991, ApJ, 372, 54
- (9) Chemin, L., Carignan, C., Foster, T., 2009, ApJ, in press
- (10) Davidge, T.J. 1997, AJ, 113, 985
- (11) De Lorenzi, F., Debattista, V.P., Gerhard, O., Sambhus, N. 2007, MNRAS, 376, 71
- (12) De Vaucouleurs, G., 1958, ApJ, 128, 465
- (13) Falcón-Barroso, J., Bacon, R., Bureau, M., Cappellari, M., Davies, R. L., de Zeeuw, P. T., Emsellem, E., Fathi, K., Krajnovic, D., Kuntschner, H., McDermid, R. M., Peletier, R. F.; Sarzi, M. 2006, MNRAS, 369, 529
- (14) Gerhard, O. 1986, MNRAS, 219, 373
- (15) Gültekin, K., Richstone, D.O., Gebhardt, K. Lauer, T.R., Tremaine, S., Aller, M.C., Bender, R., Dressler, A., Faber, S.M., Filippenko, Al.V., Green R., Ho, L.C., Kormendy, J., Magorrian, J., Pinkney, J., Sopis, C., 2009, ApJ, 698, 198
- (16) Kent, S., 1989a, PASP, 101, 489
- (17) Kent, S., 1989b, AJ, 97, 1614
- (18) Hill, G. et al. 1998, SPIE 3355, 375
- (19) Kaiser, N. 2004, SPIE, 5489, 11
- (20) Kerins, E., Carr, B.J., Evans, N.W., Hewett, P., Lastennet, E., Le Du, Y., Melchir, A.-L., Smartt, S.J., Valls-Gabaud, D. 2001, MNRAS, 323, 13.
- (21) Klypin, A., Zhao, H., Somerville, R.S. 2002, ApJ, 573, 597
- (22) Kormendy, J., Bender, R. 1999, ApJ, 522, 772
- (23) Kroupa, P. 2001, MNRAS, 322, 231
- (24) Kuntschner, H., Emsellem, E., Bacon, R., Bureau, M., Cappellari, M., Davies, R. L., de Zeeuw, P. T., Falcón-Barroso, J., Krajnovic, D., McDermid, R. M., Peletier, F., Sarzi, M. 2006, MNRAS, 369, 497
- (25) Maraston, C. 1998, MNRAS, 300, 872
- (26) Maraston, C. 2005, MNRAS, 362, 799
- (27) Maraston, C., Strömback, G., Thomas, D., Wake, D.A., Nichol, R.C. 2009, MNRAS, 394, L107
- (28) Mehlert, D., Saglia, R.P., Bender, R., Wegner, G. 2000, A&AS, 141, 449
- (29) McElroy, D.B. 1983, ApJ, 270, 485
- (30) Montalto, M., Seitz, S., Riffeser, A., Hopp, U., C.-H. Lee, Schönrich, R., 2009, submitted to A&A
- (31) Morganti, L., et al. 2009, in preparation
- (32) Peletier, R.F., Balcells, M. 1996, AJ, 111, 2238
- (33) Pellet, A. 1976, A&A, 50, 421
- (34) Riffeser, A., Fliri, J., Seitz, S., Bender, R. 2006, ApJS, 163, 225
- (35) Sarzi, M., Falcón-Barroso, J., Davies, R.L., Bacon, R., Bureau, M., Cappellari, M., de Zeeuw, P.T., Emsellem, E., Fathi, K., Krajnovic, D., Kuntschner, H. McDermid, R.M., Peletier, R.F 2006, MNRAS, 366, 1151
- (36) Sarzi, M., et al. 2009, submitted to MNRAS
- (37) Stark, A.A. 1977, ApJ, 213, 368
- (38) Stephens, A.W., Frogel, J.A., DePoy, D.L, Freedman, W., Gallart, C., Jablonka, P., Renzini, A., Rich, R.M., Davies, R., 2003, AJ, 125, 2473
- (39) Thomas, D., Maraston, C., Bender R. 2003, MNRAS, 339, 897
- (40) van der Marel, R. P., Rix, H. W., Carter, D., Franx, M., White, S. D. M., de Zeeuw, T. 1994, MNRAS, 268, 521
- (41) Trager, S. C., Worthey, G., Faber, S.M., Burstein, D., Gonzalez, J.J. 1998, ApJS, 116, 1
- (42) Vazdekis, A., 1999, ApJ, 513, 224
- (43) Veilleux, S., Osterbrock, D.E., 1987, ApJS, 63, 295
- (44) Widrow, L.M., Perrett, K.M., Suyu, H.S. 2003, ApJ, 588, 311
- (45) Worthey, G., Faber, S.M., Gonzalez, J.J., Burstein, D. 1994, ApJS, 94, 687