Is NP Aqr a new near-contact binary?111Based on observations collected at Catania Astrophysical Observatory (Italy)
Abstract
We present radial velocities of the double-lined spectroscopic binary NP Aqr. The radial velocities and the optical light curves obtained by Hipparcos and ASAS-3 are analyzed separately. The masses of the primary and secondary components have been found to be 1.650.09 and 0.990.05 M⊙, respectively. The cross-correlation functions indicate triple peaks which show presence of a tertiary star. The spectroscopic properties of this additional component resemble to that of the primary star. The analysis of the light curves yielded that the more massive primary star fills its corresponding Roche lobe. The secondary component is at or near Roche lobe indicating a new Lyrae-type near-contact binary. The orbital inclination is about 40∘ and, therefore, the observed light variations are produced only by the proximity effects. Due to the absence of eclipses, the effective temperature of the secondary star and the radii of the components could not be determined accurately. We conclude that NP Aqr is a non-eclipsing double-lined spectroscopic binary with a distance of about 1347 pc. The absolute parameters of the components are also compared with the evolutionary models. While the location of the primary star seems to be suitable with respect to its mass in the Hertzsprung-Russell diagram, the secondary component is located as if a star having a mass less than 0.6 M⊙. This discrepancy is originated from very low effective temperature determined only from the light curve produced by proximity effects. The distance to the third star appears to be very close to that of the close binary which indicates that it may be dynamically bounded to the binary.
keywords:
binaries: stars: close - binaries: eclipsing-binaries: general - binaries: spectroscopic - stars: individual: NP Aqr1 Introduction
The light variability of NP Aquarii (=HD 198528=HIP 102935=NSV 25363) was first suspected by Tobin, Viton & Sivan (1994) during the Spacelab-1 Very Wide Field survey of UV-excess objects. This survey has revealed a variety of stellar objects with strong ultraviolet excess (see, for example, Viton et al. 1988). Perryman et al. (1997) confirmed its light variation using the Hp magnitudes obtained by the Hipparcos mission. The type of the light variability could not be classified with the available data. Later on, Otero (2003) gave the epoch of minimum light, the orbital period and the variability class using the ASAS-3 (Pojmanski, 2002) and Hipparcos databases. He classified the star as a Lyrae-type eclipsing binary with an orbital period of 0.806982 day and with very shallow eclipses, namely 0.1 mag. Very recently, Kazarovets et al. (2006) designated the star HD 198528 as NP Aqr using the criteria of General Catalog of Variable Stars in the 78th Name-list of Variable Stars. van Leeuwen (2007) re-examined the Hipparcos data and concluded that NP Aqr is an eclipsing binary with a spectral type of F0V at a distance of 18627 pc. He also gives wide-band B-V and V-I color indices and interstellar reddening, E(B-V). Due to its very limited light variations and a spectral type of F0 Handler (1999) included the star in the Doradus candidates but with doubts that it may also be classified as a Scuti type variable. Handler and Shobbrook (2002) made Johnson B, V and Cousins Ic observations of the known and candidate Dor stars to assess the relationship between the Dor and Sct stars. They found slow variations with amplitudes of several hudredths of a magnitude. Taking into account a double-wave light curve they have excluded W UMa-type variability and suggested a possibility of an ellipsoidal variable with a period of about 0.807 day.
In this paper, we use the optical spectra of NP Aqr to reveal the nature of its light variability and physical properties combining with the photometric data obtained by Hipparcos and ASAS-3. The paper is organized as follows. In §2 the spectroscopic observations and data analysis are described. The spectroscopic and photometric results are combined and the absolute parameters of the stars are derived and the structure of NP Aqr is discussed in §3. A brief conclusion is given in §4.
2 Spectroscopic observations
Spectroscopic observations have been performed with the échelle spectrograph (FRESCO) at the 91-cm telescope of Catania Astrophysical Observatory. The spectrograph is fed by the telescope through an optical fibre (–, 100 m core diameter) and is located, in a stable position, in the room below the dome level. Spectra were recorded on a CCD camera equipped with a thinned back–illuminated SITe CCD of 1k1k pixels (size 2424 m). The cross-dispersed échelle configuration yields a resolution of about 22 000, as deduced from the full width at half maximum (FWHM) of the lines of the Th–Ar calibration lamp. The spectra cover the wavelength range from 4300 to 6700 Å, split into 19 orders. In this spectral region, and in particular in the visual portion of the spectrum, there are several lines useful for the measurement of radial velocity, as well as for spectral classification of the stars.
The data reduction was performed by using the échelle task of IRAF package following the standard steps: background subtraction, division by a flat field spectrum given by a halogen lamp, wavelength calibration using the emission lines of a Th-Ar lamp, and normalization to the continuum through a polynomial fit.
Sixteen spectra of NP Aqr were collected during the 20 observing nights between August 2nd and September 23th, 2006. Typical exposure times for the NP Aqr spectroscopic observations were between 2600 and 3000 s. The signal-to-noise ratios () achieved were between 70 and 115, depending on atmospheric condition.
We also observed the radial and rotational velocity standards Lyr (A0V), Psc (F7V), and 50 Ser (F0V) with the same instrumentation. The average at continuum in the spectral region of interest was 150–200 for the standard stars. Cross-correlating the spectra of NP Aqr with standard stars usually yielded robust correlation peaks with a FWHM of approximately 0.18 Å. Fitting a Gaussian profile to these peaks allowed the center to be determined to an accuracy of about 0.02 Å. This transforms to a radial velocity accuracy of 1 km s-1.
Double-lined spectroscopic binaries are characterized by the presence of two stellar spectra that appears in the cross-correlation function (CCF) as two peaks displacing back and forth according to the orbital motion of the system’s components. The location of the two peaks allows the measurement of the radial velocity of each component at the phase of observation. The cross-correlation technique applied to digitized spectra is now one of the standard tools for the measurement of radial velocities in close binary systems. This helps to explore the binary mass-ratio distribution, especially in the low-mass regime.
| HJD | Phase | Star 1 | Star 2 | Star 3 | ||||
|---|---|---|---|---|---|---|---|---|
| 2 453 000+ | Vp | Vs | Vt | |||||
| 53953.3919 | 0.1410 | 80.0 | 5.0 | -81.0 | 8.1 | 12.6 | 9.8 | 75 |
| 53953.5325 | 0.3152 | 91.6 | 3.0 | -94.4 | 8.4 | 26.4 | 8.8 | 88 |
| 53954.3766 | 0.3612 | 79.0 | 3.1 | -70.9 | 8.5 | 23.5 | 10.0 | 90 |
| 53955.3771 | 0.6011 | -27.9 | 5.0 | 103.4 | 14.5 | 35.1 | 11.0 | 87 |
| 53955.5104 | 0.7662 | -54.0 | 6.7 | 143.6 | 9.2 | 17.3 | 8.8 | 111a |
| 53958.3998 | 0.3467 | 84.0 | 7.4 | -83.5 | 8.8 | 25.8 | 6.7 | 95a |
| 53970.4195 | 0.2414 | 96.0 | 5.2 | -106.4 | 6.8 | 27.6 | 7.1 | 106a |
| 53971.4214 | 0.4830 | 27.4 | 8.3 | — | — | — | — | 80 |
| 53973.3696 | 0.8971 | -22.0 | 8.0 | 99.2 | 13.5 | 13.3 | 11.0 | 97 |
| 53975.3249 | 0.3201 | 91.6 | 2.4 | -90.0 | 7.8 | 38.4 | 7.9 | 115a |
| 53980.3008 | 0.4862 | 25.0 | 7.1 | — | — | — | — | 75 |
| 53981.2932 | 0.7160 | -56.4 | 5.6 | 148.1 | 7.7 | 13.9 | 8.0 | 106a |
| 53982.3099 | 0.9759 | 10.0 | 7.5 | 39.4 | 6.0 | — | — | 60 |
| 53983.2941 | 0.1955 | 93.3 | 5.9 | -99.5 | 9.1 | 26.4 | 9.9 | 81a |
| 53985.2766 | 0.6522 | -42.2 | 4.9 | 126.1 | 9.2 | 33.4 | 6.7 | 110a |
-
a
Used also for rotational velocity () measurements.
The radial velocity measurements of NP Aqr were obtained by cross–correlation of each échelle order of NP Aqr spectra with the spectra of the bright radial velocity standard stars Lyr (A0V), 59 Her (A3IV), Psc (F7V), and 50 Ser (F0V) whose radial velocities are km s-1, km s-1, +5.4 km s-1, and -45.5 km s-1 respectively, determined by Nordström et al. (2004). For this purpose the IRAF task fxcor was used.
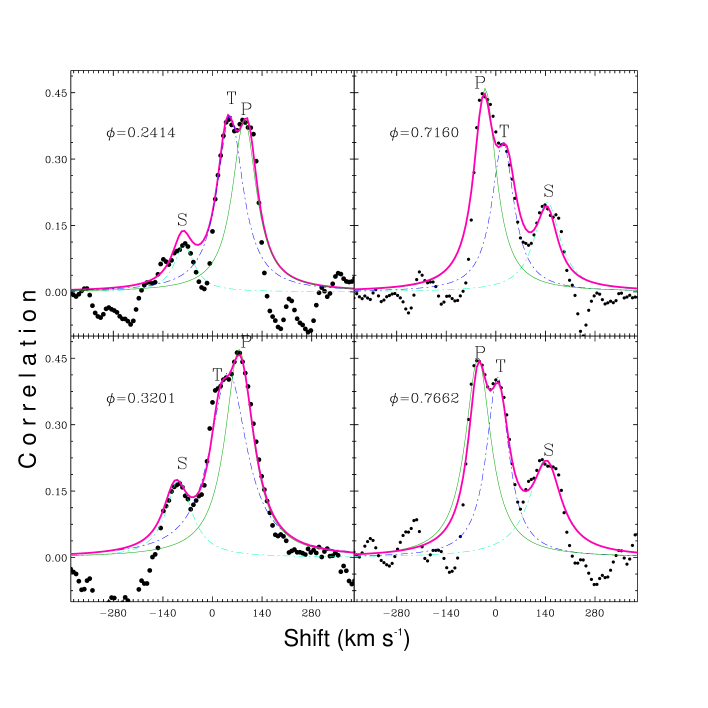
We applied the cross-correlation technique to several wavelength regions with well-defined absorption lines of the primary and secondary components. These regions include the following lines: Si iii 4568 Å, Mg ii 4481 Å, He i 5016 Å, He i 4917 Å. The stronger CCF peak shows two peaks having nearly equal intensity and width, especially at both quadratures. One of these stronger CCF peaks should correspond to the more massive component that also has a larger contribution to the observed spectrum. To better evaluate the centroids of the peaks (i.e. the radial velocity difference between the target and the template), we adopted two separate Gaussian fits for the case of significant peak separation. However, we adopted three separate Gaussian fits for the case of small relative line shifts at near the conjunctions when spectral lines are particularly blended. In most cases, the Gaussian approximation gave reasonably good fits for the central parts of the CCFs.
Figure 1 shows examples of CCFs at various orbital phases. The two peaks, non-blended, correspond to each component of NP Aqr. The stronger peak in the CCFs corresponds to the more massive component, which is also the more luminous at the observational wavelengths. The CCFs shown in Fig. 1 reveal presence of at least three peaks in the spectra of NP Aqr, corresponding to phases near the quadratures. However, the spectral lines of the tertiary component appear to be blended with those of the primary star. The peak between the peaks of primary and secondary component could be related to a possible tertiary component. It should be noted that this peak can be resolved for very limited spectra taken at both quadratures. The measured radial velocities for the components of close binary and for the third star are given in Table 1. However, given the noise in the CCFs, we cannot exclude the possibility that this feature is a spurious peak. We estimate roughly the light contribution of the primary, secondary and tertiary components in the region covered by the V bandpass as 0.440.11, 0.160.04 and 0.400.07, respectively, using the FWHM of the CCFs.
2.1 Analysis of the radial velocities
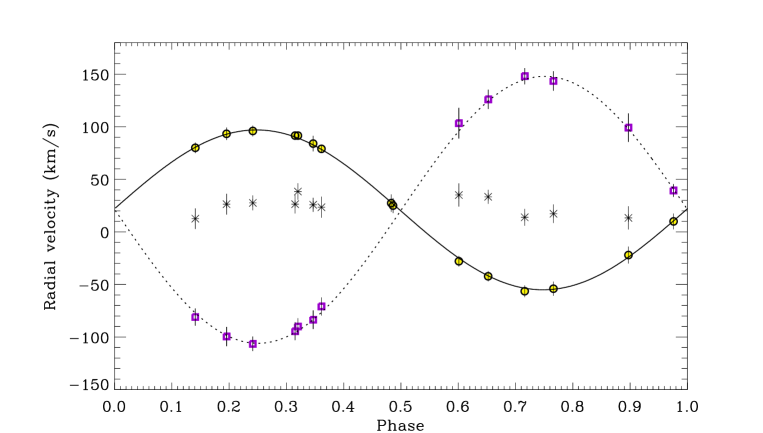
The radial velocity measurements, listed in Table 1 together with their standard errors, are weighted means of the individual values deduced from each order (see, e.g., Frasca et al. 2006). The observational points and their error bars are displayed in Figure 2 as a function of orbital phase, computed using the ephemeris given by Otero (2003),
Min I = JDH 24 47985.661+0.806982 E.
We also plot the radial velocities of the third star in Figure 2 (asterisks). Since the spectral lines of the primary star and the tertiary component are blended we could measure the radial velocities of the third star using the peaks of CCFs. For this reason the RVs of the third star appear to vary with respect to the orbital phases of the binary. The solution of RVs of NP Aqr yields the semi-amplitudes of the more massive, and less massive components as K1=762 km s-1 and K2=1272 km s-1, respectively; systemic velocity of Vγ=211 km s-1 and an eccentricity of nearly zero, indicating a circular orbit.
2.2 Rotational velocities
The width of the cross-correlation profile is a good tool for the measurement of (see, e.g., Queloz et al. 1998). The projected rotational velocities () of the two components were obtained by measuring the FWHM of the CCF peaks in nine high-S/N spectra of NP Aqr acquired at phases, where the spectral lines have the largest Doppler-shifts. In order to construct a calibration curve FWHM–, we have used an average spectrum of Psc, acquired with the same instrumentation. Since the rotational velocity of Psc is very low but not zero ( 11 km s-1, e.g., Royer, Zorec & Fremat 2004 and references therein), it could be considered as a useful template for A-type stars rotating faster than 10 km s-1. The spectrum of Psc was synthetically broadened by convolution with rotational profiles of increasing in steps of 5 km s-1 and the cross-correlation with the original one was performed at each step. The FWHM of the CCF peak was measured and the FWHM- calibration was established. The values of the two components of NP Aqr were derived from the FWHM of their CCF peak and the aforementioned calibration relations. The FWHM values were derived for a few wavelength regions and for the best spectra obtained near the quadratures. The mean projected rotational velocities of the primary, secondary and tertiary components are found to be 727 km s-1, 6310 km s-1 and 7411 km s-1, respectively.
2.3 Spectral classification
We have used our spectra to classify the primary component of NP Aqr. For this purpose we have degraded the spectral resolution from 20 000 to 3 000, by convolving them with a Gaussian kernel of the appropriate width, and we have measured the equivalent width () of photospheric absorption lines useful for the spectral classification. We have followed the procedures of Hernández et al. (2004), choosing hydrogen and helium lines in the blue-wavelength region, where the contribution of the secondary component to the observed spectrum is negligible. From several spectra we measured Å, Å, Å, and Å.
From the calibration relations –Spectral-type of Hernández et al. (2004), we have derived a spectral type F1V with an uncertainty of about 1 spectral subclass. The effective temperature deduced from the calibrations of Drilling & Landolt (2000) or de Jager & Nieuwenhuijzen (1987) is about 6 900 K (F2V). The spectral-type uncertainty leads to a temperature error of K.
The B-V and V-I colors and the reddening in B-V are given by van Leeuwen (2007) as 0.3480.015, and 0.4100.020 and 0.015 mag, respectively. Using the color-temperature relation given by Drilling & Landolt (2000) we estimate an effective temperature of 7 10090 K for the primary component of NP Aqr. However, we find 6 85080 K, 7 000100 K, 7 060100 K for the same colors using the calibrations given by Popper (1980), Alonso, Arribas & Martinez-Roger (1996) and Flower (1996), respectively. On the other hand, the , , , , and values are given by Tobin, Viton & Sivan (1994) and Hauck & Mermillod (1998) as 7.6400.034, 0.2010.006, 0.1660.006, 0.8000.003 and 2.775, respectively. The calibration of Drilling and Landolt (2000) yields an effective temperature of 7 17055 K. However, the infrared colors given by Cutri et al. (2003) are J-H=0.1300.040 and H-K=0.0880.039 mag which correspond to a temperature of 7 100100 K according to the calibrations of Tokunaga (2000). The temperature uncertainty of the primary component results from considerations of spectral type uncertainties and temperature calibration differences. The weighted mean of the effective temperature of the primary star is 7 05095 K.
2.4 Orbital solution
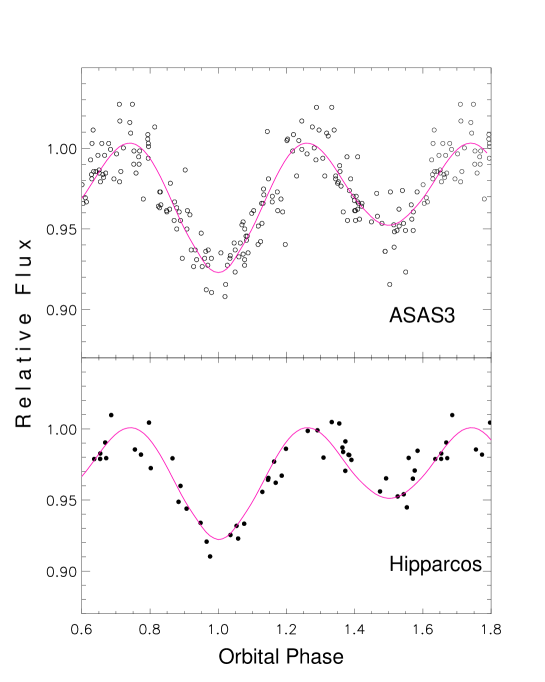
The first photometric observations of NP Aqr were made by the Hipparcos mission and 49 Hp magnitudes were listed by van Leeuwen (2007). These magnitudes were obtained in a time interval of about three years. The accuracy of the Hipparcos data is about 0.01. The peak-to-peak amplitude of the light variation is about 0.1 mag. These measurements are plotted against the orbital phase in the bottom panel of Fig. 3.
NP Aqr was identified in the All-Sky Automated Survey (ASAS, Pojmanski 2004) as a detached eclipsing binary system with a maximum, out-of-eclipse -bandpass magnitude of 7.59m and a period of 0.8070 day. The light curve seems to exhibit periodic eclipses with depths of primary and secondary eclipse of and , respectively. The scatter of the data in the out-of-eclipse phases was about . We plot the ASAS data in the top panel of Fig. 3. It is clear that both light curves are very similar but the Hipparcos magnitudes are smaller about 0.2 mag than those of the ASAS. Since the number of the individual observations obtained by Hipparcos mission and by ASAS are not too much, we use all of them for the analysis of the light curves, separately. We used the last version of the Wilson-Devinney code (Wilson and Devinney 1971) in order to obtain the inclination of the orbit, the fractional radii and luminosities of the components as well as the effective temperature of the cooler component. In the light curve solution we keep some parameters fixed whose values can be estimated from radial velocities and global stellar properties. The limb-darkening coefficients were estimated from van Hamme (1993), the gravity-darkening exponents were assumed to be =1.0 and =0.32, according to the von Zeipel’s law, because the secondary component seems to have convective envelope. The bolometric albedos were set to =1.0 and =0.5 (Lucy 1967), suitable for the radiative and convective envelopes. The mass ratio, the key parameter in the solution, is taken to be 0.6 adopted from the radial velocity analysis.
We started the light curve analysis with effective temperature of 7 050 K for the primary component. Initially, the Mode-2 of the Wilson-Devinney code, referring to the detached Algols, was adopted for the analysis of the light curves. The adjustable parameters in the analysis were the inclination of the orbit (), the surface potentials(, ), and the effective temperature of the secondary (T2), the luminosity of the primary star (L1) and light contribution of the tertiary component (). Using trial-and-error method we could not obtain a set of parameters, which marginally represented the observed light curves. So, we kept the orbital inclination as fixed, starting from 38 to 45 degrees. The iterations were carried out automatically until convergence, and a solution was defined as the set of parameters for which the differential corrections were smaller than the probable errors. However, after a few runs we found that the primary star’s volume exceeded its inner Roche lobe whereas the secondary star was inside its lobe. So, we arrived at a decision that NP Aqr is not a detached system. Next, we tried (for contact systems), (primary star fills its lobe) and (secondary star fills its lobe). The fits of the computed light curves obtained with Mode-4 to the observations at an inclination of 40∘ are satisfactory. The smallest sum of residuals squared was also arrived at an inclination of 40∘. Since spectroscopic observations revealed signs of a tertiary component which contributes an amount of light as large as the primary component we also took the value of () as an adjustable parameter. The value of in units of total triple star system light was estimated to be 0.08, too small compared with the estimate from spectra. If we increase the inclination of the orbit to 41∘ the eclipses set in and the light contribution of the third star can be better determined. When the orbital inclination of the binary is taken as 44∘ the light contribution of the third star reaches to 0.20, almost half of the value obtained from the spectra. However, photometric light curves obtained by Hipparcos and ASAS do not clearly show evidence of the eclipses. So, we conclude that the observed low-amplitude light variations are produced by the proximity effects rather than eclipses. Such a low-amplitude light variation may give unreliable solutions. Therefore, the rough values of the orbital parameters were estimated in this study, whereas determination of the from the available light curves appears to almost impossible.
The final orbital and stellar parameters from the simultaneous light curve analysis are listed in Table 3. The parameters that were adjusted have standard errors as computed by the program. The computed light curve is compared with the observations in Fig. 3. Since only the light variations originated from the proximity effects could be observed, the real errors of the parameters should be larger than those computed by the WD code. Furthermore, it should also be noted that the presence of a tertiary component slightly affects the fractional luminosities of the components.
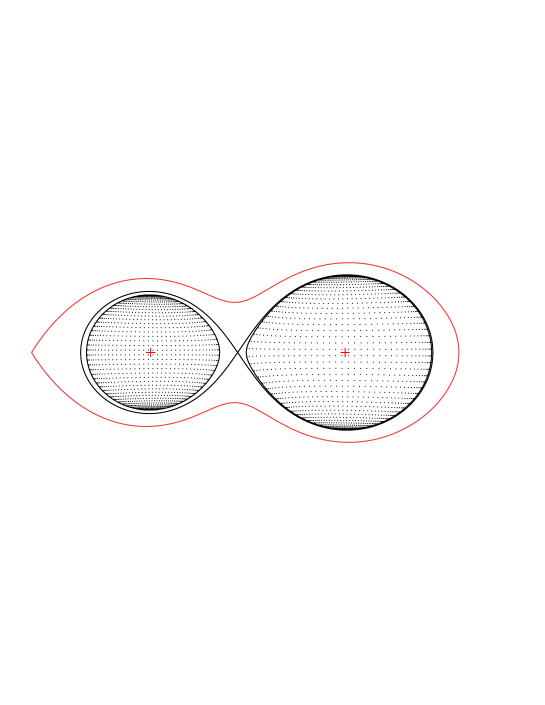
The results of the light curve analysis indicate that NP Aqr is very similar to that so-called inverse Algols. While the primary star appears to filling its Roche lobe the secondary star is very close its lobe, indicating a near contact binary (NCB). This is the case for most NCBs whose light curves are of the -Lyrae type. NCBs are distinct from the contact binaries with no large-scale energy transport from one component to the other. Shaw (1994) divided the NCBs into two sub-groups designated by the so-called prototypes FO Vir and V1010 Oph. The stars belong to the latter subclass, i.e. V1010 Oph-type NCBs, are defined as those with a normal primary at or near the Roche lobe and a secondary that is up to 1.5 times oversized, but well inside the Roche lobe. In Figure 4 we show the volumes of the components and their corresponding Roche lobes. While the more massive primary star is filling its Roche lobe the secondary is close to its lobe. Recently, Oh (2005) collected physical parameters of all the NCBs. He proposed a relationship between the mass ratio and luminosity ratio of the NCBs as (L2/L1)=(M2/M1)1.45. We estimate that the secondary star has a radius of 1.67 times larger with respect to its mass. The light ratio determined from the spectra is about 0.398 which is smaller only 20 per cent than that computed from the mass-to-luminosity ratios relationship. These results lead to the conclusion that NP Aqr fulfills almost all properties of the V1010 Oph-type NCBs and is very similar to the NCB EU Hya.
| (days) | 0.806982 |
|---|---|
| Vγ (km s-1) | 211 |
| (km s-1) | 76 2 |
| (km s-1) | 127 2 |
| () | 1.212 0.032 |
| () | 2.025 0.037 |
| 0.5980.018 | |
| () | 0.4380.018 |
| () | 0.2620.013 |
| Parameters | ASAS3 |
|---|---|
| 40 [Fix] | |
| T (K) | 7 050[Fix] |
| T (K) | 4250385 |
| 0.3060.012 | |
| r1 | 0.4230.013 |
| r2 | 0.3340.020 |
| 0.950.04 | |
| 0.050.03 | |
| 0.049 |
| Parameter | Primary | Secondary |
|---|---|---|
| Mass (M⊙) | 1.65 0.09 | 0.99 0.05 |
| Radius (R⊙) | 2.13 0.09 | 1.67 0.07 |
| () | 4.00 0.02 | 3.99 0.02 |
| (K) | 7050 95 | 4250 385 |
| 1.00 0.04 | -0.08 0.16 | |
| (km s-1) | 86 1 | 68 2 |
| (km s-1) | 72 7 | 63 10 |
| (pc) | 1347 | |
3 Discussion
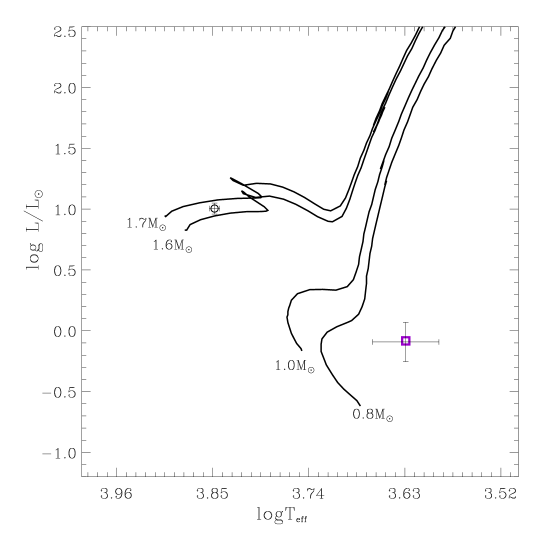
Combining the parameters in Tables 2 and 3, we derived the astrophysical parameters of the components and other properties in Table 4. Luminosities are computed directly from the radii and effective temperatures of the components. While the light contribution of the secondary component to the total light of the binary is estimated from the spectra to about 0.27, the contribution is derived from the light curve analysis as low as 0.05. As we mentioned in the previous section neither the temperature nor the light contribution of the secondary component are estimated accurately because of the lower orbital inclination, e.g. absence of eclipses. We compared the positions of the components of NP Aqr in the - diagram with the evolutionary tracks of Girardi et al. (2002), as shown in Fig. 5. The absolute parameters of the primary star place it very close to the evolutionary track of a 1.65 M⊙ single star with solar abundance. However, the secondary component appears to have lower luminosity and lower effective temperature with respect to its mass. As we noted in the section dealing with the light curve analysis the observed light variation of NP Aqr is produced only from the proximity effects. Due to the lower orbital inclination eclipse phenomena are not produced. In addition, presence of a third component also lightens the effect originated from the proximity of close binary. Therefore, the analysis of the observed light curves can not yield the accurate parameters of the binary. We do not want to make further speculation about the location of the less massive component in the HR diagram and its evolutionary status, due to the very poor estimation of its parameters.
NP Aqr was measured by the Hipparcos mission, but the published parallax is rather uncertain. In the first (Perryman et al.1997) and the last (van Leeuwen 2007) versions of the Hipparcos catalogs the parallaxes are given as =5.501.31 and 5.390.76 mas, respectively. The latter corresponds to a formal distance of 18627 pc. Based on the BVIJHK magnitudes of the binary, cleaned from the contribution of third body, interstellar extinction given by Tobin, Viton & Sivan (1994) and the bolometric corrections given by Girardi et al. (2002) we estimate a weighted distance to the spectroscopic binary NP Aqr to be 1347 pc. The distance to the system determined in this study has very low uncertainty when compared with that measured by Hipparcos mission. The third star has characteristics of an F1-2 main-sequence star, similar to the primary component of the spectroscopic close binary, which would give it an absolute magnitude of about 3.20.5 mag and a distance of about 12228 pc, if it is a single star. This result indicates that the third star would plausibly be dynamically bounded to the close binary. New spectra of the NP Aqr with the higher S/N ratio and resolution are needed to clarify the nature of the third star.
4 Conclusion
The first spectoscopic observations of the relatively short-period close binary NP Aqr are presented. CCFs indicate that NP Aqr is a triple system. The radial velocities of both components are obtained and analyzed for the spectroscopic elements. NP Aqr has been observed also by the Hipparcos mission and ASAS-3 which yielded almost complete light curves of the system. Both light curves are analyzed separately and the resultant orbital elements are determined. The analysis of the light curves revealed that the light variation with an amount of about 0.1 mag is produced from the proximity effects. In other words, NP Aqr is a double-lined, non-eclipsing spectroscopic binary. The radii of the components and effective temperature of the secondary star could be determined with great uncertainty due to the absence of the eclipses and also presence of a third star. Comparing stellar evolutionary models for the mass of the components we find that location of the primary star in the HR diagram is suitable with its mass. However, the secondary star looks like a low-mass star. While the radius of this star is as large as 1.67 times with respect to its mass, the effective temperature is unexpectedly low. The effective temperatures of the binary star’s components can be determined by comparing the depths of the eclipses. Since the stars of NP Aqr do not show eclipses due to the small orbital inclination, the eclipses do not set in. Our analysis indicates that the star NP Aqr shows most of the characteristics of the so-called near-contact binaries. Moreover, we detected a third component in the system NP Aqr. The third star looks like the primary component in the spectra. Using this property and assuming that it is a main-sequence star we determined its distance to be 122 pc, at nearly the same distance with the spectroscopic binary.
Acknowledgments
We thank Prof. G. Strazzulla, director of the Catania Astrophysical Observatory, and Dr. G. Leto, responsible for the M. G. Fracastoro observing station for their warm hospitality and allowance of telescope time for the observations. In addition, ÖÇ is grateful to all the people working at the Catania Astrophysical Observatory for creating a stimulating and enjoyable atmosphere and, in particular, to the technical staff of the OAC, namely P. Bruno, G. Carbonaro, A. Distefano, M. Miraglia, A. Miccichè, and G. Occhipinti, for the valuable support in carrying out the observations. EBİLTEM Ege University Science Foundation Project No:08/BİL/0.27 and Turkish Scientific and Technical Research Council for supporting this work through grant Nr. 108T210. This research has been also partially supported by INAF and Italian MIUR. This research has been made use of the ADS and CDS databases, operated at the CDS, Strasbourg, France.
References
- [1] Alonso A., Arribas S., Martínez-Roger C., 1996, AAS, 117, 227
- [2] Cutri R. M., et al., 2003, The IRSA 2MASS All-Sky Point Source Catalog, NASA/IPAC Infrared Science Archive. http://irsa.ipac.caltech.edu/applications/Gator/
- [3] de Jager C., Nieuwenhuijzen H., 1987, A&A, 177, 217
- [4] Drilling J. S., Landolt A. U., 2000, Allen’s astrophysical quantities, 4th ed. Edited by Arthur N. Cox. ISBN: 0-387-98746-0. Publisher: New York: AIP Press; Springer, 2000, p.381
- [5] Flower P. J., 1996, ApJ, 469, 355
- [6] Frasca A., Guillout P., Marilli E., Freire Ferrero R., Biazzo K., Klutsch A., 2006, A&A, 454, 301
- [7] Girardi L., Bertelli G., Bressan A., Chiosi C., Groenewegen M. A. T., Marigo P., Salasnich B., Weiss A., 2002, A&A, 391, 195
- [8] Handler G., 1999, MNRAS, 309, L19
- [9] Handler G., & Shobbrook R. R., 2002, MNRAS, 333, 251
- [10] Hauck B., Mermillod M., 1998, A&AS, 129, 431
- [11] Hernández J., Calvet N., Briceño C., Hartmann L., Berlind P., 2004, AJ, 127, 1682
- [12] Kazarovets E.V., Samus, N.N., Durlevich O.V., Kireeva N.N., Pastukhova E.N., 2006, IBVS, No.5721
- [13] Lucy L. B., 1967, Z. Astrophys., 65, 89
- [14] Nordström B., Mayor M., Holmberg J., Pont F., Jorgensen B. R., Olsen E. H., Udry S., Mowlavi N., 2004, A&A, 418, 989
- [15] Perryman M.A.C., et al., 1997, AA 323, L49
- [16] Pojmanski G., 2002, AcA, 52, 397
- [17] Popper D. M., 1980, ARA&A, 18, 115
- [18] Queloz D., Allain S., Mermilliod J.-C., Bouvier J., Mayor M., 1998, A&A, 335, 183
- [19] Royer F., Zorec J., Fremat Y., 2004, “The A-Star Puzzle”, held in Poprad, Slovakia, July 8-13, 2004. Edited by J. Zverko, J. Ziznovsky, S.J. Adelman, and W.W. Weiss, IAU Symposium, No. 224. Cambridge, UK: Cambridge University Press, p.109
- [20] Shaw J. S., 1990, in Active Close Binaries, ed. C. İbanoǧlu, (Dordrecht; Kluwer), 241
- [21] Tokunaga A. T., 2000, ”Allen’s astrophysical quantities”, Fouth Edition, ed. A.N.Cox (Springer), p.143
- [22] Tobin W., Viton M. & Sivan J.-P., 1994, A&AS, 107, 385
- [23] Oh Kyu-D., 2005, JASS, 22, 233O
- [24] Otero S. A., 2003, IBVS, 5480
- [25] Viton M., Burgarella D., Cassatella A. & Prevot L., 1988, A&A, 205, 147
- [26] van Hamme W., 1993, AJ, 106, 2096
- [27] van Leeuwen F., 2007, A&A, 474, 653
- [28] Wilson R.E. and Devinney E.J., 1971, ApJ, 166, 605
- [29] ESA 1997, ESA SP-1200, The Hipparcos and Tycho Catalogues. ESA, Noordwijk
- [30] Southworth J., Smalley B., Maxted P. F. L., Claret A., Etzel P. B., 2005, MNRAS, 363, 529