On the 10-micron silicate feature in Active Galactic Nuclei
Abstract
The 10m silicate feature observed with Spitzer in active galactic nuclei (AGN) reveals some puzzling behavior. It (1) has been detected in emission in type 2 sources, (2) shows broad, flat-topped emission peaks shifted toward long wavelengths in several type 1 sources, and (3) is not seen in deep absorption in any source observed so far. We solve all three puzzles with our clumpy dust radiative transfer formalism. Addressing (1), we present the spectral energy distribution (SED) of SST1721+6012, the first type 2 quasar observed to show a clear 10m silicate feature in emission. Such emission arises in models of the AGN torus easily when its clumpy nature is taken into account. We constructed a large database of clumpy torus models and performed extensive fitting of the observed SED. We find that the cloud radial distribution varies as and the torus contains 2–4 clouds along radial equatorial rays, each with optical depth at visual 60–80. The source bolometric luminosity is . Our modeling suggests that of objects with tori sharing these characteristics and geometry would have their central engines obscured. This relatively low obscuration probability can explain the clear appearance of the 10m emission feature in SST1721+6012 together with its rarity among other QSO2. Investigating (2) we also fitted the SED of PG1211+143, one of the first type 1 QSOs with a 10m silicate feature detected in emission. Together with other similar sources, this QSO appears to display an unusually broadened feature whose peak is shifted toward longer wavelengths. Although this led to suggestions of non-standard dust chemistry in these sources, our analysis fits such SEDs with standard galactic dust; the apparent peak shifts arise from simple radiative transfer effects. Regarding (3) we find additionally that the distribution of silicate feature strengths among clumpy torus models closely resembles the observed distribution, and the feature never occurs deeply absorbed. Comparing such distributions in several AGN samples we also show that the silicate emission feature becomes stronger in the transition from Seyfert to quasar luminosities.
Subject headings:
dust, extinction — infrared: general — galaxies: active — quasars: individual: PG1211+143 — quasars: individual: SST1721+6012 — radiative transfer —1. INTRODUCTION
Unified schemes of active galactic nuclei (AGN) require an obscuring dusty torus around the central source, giving rise to a type 1 line spectrum when there is direct view of the central engine and type 2 characteristics when it is blocked (e.g. Antonucci, 1993; Urry & Padovani, 1995). The torus, which is comprised of dusty clouds that are individually optically thick (Krolik & Begelman, 1988), reprocesses the radiation it absorbs into longer wavelengths, creating a distinct signature in the observed infrared. Silicates, a major constituent of astronomical dust, reveal their presence through the spectral feature at 10 m. Among type 1 AGN, QSOs display the feature in emission (Siebenmorgen et al., 2005; Hao et al., 2005; Sturm et al., 2005), while average SEDs of Seyfert 1 galaxies have either a flat 10m feature (Wu et al., 2009) or show it in mild absorption (Hao et al., 2007). Seyfert 2 galaxies generally display an absorption feature with limited depth, much shallower than in ultra-luminous IR galaxies (e.g. Hao et al., 2007; Levenson et al., 2007). An intriguing result comes from the Spitzer observations of seven high-luminosity type 2 QSOs by Sturm et al. (2006). While individual spectra appear featureless, the sample average spectrum shows the 10m feature in emission.
Heated dust will produce the feature in emission whenever it is optically thin. When the dust optical depth at 10 m exceeds unity, the feature still appears in emission in viewing of the illuminated face of the dust but in absorption when the dust is between the observer and heating source. In the absence of a formalism for radiative transfer in clumpy media, early models of the AGN torus employed smooth density distributions instead (e.g. Pier & Krolik, 1992, 1993; Granato & Danese, 1994; Efstathiou & Rowan-Robinson, 1995; Granato et al., 1997; Fritz et al., 2006). These models predict that type 1 sources, where the observer has a direct view of the torus inner, heated face, will generally produce an emission feature, although some examples of absorption features do exist (Pier & Krolik, 1992; Efstathiou & Rowan-Robinson, 1995). Type 2 viewing in most cases produces an absorption feature, whose depth is quite large on occasion, much larger than ever observed. An emission feature is rarely produced from such viewing, but it should be noted that it is under certain conditions for instance in the model presented by Fritz et al. (2006). A formalism for handling clumpy media was developed by Nenkova et al. (2002, 2008a) (hereafter N02 & N08a); the formalism holds for volume filling factors as large as 10%. Their models show that a clumpy torus will never produce a very deep absorption feature and that the feature displays a much richer behavior than in smooth density models; in particular, type 1 viewing can produce an absorption feature in certain models and type 2 viewing can lead to an emission feature in others (Nenkova et al., 2008b, N08b henceforth).
While the Sturm et al. (2006) data suggest the possibility of a 10m emission feature in QSO2, the only unambiguous evidence for such a feature in a type 2 AGN was presented recently for the Seyfert galaxy NGC 2110 (Mason et al., 2009).111Teplitz et al. (2006) have suggested a 10m emission feature in the Spitzer spectrum of QSO2 FSC10214+4724. The suggestion is problematic because the object’s redshift is so high ( = 2.2856) that the 10m feature was not fully in the spectral range of the IRS instrument. The rest-frame spectrum is cut off around 12m, before the continuum longward of the feature could be established. Here we present the first unambiguous case of an emission feature in a type 2 quasar, SST1721+6012, and perform extensive fitting of its spectral energy distribution (SED) with clumpy torus models.
The comparison of torus model predictions with observations is somewhat problematic because the overwhelming majority of these observations do not properly isolate the torus IR emission. Starburst emission is a well known contaminant in many cases, and we selected SST1721+6012 for modeling precisely for this reason as its spectrum seems free of starburst indicators. However, even IR from the immediate vicinity of the AGN may not always originate exclusively from the torus. High-resolution observations of NGC1068 by Cameron et al. (1993) and recently by Mason et al. (2006) demonstrate that the torus contributes less than 30% of the 10m flux collected with apertures in this object, with the bulk of this flux coming from dust in the ionization cones (Braatz et al. (1993) also found that at least 40% of the 12.4m flux in this source do not originate from the torus). The significance of IR emission from the narrow line region (NLR) was noted also by Schweitzer et al. (2008). However, because the dust in the ionization cones is optically thin, its IR emission is isotropic and does not generate differences between types 1 and 2. Observations show that such differences do exist. In particular, the Hao et al. (2007) compilation of Spitzer IR observations shows a markedly different behavior for the 10m feature between Seyfert 1 and 2 galaxies. Accepting the framework of the unification scheme, these differences can be attributed only to the torus contribution. Thus it seems that, unfortunately, a general rule does not exist and the situation must be investigated case by case. Our aim here is to examine whether the torus contribution alone can reproduce the observed SED of SST1721+6012, yielding a range of possible parameter values that describe the dusty cloud distribution in this source (§2).
We also investigate the cause for apparent shifts of the silicate feature peaks towards long wavelengths (§3). Such shifts have been reported for sources that show the 10m feature in emission (Siebenmorgen et al., 2005; Sturm et al., 2005; Hao et al., 2005), and attributed to non-standard dust chemistry. However, these shifts were never seen in absorption, suggestive of radiative transfer effects instead. Finally, in §4 we compare the observed distribution of silicate feature strengths among the Hao et al. (2007) sample of AGN with the synthetic distribution of feature strengths in our database of clumpy torus model SEDs.
2. SILICATE 10-MICRON EMISSION FEATURE IN QSO2
Although not expected in type 2 sources, possible detection of the 10m emission feature was reported by Sturm et al. (2006). The feature was only identified after averaging the SEDs of a number of type 2 QSOs, which individually show no significant indication of the feature. Recently Mason et al. (2009) presented the first unequivocal detection of an emission feature in an individual type 2 source, the Seyfert galaxy NGC 2110. We present the Spitzer SED of the type 2 quasar SST1721+6012 that shows the 10m and 18m silicate features in emission. In this section we report on the results of fitting the SED of SST1721+6012 with clumpy torus models, and derive multiple parameters characterizing the source.
2.1. Observations
The source SSTXFLS J172123.1+601214 was first identified as an AGN candidate in the Spitzer First Look Survey (FLS) by Lacy et al. (2004). It has a redshift of , and was not present in the SDSS at that time. In 2007, Lacy et al. (2007a) categorized it as a type 2 quasar based on the presence of optical, narrow [N V] emission lines and through emission line ratio diagnostics introduced by Baldwin et al. (1981). In the same year Lacy et al. (2007b) presented, together with other sources, a wide-range SED for this source, including a mid-IR spectrum taken by the Infrared Spectrograph (IRS) aboard Spitzer.
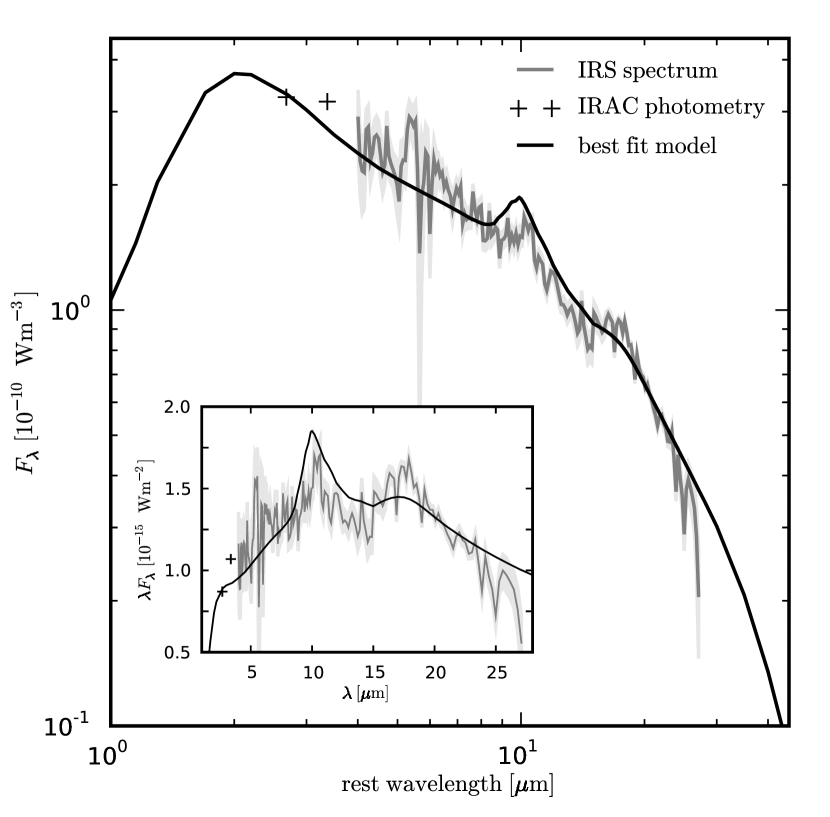
The IRS observations (Astronomical Observation Request 1406768) were taken on 2005 August 14 in staring mode using the short and long low resolution modules to obtain continuous coverage from 5.2–38 m, and were passed through the S14.0 version of the SSC pipeline. The signal-to-noise ratio varied through the spectrum, the deepest observations being targeted on the redshifted wavelengths of the strong spectral features expected to lie in the 7–15 m range. In the short wavelength module, two 14s ramps were taken in second order, and a single 60s ramp in first order. In the long wavelength module, two 30s ramps were taken in both first and second order. The spectra from each module were optimally extracted using SPICE.222http://ssc.spitzer.caltech.edu/postbcd/spice.html The resulting spectra were trimmed, combined, and resampled in constant energy bins of , resulting in a spectrum ranging from 4.0 m to 27.1 m (rest wavelength). Uncertainty estimates from SPICE were propagated through the process in the usual manner. For the fitting we excluded a few data points at shorter and at longer wavelengths due to poor signal-to-noise ratio. Additionally, we make use of two photometric data points from the Infrared Array Camera (IRAC) component of the Spitzer First Look Survey (Lacy et al., 2005) at rest wavelengths of 2.7 m and 3.4 m, both with very small intrinsic uncertainties, as they greatly help defining the shape of the SED in the regions of hot dust emission. Cross-calibration between IRS and IRAC is accurate to better than 10% (L. Yan, personal communication).
Despite a certain noisiness in the IRS spectrum, a clear presence of polycyclic aromatic hydrocarbon features (PAHs) can be safely excluded. Considering additionally its lack of a [Ne II] emission line at 12.8 m, the spectrum shows no signs of star formation. Furthermore, the SED seems free of other emission lines, with one disputable exception. Locally, the flux peaks around 10.5 m, which coincides with the [S IV] emission line at 10.51 m reported to be found in 11 out of 12 type 2 sources by Zakamska et al. (2008). This radiation, if indeed credited with an emission line, would stem from the AGN itself, but our spectrum does not show any other lines originating from the AGN, like [Ne III] at 15.5 m and [Ne V] at 14.3 m. Within the frame of this work, we therefore attribute the peak flux at 10.5 m entirely to silicate emission.
2.2. Modeling
N02 & N08a describe an analytic formulation of radiative transfer in a clumpy, dusty medium heated by a radiation source. The formalism was implemented in the code Clumpy, which takes as input a toroidal distribution of point-like dust clouds around a central source. The dust in each individual cloud has an optical depth , defined at 0.55 m, and standard ISM composition of 47% graphite with optical constants from Draine (2003) and 53% “cold” silicates from Ossenkopf, Henning, & Mathis (1992) (OHM hereafter). The dust sublimation temperature defines the torus inner radius and is set to . The cloud distribution is parametrized with the radial power law between and the outer radius , where and are free parameters. Another free parameter is , the average number of clouds along a radial equatorial ray. In polar direction the number of clouds per radial ray is characterized by a Gaussian, so that at angle from the equatorial plane it is , with the last free parameter of the cloud distribution. The final parameter is , the observer’s viewing angle measured from the torus axis.
We employed Clumpy to produce a large database333Models are available at http://www.pa.uky.edu/clumpy of model SEDs , with the total bolometric flux. The observations provide a set of fluxes, , at wavelengths , . Our fitting procedure involves searching the entire database for the model that minimizes the error
| (1) |
where are individual errors on the , and are the model fluxes at the same set of wavelengths as the data. Each model SED is scaled by the factor that minimizes , determining the AGN bolometric flux for this model. Since the data dynamic range is only , the fitting procedure can be safely executed in linear space.
2.3. Results
| Parameter | Sampled Values |
|---|---|
| 0, 0.5, 1, 1.5, 2, 2.5, 3 | |
| 1 - 25 | |
| 5, 10, 20, 30, 40, 60, 80, 100, 150, 200, 300, 500 | |
| 15, 20, 25, 30, 35, 40, 45, 50, 55, 60, 65, 70, 75, 80 | |
| 0, 10, 20, 30, 40, 50, 60, 70, 80, 90 | |
| 2 - 5, 10, 20, 30, 40, 50, 60, 70, 80, 90, 100, 150, 200 |
Note. — and are measured in degrees.
We calculated for all the Clumpy models whose parameters are listed in Table 1, resulting in a database of more than 4.7 million entries. This large set contains as a subset all the parameters that N08b found to be plausible. Figure 1 shows the data and the best-fitting Clumpy model. The two photometric IRAC points play a crucial role in the fits by expanding the data into the short wavelengths.
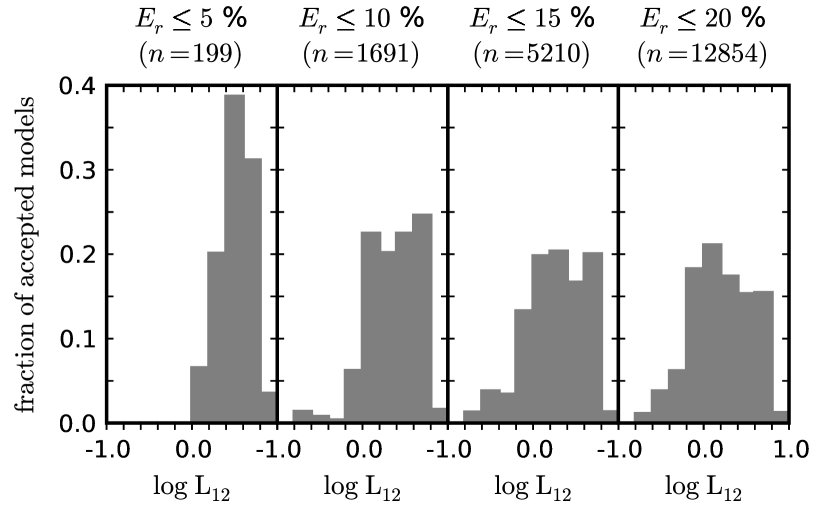
Although the model presented in Figure 1 produces the smallest nominal error , a number of other models have errors that differ from it only in the third significant digit. Because of the large degeneracy of the radiative transfer problem for heated dust, the SED is a poor constraint on the properties of the source; a meaningful determination of model parameters requires also high-resolution imaging at various wavelengths (e.g., Vinković et al., 2003). The axially symmetric clumpy torus model requires a relatively large number of input parameters, further exacerbating the degeneracy problem. We define as the relative deviation of a model from the best-fit one. Then, 199 models have , within a fraction of the minimal error = 0.212, and the bar diagrams of these models are shown in the top rows of Figures 2 and 3 for each of the six parameters. All but two of these models share the same value of , indicating that this parameter can be considered well constrained. Similarly, for 90% of all models is either 3 or 4, so this parameter is only slightly less well constrained. The distributions of the parameters , and are broader, but still show well defined peaks. For these parameters we can only deduce a plausible range. In contrast, the parameter has a flat distribution that covers every sampled value ; this parameter is undetermined, except for the indication of a lower bound.
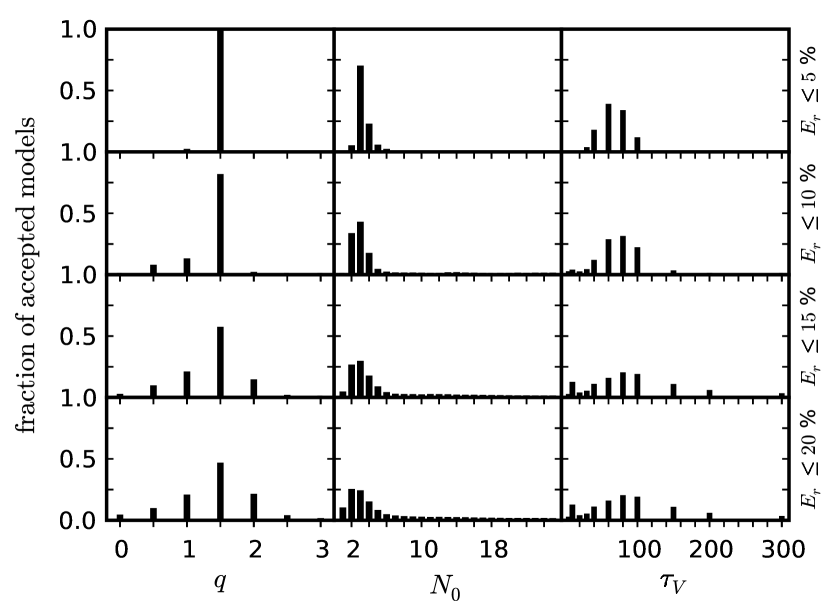
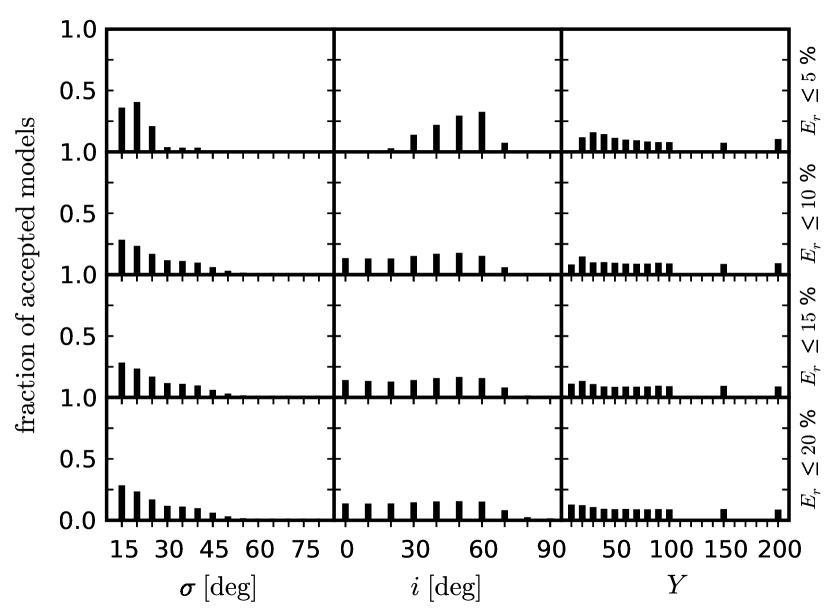
The choice is of course arbitrary. Increasing slightly the range of accepted models, the bar diagrams can be expected to remain peaked if the parameters are well constrained. The figures show that this is indeed the case for and , whose distributions remain reasonably peaked in spite of the large increase in the number of accepted models (almost 13,000 are selected by the criterion ). To a lesser degree, this is also the case for . In contrast, the distributions of and , which also start out peaked, flatten out significantly as the acceptance criterion is relaxed, indicating that SED analysis lacks the predictive power to constrain these parameters in SST1721+6012. The only meaningful results are that, in all likelihood, and , i.e., edge-on viewing is excluded. Furthermore, these parameters are not entirely independent of each other since a clear line of sight to the AGN can be obtained for different combinations of the two. In fact, the interdependence of , , and to some degree constitutes the greatest source of degeneracy within the clumpy torus SEDs. The final parameter, the torus radial thickness , is undetermined. As noted already in N08b, the SEDs of models with a steep radial cloud distribution () are insensitive to increasing because most of the clouds are concentrated in the torus inner region. The only constraint we can deduce is the lower bound , indicating that the torus could be compact, in agreement with other AGN observations (see N08b and references therein).
Table 2 summarizes the likely values constrained by fitting. We cannot give exact confidence intervals since our distributions are not continuous. If a parameter is perfectly constrained, all models then have the same value. Denoting by the fraction of models at the distribution peak value, such a parameter would have . On the other hand, a flat distribution over the entire range of sampled values indicates a completely non-constrained parameter. If the number of parameter values in the sampled range is , the height of each bar would then be . Introduce . A perfectly constrained parameter will have while for an unconstrained parameter , decreasing when the number of sampled values is increasing. We select as our sample the 1691 models with . While admittedly arbitrary, this selection ensures a strict acceptance criterion while still giving a statistically large sample. For each of the model parameters we identify the minimal interval around the distribution peak containing at least 90% of the sample’s models. These ranges are listed in Table 2, together with the number of sampled values (bars) in these intervals, which is our measure of . The last column lists the corresponding values of , reinforcing the perception conveyed by the bar diagrams regarding the degree of confidence (or lack thereof) in each of the derived model parameters.
This analysis shows that the radial cloud distribution in SST1721+6012 is well constrained at ; although the 90% range contains also , 81% of the models are at . The likely value of is similarly well constrained to the range 2–4; even though this parameter was densely sampled in steps of 1 all the way to 25, half of the 50,000 best models fall within this narrow range. The third reasonably well determined parameter is , whose likely value is between 30 and 100. Note that the values of these parameters for the best-fitting model are , and , and that the close agreement with the distribution peaks is not a given — in principle, the best-fit model could fall anywhere inside the acceptable ranges. We have tried to put stronger constraints on the less well-defined parameters , , and , by holding the values of the relatively well-constrained parameters fixed at , , and . This had little effect on the distributions of the unconstrained parameters, although the bar-diagrams became slightly more peaked, showing a hint of greater preference for . We conclude that it is impossible to deduce , , and for SST1721+6012 from SED analysis alone.
| Parameter | Best Fit | PeakaaValue of the parameter at the distribution peak. | 90%-RangebbRange around the peak containing at least 90% of the sample models. | BccNumber of sampled values in the 90%-range. | HddFraction of all accepted models at the distribution peak. | weeMeasure of how well the parameter is constrained (see text); the closer is to unity the higher is the significance of the determined value. The values for the last two entries cannot be directly compared to all others since the range of both and is finite whereas for all other parameters it is in principle unlimited. |
|---|---|---|---|---|---|---|
| 1.5 | 1.5 | 1 – 1.5 | 2 | 0.81 | 0.40 | |
| 3 | 3 | 2 – 4 | 3 | 0.42 | 0.14 | |
| 80 | 80 | 30 – 100 | 5 | 0.30 | 0.06 | |
| 30 | 20 | 20 – 200 | 11 | 0.13 | 0.01 | |
| 20 | 15 | 15 – 40 | 6 | 0.27 | 0.05 | |
| 60 | 50 | 0 – 60 | 7 | 0.16 | 0.02 |
Note. — Statistical indicators for the sample of all 1691 models with deviation from the best-fit model.
2.4. Source Type
In the standard form of the unification approach, the classification of an AGN as type 1 or 2 is uniquely determined by the relation between the viewing angle and the torus angular thickness . In a clumpy medium, on the other hand, the source type is a matter of probability. Denote by the average number of clouds along a radial ray at angle , then
| (2) |
is the probability that a photon emitted by the AGN will escape the torus. The source has a probability to appear as a type 1 AGN and as a type 2. With our Gaussian parametrization for the cloud angular distribution,
| (3) |
The AGN type is probabilistic, and it depends on , and .
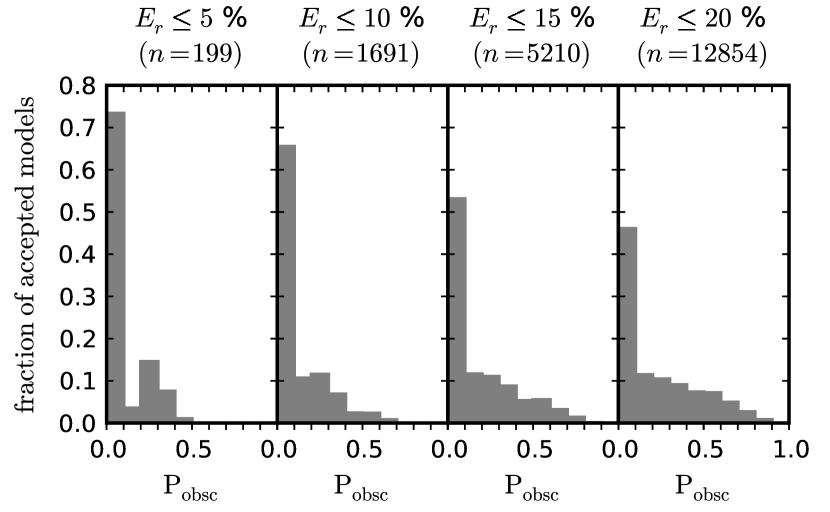
Since SST1721+6012 is a type 2 quasar, the a priori expectation would be that is large. We find this not to be the case. The best-fit model has = 27%, and more than 75% of all models with have . Figure 4 displays the histograms of for the models accepted at various tolerance levels, showing that the majority of models have (in the first 3 panels). Such low probability would pose a problem if these were the numbers for a large sample of type 2 sources. However, SST1721+6012 is a relatively rare type 2 quasar with a clear 10m emission feature; of the more than twenty QSO2 with measured IR SEDs, NGC 2110 is the only other source with such unambiguous emission feature. The emission feature requires a direct line of sight to a significant fraction of the hot surfaces of directly illuminated clouds on the far inner side of the torus. Because obscuration of the AGN involves a single line of sight while the IR flux measurements integrate over many lines of sight, the relatively low values of that emerge from the modeling are commensurate with the clear appearance of the 10m emission feature in SST1721+6012 and its rarity among other QSO2 (see also §3).
.
2.5. AGN Luminosity
Since the central engine is obscured in SST1721+6012, a direct measurement of the AGN bolometric luminosity is impossible. However, the bolometric flux enters directly into the fitting procedure (see Equation 1) as the scale factor that minimizes the error in matching the model spectral shape with the data. The source luminosity is then derived from its luminosity distance = 1.703 Gpc, obtained from the redshift for standard cosmological parameters (, , flat universe). The best-fit model has , and Figure 5 shows the distribution of derived for all fitted models within a given acceptance error. At the most restrictive level, all the models fall in the range and the mean value is 3.45, similar to the best-fit model. As the acceptance becomes less restrictive, the range of accepted models extends to luminosities lower than , but its upper boundary stays unchanged; the figure panels for and for instance are very similar except for the presence of more models in the latter. The reason is simple. The luminosity scale factor is , and as is evident from Figure 1, a large fraction of the integral is contained at wavelengths that are missing from the data as they are shorter than the IRAC measurements. Model SEDs that drop precipitously before the IRAC points can still produce a small error estimate by reasonably fitting all other, longer wavelengths. Such models will be formally acceptable–but only because the short wavelength region, crucial for the luminosity determination, is so poorly sampled in the data. Observations at these short wavelengths will constrain better the SED, and provide a more accurate determination of . With the current data, our best estimate is with a likely range of 1–7.
Integrating the mid-infrared (MIR) luminosity only, Lacy et al. (2007b) find . Richards et al. (2006) show that the bolometric correction from the mid-infrared is about a factor of eight. With this correction, the earlier estimate gives 4, in good agreement with the detailed Clumpy calculations.
3. FEATURE SHAPE AND ORIGIN OF 10-MICRON EMISSION
After many years in which it remained undetected in type 1 AGN, the 10m feature was finally discovered in emission in Spitzer observations (Siebenmorgen et al., 2005; Hao et al., 2005; Sturm et al., 2005). In addition, the 18m feature appears in quite prominent emission. All three teams noted the large differences with Galactic sources — the 10m emission feature in AGN is much broader, and in most cases its peak seems to be shifted to longer wavelengths, up to 11 m. Analyzing the feature with the simple approximation (optically thin emission from dust at the single temperature ), all three teams found significant differences between the dust absorption coefficient in AGN and the interstellar medium, suggestive of a different mix of the silicate components. Significantly, though, the shifts toward longer wavelengths apparent in emission features were never reported in absorption; AGN absorption features reach their deepest level at the same wavelengths as Galactic sources, 9.8 m. The different behavior of emission and absorption features suggests that the apparent peculiarities of AGN emission features do not arise from the dust composition, but rather from radiative transfer effects.
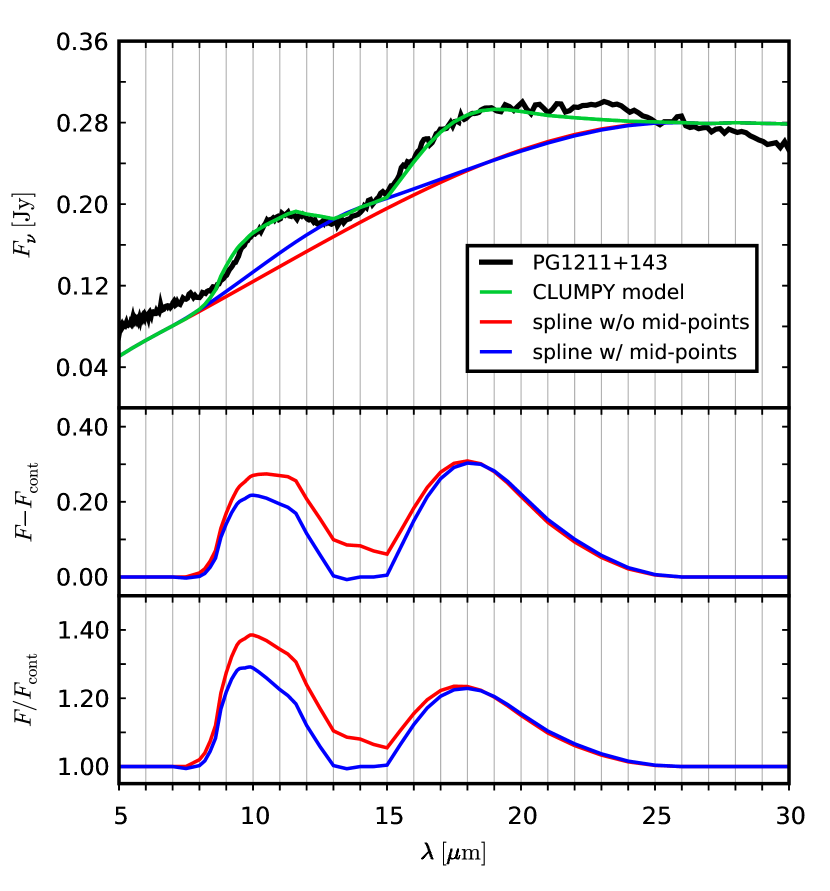
To further investigate this, we analyzed the Spitzer data of quasar PG1211+143, one of the sources in the original discovery paper of Hao et al. (2005), which shows both silicate features in emission. While the data cover 5–35 m, for the model fitting we employed only wavelengths between 8 and 30 m. Fitting the shorter wavelengths with our torus models proved rather difficult in this source. The same problem arises in other PG quasars, where Mor et al. (2009) find that high flux levels at short wavelengths necessitate the addition of a hot dust component to the torus emission in their models (see also Netzer et al., 2007). Wavelengths longer than 30 m were omitted in the fitting because of high noise levels. The top panel of Figure 6 plots the observed SED of PG1211+143 between 5 and 30 m in black color and the SED of the best-fit model in green. In addition to a prominent 18m feature, the displayed model shows a broad 10m feature that reaches local peak emission at 11.6 m. An analysis of the feature shape requires the construction of an underlying continuum. Sirocky et al. (2008) discuss this problem in detail and show that the proper continuum definition requires a spline fitted to the two wavelength regions shorter than the 10m feature and longer than the 18m feature, and in between them. This spline fit to the model results is shown with blue color in the figure. Although the central region, 14–14.5 m, is essential for a correct definition of the continuum, it was missing from earlier analyses. The corresponding spline is plotted in red for comparison. The figure middle panel shows the continuum-subtracted flux in each case. The feature peaks at 10.0 m in the properly constructed continuum, but has a flat plateau between 9.8–11.6 m that peaks nominally at 10.5 m in the traditional continuum. The bottom panel shows the ratio for each continuum. Under the common parametrization with , the curves would be taken as the actual dust absorption coefficient. However, they are the outcome of radiative transfer calculations with the standard OHM dust, whose absorption profile looks quite different; these artificial “absorption coefficients” are much flatter than the peaked shape of the input .
The reason for the peculiar shape of the emission feature is quite simple. The feature originates from the optically thin emitting layer on the bright surfaces of clouds illuminated directly by the AGN. Absorption by other clouds encountered on the way out toward the observer alters the feature’s shape. This absorption is strongest at the feature peak, where the absorption coefficient is largest, and 20 is where single clouds become optically thick at that peak. When the generated photons encounter 1 cloud along the remaining part of the path toward the observer, the peak is absorbed while photons in the wings escape freely, effectively flattening the shape of the feature. An increasing number of clouds along the path would absorb the peak and the wings of the feature more strongly, producing a self-absorption dip in the feature’s shape, and eventually suppressing the entire feature (see also Fig. 2 in N08b). The apparent shift toward longer wavelengths arises from the interplay with the shape of the rising continuum underneath the feature. It may be noted that such apparent variations in the shape of the silicate emission feature in evolved stars prompted the suggestion of dust chemical evolution (Little-Marenin & Little, 1990; Stencel et al., 1990), but were similarly shown to reflect radiative transfer effects (Ivezić & Elitzur, 1995).
| Parameter | Best Fit | PeakaaRanges of 1 standard deviation from a sample’s mean value. | 90%-RangebbThe 2-standard deviations range. | Bccfootnotemark: | Hddfootnotemark: | weefootnotemark: |
|---|---|---|---|---|---|---|
| 20 | 20 | 20 | 1 | 1.00 | 1.00 | |
| 0 | 0 | 0 – 0.5 | 2 | 0.61 | 0.30 | |
| 20 | 20 | 20 – 30 | 2 | 0.50 | 0.25 | |
| 5 | 6,7**Peak comprises multiple bins; all listed bins have equal heights. | 2 – 9 | 8 | 0.21 | 0.03 | |
| 25 | 25 | 15 – 60 | 10 | 0.29 | 0.03 | |
| 60 | 0,10,20,40**Peak comprises multiple bins; all listed bins have equal heights. | 0 – 70 | 8 | 0.14 | 0.02 |
Note. — Statistical indicators for the sample of all 28 models with relative deviation from the best-fit model, and with (see text), listed in descending order of constraint. Footnotes a–f identical to Table 2.
Table 3 summarizes the analysis of the distribution of all Clumpy models with fitting errors within 10% of the best-fit model. This prescription is identical to the one employed for SST1721+6012, but in the present case it yields only 38 models instead of 1691. These models further break into two distinct groups with different ranges of , the radial number of clouds in the equatorial plane. While 28 models have , the other 10 fall in the = 16–18 range, with a large gap between the two groups. Because values of larger than 10 are unlikely in general (see §3.4 in N08b), we exclude the ten models with from our sample.
As before, only three parameters are well constrained. The radial cloud distribution is again well-constrained, but now it is flat with . This leads to a strongly constrained torus thickness , in sharp contrast with SST1721+6012 where is the least-well constrained parameter. All 28 models in the selected sample have the same value of , although this probably reflects our discrete sampling of parameter space; there could be a small range around = 20, but 10 and 30 are clearly excluded. The cloud optical depth is well-constrained at . On the other hand, while well constrained for SST1721+6012, is the least well constrained parameter here, with a likely range of 2–9 clouds.
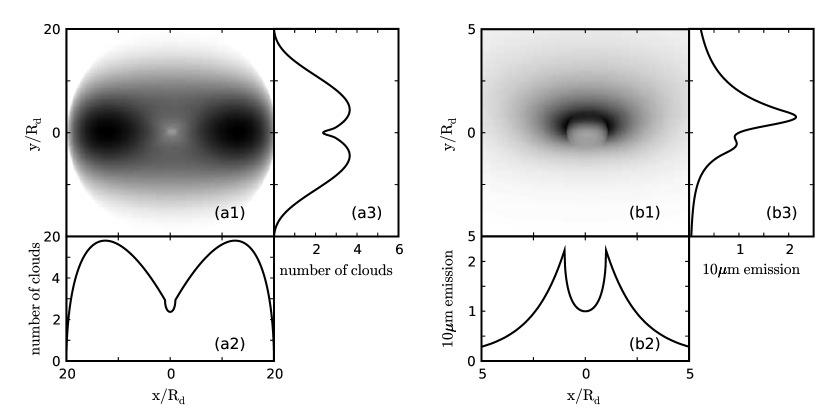
As noted above, flat-top emission features arise from absorption by a single cloud with 20. As is evident from Table 3, all accepted models have 20–30, but is largely unconstrained. However, the average number of clouds along the line of sight to the AGN (see Equation 3) falls within the narrow range for all accepted models. To a certain degree, is a good proxy for the typical number of clouds along lines of sight that pass close to the dust sublimation radius, where the 10m emission is originating. In panel (a1) of Figure 7 we show the number of clouds along all lines of sight through the best-fit torus model. Panel (a2) shows a one-dimensional cut through the image, providing the profile of the number of clouds per ray along the -coordinate at . Due to the axial symmetry of the torus, this profile is symmetric with respect to , irrespective of the viewing angle. The signature of the central cavity is clearly visible in this profile: the cloud column reaches a minimum of 2.4 at the center and stays close to this level for all . It reaches a maximum of clouds along rays roughly away from the AGN. Panel (a3) shows the corresponding profile in the vertical direction at . The symmetry of this profile around again reflects the axial symmetry, which ensures equal path lengths through the torus above and below the central line of sight.
While the number of clouds along two lines of sight displaced symmetrically from the center is equal, the illumination patterns of individual clouds as seen by the observer can differ for the two, depending on the position angle in the plane of the sky. In panel (b1) we plot the two-dimensional distribution of the model 10m emission for the central region with size . Roughly 50% of the flux is detected within the inner radius, and 70% of that fraction comes from the image upper half. This radiation originates from regions on the far inner face of the torus; no emission originates from the near side, where the observer faces the dark sides of the clouds. Similar to panels (a2) and (a3), we plot in panels (b2) and (b3) profiles of the 10m emission along the and directions. As expected, the horizontal profile in panel (b2) is symmetrical, clearly displaying the dust-free cavity at its center. On the other hand, the shape of the vertical profile in (b3) reveals the asymmetry between the emission in the upper and lower halves. Despite equal cloud columns along viewing lines above and below the image center, the emission is not equal, owing to the strong anisotropy of single cloud emission. The 10m emission originates from hot, bright surfaces of clouds located on the torus far inner face. Clouds in the torus near side, which show their dark, cooler faces, only absorb the 10m photons that were emitted on the torus far side.
Most clumpy torus models do not produce the apparent shift in peak emission. The shifts occur predominantly in models that have a small ( 20). Significantly, 20 models are also the ones producing the most prominent 10m emission features across the likely range of . As is evident from Fig. 16 in N08b, the emission feature strength decreases monotonically as increases up to 70; in some cases the feature even switches to absorption for pole-on viewing. Therefore low- models stand out in their feature strength and it is reasonable that such sources would be preferentially selected in observations that looked to identify the 10m silicate emission feature in AGN. Finally, it should be noted that the absorption coefficients widely used in the literature do not have their peaks at 9.8 m. In the tabulation of Draine (2003), the feature peaks at 9.48 m instead. The “cold” silicate dust of OHM, which is the one used here, has its peak at 10.0 m. The effect on the present discussion is insignificant.
4. SPECTRAL PROPERTIES OF CLUMPY MODELS
In addition to the detailed fitting of the SST1721+6012 and PG1211+143 data, we investigated some other properties of the 10m feature, comparing observations with general properties displayed by the model database.
Hao et al. (2007) present a large compilation of Spitzer mid-IR spectra. Although a loosely defined sample, it is the largest gathered thus far. For each source they measure the 10m silicate feature strength from
| (4) |
where is the measured flux, is a continuum constructed underneath the 10m and 18m silicate features (see Sirocky et al., 2008, for details; see also §3), and is the peak wavelength of the feature strength; emission features have a positive , absorption features a negative one.444The feature strengths of SST1721+6012 are = 0.26 and = 0.34 (for the 18m feature). Both are uncertain to within 0.1. For the model shown in Figure 6, the feature strengths determined from the blue curve are and (at 18.0 m), and and (at 17.5 m) from the red curve. It may be noted that the specific prescription of continuum construction modifies, and can even reverse, the relative strengths of the 10m and 18m features, as is also apparent from Figure 6; the ratio of the two strengths is an important indicator of dust optical properties (Sirocky et al., 2008).
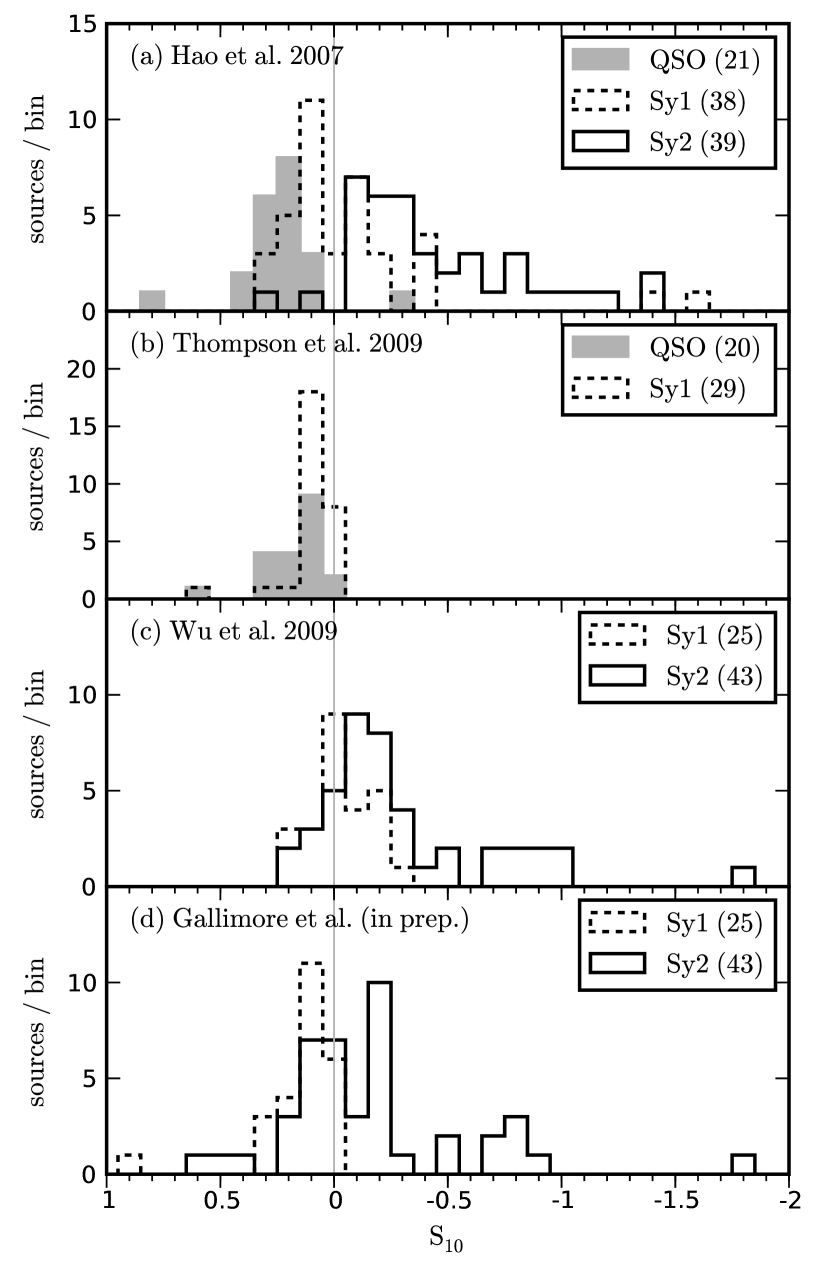
Removing all ULIRGs, the Hao et al. (2007) sample contains 21 QSOs, 38 Seyfert 1 and 39 Seyfert 2 galaxies. The top panel of Figure 8 shows the histograms of the feature strengths for the three groups. The figure other panels show results from recent studies, which produced additional compilations of feature strengths: Thompson et al. (2009) compared a sample of Seyfert 1 galaxies with quasars, Wu et al. (2009) and Gallimore et al. (in preparation) analyzed Seyfert galaxies, both type 1 and 2, from the 12m Galaxy Sample (Rush et al., 1993). While Wu et al. adopt the original source classification of Rush et al., Gallimore et al. establish a different source type in several cases, based on work published elsewhere. We employ the latter classification in both panels (c) and (d), dispensing with all sources re-classified as LINERs or HII (star-forming) galaxies and confirming the Wu et al. suggestion that the re-classification of several sources has little effect on the statistical results of measurements.
In addition to the torus emission, the infrared radiation of many active galaxies contains a starburst contribution whose fractional strength varies from source to source (e.g., Netzer et al., 2007). Removing the starburst component by subtracting a suitable template and leaving no PAH residuals is thus an important preliminary step in the detailed SED analysis of many individual AGN (see, e.g., Mor, Netzer, & Elitzur, 2009). Note, however, that the two sources analyzed here in detail show no signs of ongoing star formation, either in the form of PAH emission or far-IR (FIR) emission. While PAH emission can contaminate the 10m region in some individual spectra, its overall impact on the averages of large samples seems minimal. Netzer et al. (2007) subtract a starburst template from the average spectra of AGN with and without strong FIR detections and find that the MIR regions are hardly affected by this subtraction in either case. In particular, their Figure 6 shows that the strength of the 10m silicate feature barely changes. The analyses by Wu et al. (2009) and Gallimore et al. (in preparation) of the same data set provide an even stronger evidence: The former ignores the potential starburst contribution while the latter includes a PAH component, handled with the Pahfit tool (Smith et al., 2007). In spite of this difference, the histograms in panels (c) and (d) of Figure 8 are quite similar, showing comparable lower and slightly increased upper limits on and an overall shape that is essentially the same.
Comparison of the histograms for type 1 sources in the panels of Figure 8 shows that in moving from Seyfert to quasar luminosities the 10m feature shifts to enhanced emission. This trend was noted earlier in Nenkova et al. (2008b; see §6.4), and the analysis here verifies this suggestion, giving it quantitative evidence. Nenkova et al. point out that the most likely explanation is that the number of clouds along radial rays is smaller in quasars than in Seyferts.
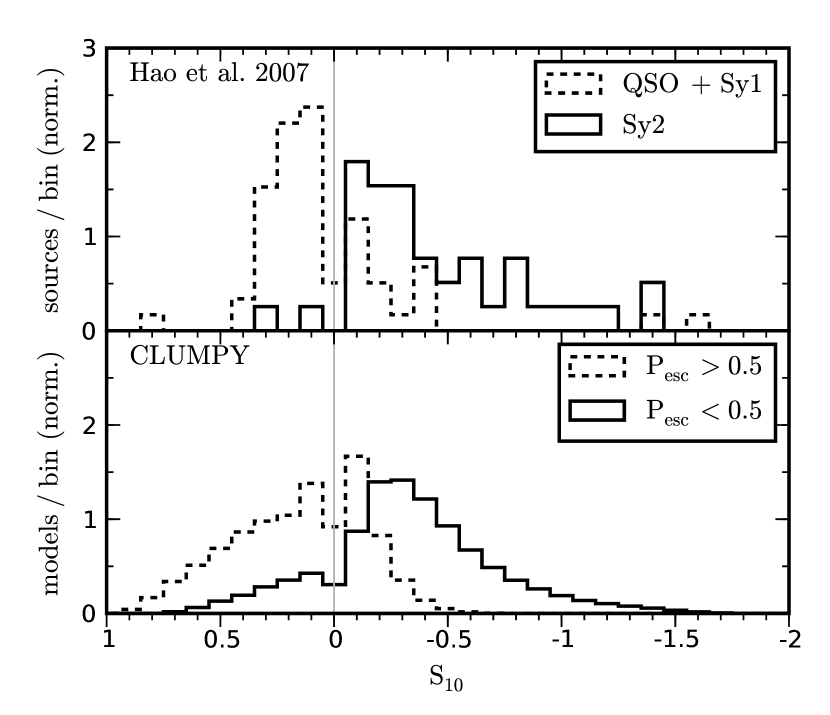
Grouping together the QSOs and Seyfert 1s of the Hao et al. (2007) sample, the top panel of Figure 9 shows the histograms and Table 4 lists the statistical indicators of the distributions in type 1 and 2 sources. Most sources exhibit rather small absolute values of . The histogram of type 1 sources is clearly shifted toward emission in comparison with type 2. Although the Hao et al. (2007) sources do not constitute a complete sample, the selection criteria were unrelated to the silicate feature. The derived histograms can thus be reasonably considered representative of the differences between types 1 and 2.
Our clumpy torus models should produce similar histograms if they bear a resemblance to the IR emission from AGN. Such a comparison presents two fundamental difficulties. First, the assignment of a given clumpy model to type 1 or 2 is not deterministic — only a probability can be assigned. We handle this problem by dividing the models according to the probability for an unobscured view of the AGN. The collection of models with can be expected to resemble the behavior of the type 1 population, those with type 2. The second problem is that the actual distribution of parameter values is unknown. Since we do not have any handle on these distributions, we decided to test the adequacy of histograms produced by a uniform sampling of the model parameters within the bounds deduced in N08b: , , , , and . Since was sampled here more thoroughly than in N08b, we use the full range listed in Table 1. The parameters were sampled in steps of 0.5, 1, 10, 5, 10, 10 for , , , , , , respectively. The bottom panel of Figure 9 shows the histograms of for all database models selected by these criteria. These distributions resemble those of the observational sample, as is also evident from their statistical properties listed in Table 4. The and ranges of given in the table contain sources and models within 1 and 2 standard deviations from the mean of each of the two distributions. Leading to exclusion of only few sources and models at the very ends of the distributions, this additional selection has the effect of a much more meaningful agreement of the two distribution widths, not spoiled by rare outliers. At the level, rejected sources are just 3 type 1 and 2 Seyfert 2s, and among the sample of models only 4% of those with ¿ 0.5 and 6% with ¡ 0.5 are excluded due to this criterion.
Although the choice of uniform sampling of the model database is arbitrary, it produces reasonable results. The reason is that, as noted already in N08a and N08b, clumpy models never produce very deep absorption features, in agreement with observations. This limited range is reflected in the histograms for any reasonable criteria used for model selection from the database. The other main characteristic of the observed histograms is the separation between type 1 and 2 sources, and this, too, is reproduced reasonably well by the models.
| Hao et al. (2007) | Clumpy | |||
|---|---|---|---|---|
| source type | QSO + Sy1 | Sy2 | ||
| sample size | 59 | 39 | 340,000 | 500,000 |
| mean | 0.03 | -0.46 | 0.15 | -0.33 |
| median | 0.12 | -0.34 | 0.12 | -0.32 |
| 0.36 | 0.40 | 0.29 | 0.38 | |
| 1-rangeaaRanges of 1 standard deviation from a sample’s mean value. | -0.30, 0.37 | -0.83, -0.06 | -0.14, 0.44 | -0.71, 0.04 |
| 2-rangebbThe 2-standard deviations range. | -0.44, 0.40 | -1.20, 0.29 | -0.42, 0.73 | -1.09, 0.42 |
Note. — Samples of AGN and of Clumpy models as in Figure 9.
5. SUMMARY AND DISCUSSION
Spitzer IR observations of AGNs have increased significantly the number and quality of SEDs for these objects and produced some puzzling results, especially with regard to the 10m silicate feature. These include (1) detection of the feature in emission in type 2 sources, (2) emission features with broad, flat-topped peaks shifted toward long wavelengths in several type 1 sources, and (3) absence of any deeply absorbed features. None of these observations can be satisfactorily explained with smooth density torus models.
Here we have shown that clumpy torus models provide reasonable explanations for all three puzzles. To that end we have fitted the Spitzer SEDs of two very different sources with our Clumpy models. One source, SST1721+6012, is the first type 2 QSO to show a clear 10m emission feature. Our analysis provides a reasonable fit of the SED with a model that shows the feature in emission. In contrast with smooth density models, where the AGN is either obscured or visible, our model produces a small obscuration probability, = 27%, for this type 2 source. This relatively low probability may explain why SST1721+6012 is the only source among more than 20 type 2 QSOs with measured SEDs (see, e.g., Polletta et al., 2008) to show a clear 10m emission feature.
Addressing the second puzzle, PG1211+143 is one of the first QSOs to display the 10m silicate feature in emission, a feature that is unexpectedly broad and apparently shifted to longer wavelengths. The original attempts to explain these properties invoked non-standard chemical dust composition. Our modeling shows that the shifts are only apparent and result from the flattening of the feature peak by radiative transfer in clumpy media. The feature is well reproduced by clumpy models with standard dust. The third observational puzzle, lack of deep 10m absorption features in any AGN, has already been shown to be a signature of clumpy dust distributions (Nenkova et al., 2002; Levenson et al., 2007; Sirocky et al., 2008; Nenkova et al., 2008a, b). Here we go a step further and produce the histogram of 10m feature strength for a large sample of AGN Clumpy models. The result is in good qualitative agreement with the sample observed by Hao et al. (2007). In particular, the median values of both type 1 and type 2 observed distributions and their widths are well reproduced by the model database.
The IR SED generally does not constrain very tightly the properties of dusty sources — the large degeneracy of the radiative transfer problem for heated dust is well known (e.g., Vinković et al., 2003). In the present case, the problem is further exacerbated by the clumpy nature of the dust distribution and the non-spherical geometry. Our model database contains close to 5 million entries, and although the fitting procedure eliminates most of them, many produce reasonable agreement with the observations. In the case of SST1721+6012, close to 1,700 models with very different parameters deviate by no more than 10% from the best-fit model. And while the much higher quality of data in PG1211+143 greatly reduces the number of acceptable models, there are still 28 different ones that are practically indistinguishable in the quality of their fits. In the face of this degeneracy, we have developed a statistical approach to assess the meaningfulness of the various torus parameters derived from the fits. We find that some parameters are well constrained in each case, while others are not. In both sources the power law of the radial distribution () and the optical depth of a single cloud () are well constrained, while the torus viewing angle () and its angular thickness () are not. Both the cloud number () and radial thickness () are well constrained in only one of the sources, a different one in each case. Asensio Ramos & Ramos Almeida (2009) have recently developed a different, novel approach to tackle the degeneracy problem. They interpolate the Clumpy SEDs by means of an artificial neural network function, allowing them to study the parameter distributions as if they were continuous, and employ Bayesian inference to determine the most likely set of parameters. Applying this method to a selection of sources, Ramos Almeida et al. (2009) find that the principal ability to constrain different Clumpy parameters strongly depends on the individual source. We have already begun an extensive comparison of the two approaches and will report our findings elsewhere.
Although the SED alone is generally insufficient for determining all the torus parameters with certainty, the success in resolving outstanding puzzling behavior of the 10m feature in AGN is encouraging and enhances confidence in the clumpy torus paradigm.
ACKNOWLEDGMENTS
We are indebted to Jack Gallimore for kindly providing his measurements of silicate feature strengths prior to publication and agreeing to their inclusion in Figure 8. We thank Lei Hao for providing her original data (included in Figures 8 and 9 and Table 4), and Nancy Levenson for the SED of PG1211+143 (Figure 6). We further thank Cristina Ramos Almeida, Eckhard Sturm and the anonymous referee for valuable comments. ME acknowledges the support of NSF (AST-0807417) and NASA (SSC-40095). RN appreciates early PhD support by A. Feldmeier and DFG (Fe 573/3).
References
- Antonucci (1993) Antonucci, R. 1993, ARA&A, 31, 473
- Asensio Ramos & Ramos Almeida (2009) Asensio Ramos, A., & Ramos Almeida, C. 2009, ApJ, 696, 2075
- Baldwin et al. (1981) Baldwin, J. A., Phillips, M. M., & Terlevich, R. 1981, PASP, 93, 5
- Braatz et al. (1993) Braatz, J. A., Wilson, A. S., Gezari, D. Y., Varosi, F., & Beichman, C. A. 1993, ApJ, 409, L5
- Cameron et al. (1993) Cameron, M., Storey, J. W. V., Rotaciuc, V., Genzel, R., Verstraete, L., Drapatz, S., Siebenmorgen, R., & Lee, T. J. 1993, ApJ, 419, 136
- Draine (2003) Draine, B. T. 2003, ApJ, 598, 1017
- Efstathiou & Rowan-Robinson (1995) Efstathiou, A., & Rowan-Robinson, M. 1995, MNRAS, 273, 649
- Fritz et al. (2006) Fritz, J., Franceschini, A., & Hatziminaoglou, E. 2006, MNRAS, 366, 767
- Granato & Danese (1994) Granato, G. L., & Danese, L. 1994, MNRAS, 268, 235
- Granato et al. (1997) Granato, G. L., Danese, L., & Franceschini, A. 1997, ApJ, 486, 147
- Hao et al. (2005) Hao, L., et al. 2005, ApJ, 625, L75
- Hao et al. (2007) Hao, L., Weedman, D. W., Spoon, H. W. W., Marshall, J. A., Levenson, N. A., Elitzur, M., & Houck, J. R. 2007, ApJ, 655, L77
- Ivezić & Elitzur (1995) Ivezić, Z., & Elitzur, M. 1995, ApJ, 445, 415
- Krolik & Begelman (1988) Krolik, J. H., & Begelman, M. C. 1988, ApJ, 329, 702
- Lacy et al. (2007a) Lacy, M., Petric, A. O., Sajina, A., Canalizo, G., Storrie-Lombardi, L. J., Armus, L., Fadda, D., & Marleau, F. R. 2007a, AJ, 133, 186
- Lacy et al. (2007b) Lacy, M., Sajina, A., Petric, A. O., Seymour, N., Canalizo, G., Ridgway, S. E., Armus, L., & Storrie-Lombardi, L. J. 2007b, ApJ, 669, L61
- Lacy et al. (2004) Lacy, M., et al. 2004, ApJS, 154, 166
- Lacy et al. (2005) —. 2005, ApJS, 161, 41
- Levenson et al. (2007) Levenson, N. A., Sirocky, M. M., Hao, L., Spoon, H. W. W., Marshall, J. A., Elitzur, M., & Houck, J. R. 2007, ApJ, 654, L45
- Little-Marenin & Little (1990) Little-Marenin, I. R., & Little, S. J. 1990, AJ, 99, 1173
- Mason et al. (2006) Mason, R. E., Geballe, T. R., Packham, C., Levenson, N. A., Elitzur, M., Fisher, R. S., & Perlman, E. 2006, ApJ, 640, 612
- Mason et al. (2009) Mason, R. E., Levenson, N. A., Shi, Y., Packham, C., Gorjian, V., Cleary, K., Rhee, J., & Werner, M. 2009, ArXiv e-prints
- Mor et al. (2009) Mor, R., Netzer, H., & Elitzur, M. 2009, ArXiv e-prints
- Nenkova et al. (2002) Nenkova, M., Ivezić, Ž., & Elitzur, M. 2002, ApJ, 570, L9
- Nenkova et al. (2008a) Nenkova, M., Sirocky, M. M., Ivezić, Ž., & Elitzur, M. 2008a, ApJ, 685, 147
- Nenkova et al. (2008b) Nenkova, M., Sirocky, M. M., Nikutta, R., Ivezić, Ž., & Elitzur, M. 2008b, ApJ, 685, 160
- Netzer et al. (2007) Netzer, H., et al. 2007, ApJ, 666, 806
- Ossenkopf et al. (1992) Ossenkopf, V., Henning, T., & Mathis, J. S. 1992, A&A, 261, 567
- Pier & Krolik (1992) Pier, E. A., & Krolik, J. H. 1992, ApJ, 401, 99
- Pier & Krolik (1993) —. 1993, ApJ, 418, 673
- Polletta et al. (2008) Polletta, M., Weedman, D., Hönig, S., Lonsdale, C. J., Smith, H. E., & Houck, J. 2008, ApJ, 675, 960
- Ramos Almeida et al. (2009) Ramos Almeida, C., et al. 2009, ApJ, 702, 1127
- Richards et al. (2006) Richards, G., et al. 2006, in Astronomical Society of the Pacific Conference Series, Vol. 357, Astronomical Society of the Pacific Conference Series, ed. L. Armus & W. T. Reach, 261–+
- Rush et al. (1993) Rush, B., Malkan, M. A., & Spinoglio, L. 1993, ApJS, 89, 1
- Schweitzer et al. (2008) Schweitzer, M., et al. 2008, ApJ, 679, 101
- Siebenmorgen et al. (2005) Siebenmorgen, R., Haas, M., Krügel, E., & Schulz, B. 2005, A&A, 436, L5
- Sirocky et al. (2008) Sirocky, M. M., Levenson, N. A., Elitzur, M., Spoon, H. W. W., & Armus, L. 2008, ApJ, 678, 729
- Smith et al. (2007) Smith, J. D. T., et al. 2007, ApJ, 656, 770
- Stencel et al. (1990) Stencel, R. E., Nuth, III, J. A., Little-Marenin, I. R., & Little, S. J. 1990, ApJ, 350, L45
- Sturm et al. (2006) Sturm, E., Hasinger, G., Lehmann, I., Mainieri, V., Genzel, R., Lehnert, M. D., Lutz, D., & Tacconi, L. J. 2006, ApJ, 642, 81
- Sturm et al. (2005) Sturm, E., et al. 2005, ApJ, 629, L21
- Teplitz et al. (2006) Teplitz, H. I., et al. 2006, ApJ, 638, L1
- Thompson et al. (2009) Thompson, G. D., Levenson, N. A., Uddin, S. A., & Sirocky, M. M. 2009, ApJ, 697, 182
- Urry & Padovani (1995) Urry, C. M., & Padovani, P. 1995, PASP, 107, 803
- Vinković et al. (2003) Vinković, D., Ivezić, Ž., Miroshnichenko, A. S., & Elitzur, M. 2003, MNRAS, 346, 1151
- Wu et al. (2009) Wu, Y., Charmandaris, V., Huang, J., Spinoglio, L., & Tommasin, S. 2009, ApJ, 701, 658
- Zakamska et al. (2008) Zakamska, N. L., Gómez, L., Strauss, M. A., & Krolik, J. H. 2008, AJ, 136, 1607