Ubiquitous High Speed Transition Region and Coronal Upflows in the Quiet Sun
Abstract
We study the line profiles of a range of transition region (TR) emission lines observed in typical quiet Sun regions. In magnetic network regions, the Si IV 1402 Å, C IV 1548 Å, N V 1238 Å, O VI 1031Å, and Ne VIII 770 Å spectral lines show significant asymmetry in the blue wing of the emission line profiles. We interpret these high-velocity upflows in the lower and upper TR as the quiet Sun equivalent of the recently discovered upflows in the low corona above plage regions (Hara et al. 2008). The latter have been shown to be directly associated with high-velocity chromospheric spicules that are (partially) heated to coronal temperatures and play a significant role in supplying the active region corona with hot plasma (De Pontieu et al. 2009). We show that a similar process likely dominates the quiet Sun network. We provide a new interpretation of the observed quiet Sun TR emission in terms of the relentless mass transport between the chromosphere and corona - a mixture of emission from dynamic episodic heating and mass injection into the corona as well as that from the previously filled, slowly cooling, coronal plasma. Analysis of the observed upflow component shows that it carries enough hot plasma to play a significant role in the energy and mass balance of the quiet corona. We determine the temperature dependence of the upflow velocities to constrain the acceleration and heating mechanism that drives these upflows. We also show that the temporal characteristics of these upflows suggest an episodic driver that sometimes leads to quasi-periodic signals. We suggest that at least some of the quasi-periodicities observed with coronal imagers and spectrographs that have previously been interpreted as propagating magnetoacoustic waves, may instead be caused by these upflows.
Subject headings:
Sun: magnetic fields - Sun: chromosphere - Sun: transition region - Sun: corona1. Introduction
One of the most overlooked but important problems in solar and stellar physics is the nature of the transport mechanism that is required to supply enough mass from the cool chromosphere to the hot corona to counter the effects of the slow, but steady cooling and draining of the corona on timescales of order half an hour (Schrijver & Zwaan 2000). Ever since their discovery in the late 1800s when “vertical flames” where first seen at the limb during total solar eclipse (Secchi 1877), spicules or dynamic jet-like extrusions (Roberts 1945; Beckers 1968) have received much attention as agents in the transport of energy and mass in the lower solar atmosphere (e.g., Thomas 1948; Pneuman & Kopp 1978; Athay & Holzer 1982). This is because the mass they carry upward is estimated to be two orders of magnitude larger than that needed to supply mass to the corona and solar wind (e.g., Athay & Holzer 1982). One shortcoming was that a signature of these ejecta could not be observed at “typical” coronal temperatures (e.g., Withbroe 1983) and so the concept of spicules as a hot mass transport mechanism for the outer solar atmosphere has been largely mothballed.
The Solar Optical Telescope (SOT; Tsuneta et al. 2008) of Hinode (Kosugi et al. 2007) has revolutionized our view of the dynamic chromosphere revealing the existence of at least two types of spicules (De Pontieu et al. 2007b). “Type-I” spicules are long-lived (3-5 minutes) and exhibit longitudinal motions of the order of 20km/s that are driven by shocks resulting from the leakage of p-modes and convective motions, as well as magnetic energy release in regions around strong magnetic flux concentrations (De Pontieu et al. 2004; Hansteen et al. 2006; De Pontieu et al. 2007a; Martínez-Sykora et al. 2009). Their contribution to TR emission may be limited to a hot sheath with little of the chromospheric plasma heated to TR temperatures (de Wijn & De Pontieu 2006; Judge 2008). “Type-II” spicules, on the other hand, inhabit a truly different dynamic regime than the “classical” spicules studied by Roberts (1945) (or others) and have a direct impact on the TR. These recently discovered spicules show much shorter lifetimes (50-100s) and higher velocities (50-150 km/s), and are likely caused by reconnection (De Pontieu et al. 2007b). Type II spicules often exhibit only upward motion, with the feature fading along its entire length in a matter of seconds, which is suggestive of rapid heating to (at least) TR temperatures.
De Pontieu et al. (2009) (hereafter D2009) recently studied active region plage and discovered a direct connection between Type-II spicules and a persistent, faint, but strongly blue-shifted component of emission in hot coronal lines at the magnetic footpoints of loops. Their work suggests that coronal heating often occurs at chromospheric heights in association with jets that are driven from below and supply the corona with a significant fraction of the required mass flux.
Here we show that a similar process occurs in the quiet Sun for a wide range of temperatures that cover both the lower and upper TR (or low corona). In contrast to D2009, the current paper is focused on the quiet Sun. We study several aspects of this mass-loading process that were not addressed in D2009. In § 2 we discuss the quiet Sun observations and present a novel analysis technique for UV emission lines observed by SUMER (Wilhelm et al. 1995) on SOHO (Fleck et al. 1995). We perform a detailed study of the strengths and limitations of the line asymmetry analysis. We investigate the effects of blends on the analysis, and compare data observed in both first and second order to show that our conclusions are not impacted by blends. We describe the temporal behavior of the blueward asymmetries and compare them to those of type II spicules. Most importantly, we put forth a new interpretation of the nature of the emission from the quiet Sun transition region in terms of the mass cycling associated with the heating and cooling of the plasma associated with the type-II spicules. We discuss this new interpration in § 3.
2. Observations & Analysis
In the following we will present line asymmetry analysis of SUMER raster scans for spectral lines of the following ions: Si IV 1402 Å, C IV 1548 Å, N V 1238 Å, O VI 1031Å, and Ne VIII 770 Å, which are formed over a wide range of temperatures (under equilibrium conditions), respectively for (Mazzotta et al. 1998). In addition, we show a sit-and-stare temporal sequence in N V 1238 Å and analyze the episodic nature of the blue asymmetries.
2.1. Simultaneous C IV 1548 Å and Ne VIII 770 Å observations
The main data set used in the analysis presented is an absolutely calibrated SUMER spectroheliogram in the 1530-1555Å spectral range on September 22 1996 from 00:40-08:28UT for which further details can be found in Hassler et al. (1999) and Davey et al. (2006). This portion of the solar UV spectrum contains emission lines of singly ionized Silicon (Si II) with a rest wavelength of 1533.43Å, seven times ionized Neon (Ne VIII) at 1540.84Å (in second spectral order) and two lines of three times ionized Carbon (C IV) at 1548.20Å and 1550.77Å. The two C IV lines show identical spectral behavior and so we only consider information from the former as it has better signal-to-noise. For reasons of brevity, low signal-to-noise, and the impact of line blends close to line center, we also exclude the Si II line from the analysis. This leaves us with two emission lines that span the TR, C IV and Ne VIII formed around and 6xK respectively.
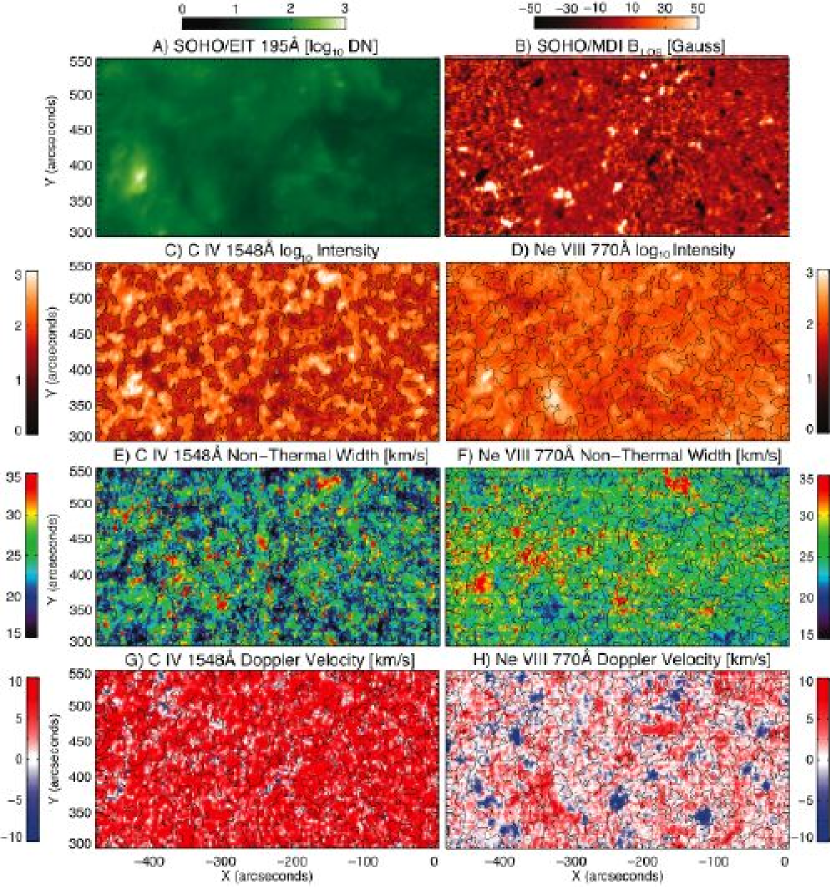
For context, Figure 1 provides an EIT (Delaboudinière et al. 1995) 195Å image (taken at 01:05UT) and a composite MDI (Scherrer et al. 1995) line-of-sight (LOS) magnetogram111The magnetogram is a composite of the four 96-minute cadence full-disk magnetograms taken over the duration of the SUMER spectroheliogram (01:39; 03:15; 04:48; 06:27UT). The composite is needed to partially take into account the considerable evolution of the photospheric magnetic field during the 7 hours of SUMER observations. as well as the line intensities, non-thermal line widths (; determined from the recipe in McIntosh, De Pontieu & Tarbell 2008) and absolutely calibrated Doppler velocities of the C IV 1548Å and Ne VIII 770.4Å lines in the left and right columns respectively. The visibility of the supergranular network differs markedly between C IV (all network contours in Fig. 1 are based on C IV intensity) and Ne VIII (panel D) in which the network pattern is not obvious. We also see a correspondence between increased values of and the LOS field strength222We note that there are many locations of enhanced that straddle regions where the magnetic field is expected to be significantly inclined, a topic covered by McIntosh, Leamon & De Pontieu (2009), or the locations of “explosive events”, see, e.g., Innes et al. (1997) and § 2.1.. In the bottom row of Fig. 1 the striking prevalence of red-shifted material is evident in the C IV emission (see, e.g., Gebbie et al. 1981, and many others) which is enhanced in the supergranular network vertices. In contrast, the Ne VIII emission in those same locations show modest blue-shifts or outflows (see Fig. 2), that are typical for quiet Sun (McIntosh et al. 2007).
We employ the technique discussed in D2009 to quantify the asymmetry of the SUMER line profiles. We first perform a single Gaussian fit (with a constant background) to the line profile (McIntosh, De Pontieu & Tarbell 2008) to determine its centroid position. Then we interpolate the line profile to a wavelength scale that is ten times finer and calculate the total number of counts in the interpolated profile in two narrow range of wavelengths/velocities (two original SUMER spectral pixels wide, or 24 km/s at 1548 Å) that are symmetrically positioned from the line centroid position, one in the blue and one in the red wing. The difference of the counts in the two wing positions, red-blue (R-B), provides a measure of the asymmetry of the profile at the chosen wavelength or velocity offset. Of course, a measure of zero indicates that the profile is symmetric in that velocity range. The R-B measure is related to the third (skewness) and fourth (kurtosis) moments of the the line profile. For relatively noisy line profiles, such as those studied, the difference of the two wings is a measure of asymmetry, provided that no spectral blends are present in the lines.
We note that the Ne VIII 770.4Å line, seen in second spectral order by SUMER, has two blends of Si I. As determined from the HRTS spectral atlas (Brekke 1993) these blends have equal magnitude, are 20 times weaker, and are symmetrically distributed at 20km/s either side of the Ne VIII rest position in the quiet sun. Based on the symmetry of the blend positions, their equal intensity and considerably lower amplitude (than Ne VIII 770.4Å) we deduce that their net effect on the Ne VIII line R-B diagnostic in the quiet sun is negligible333In general, the presence of a strong blend close to the line core can impact the R-B asymmetry analysis because of its effect on line centroiding. For example, a strong blend in the red wing, close to the core of the line, will shift the line centroid slightly to the red, which can lead to a generalized weak blue asymmetry. Since the Si I blends are symmetrical, this is unlikely to be the dominant cause of the blueward asymmetries we find in Ne VIII 770 Å as observed in second order.. In a coronal hole the relationship between the three spectral lines is more complex and is discussed at length in a forthcoming Paper (McIntosh, Leamon & De Pontieu 2009).
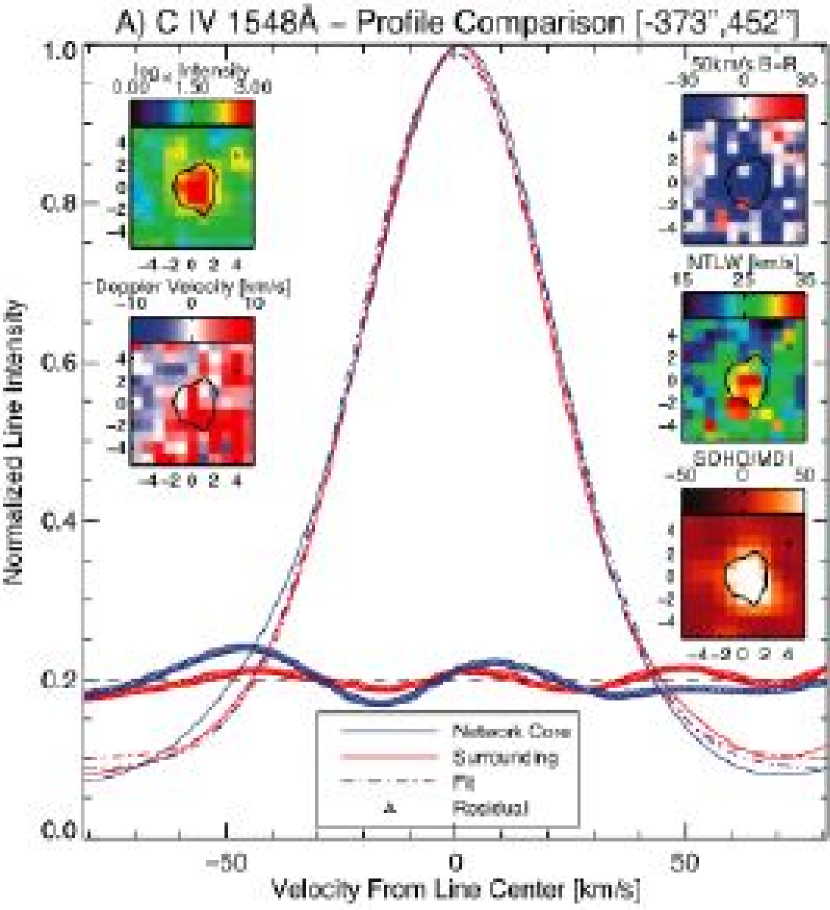
Figure 2 illustrates normalized line profiles for a magnetic network element (red solid line) and the surrounding quiet region (blue solid line) centered on coordinates (-373″, 452″). We see that for both of the emission lines in the network element there is an excess of emission in the blue wing (similar to what is shown in D2009). The peak of the excess emission is at 50km/s for C IV and 55km/s for Ne VIII. The surrounding plasma shows little, if any, excess emission. This is clear from the plot of residual emission (triangular symbols that are raised by 0.2 from the lower portion of the plot) between the mean region profile and a single Gaussian profile fit (appropriately colored dot-dashed line). In the network, the amplitude of the asymmetry is of the order of 3-8% of the peak brightness of the C IV line and 3-5% of the Ne VIII. Note that the excess emission in the blue wing occurs in a region in which the dominant core of the C IV spectral line predominantly shows modest redshifts of order a few km/s.
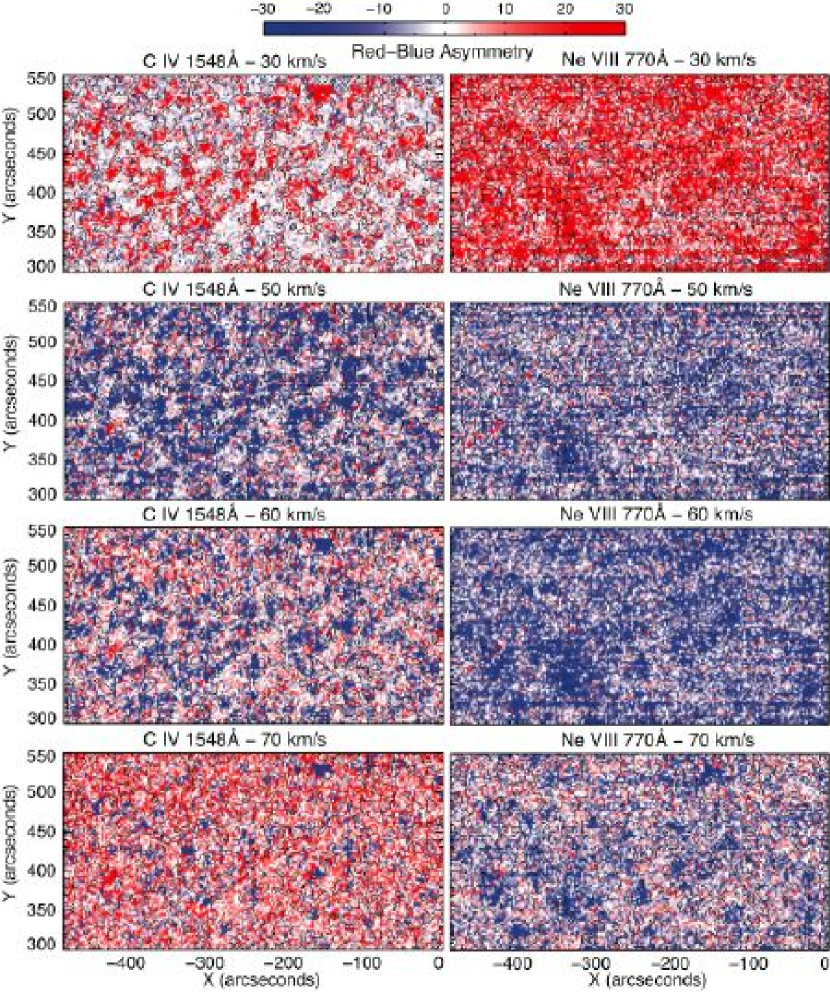
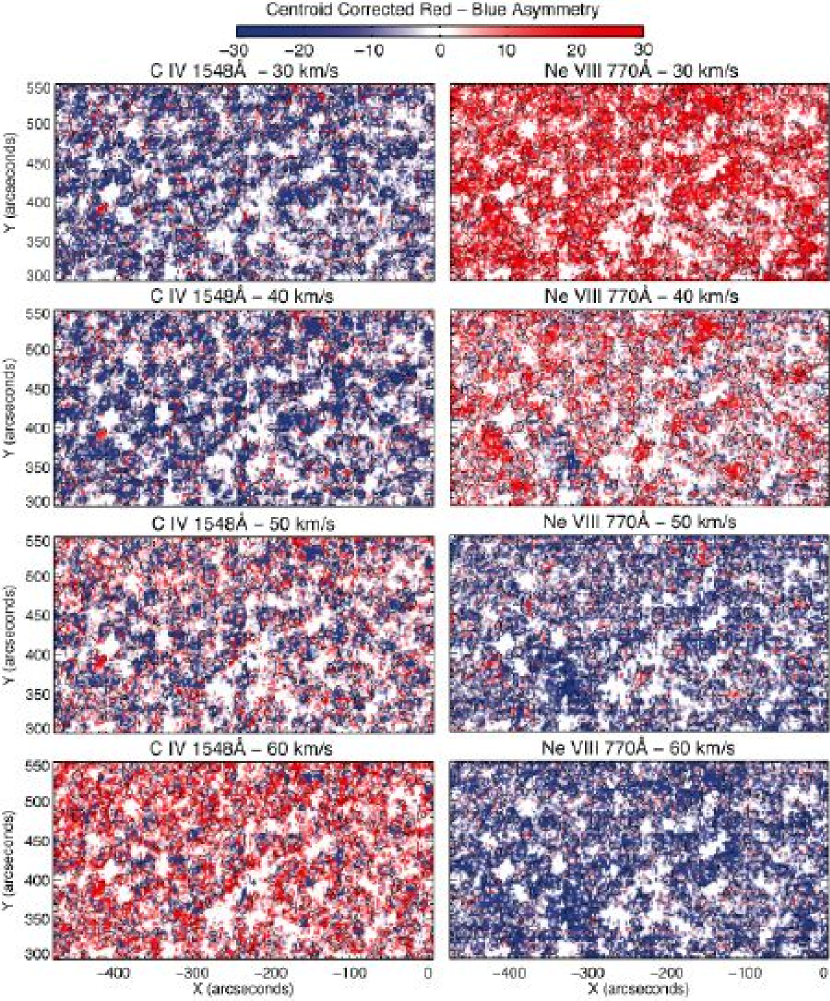
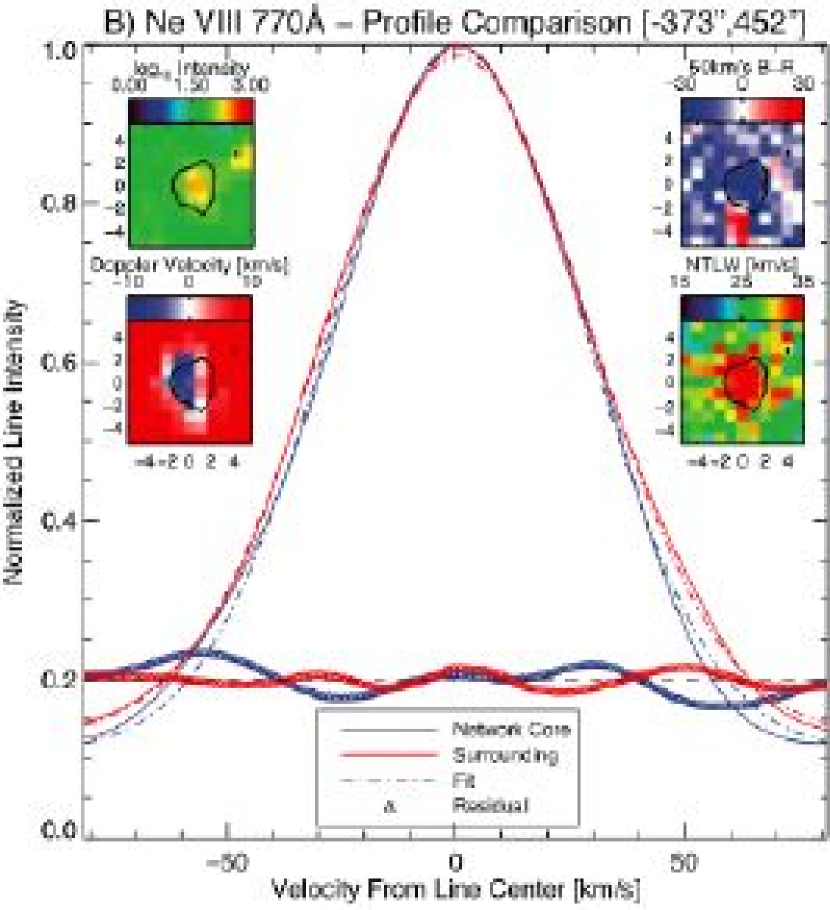
Calculating the R-B asymmetry measure for the two emission lines over a range of reference velocities from the line centroid, we produce the series of images shown in Fig. 3 (and accompanying movies). In both lines at low velocities (below sound speed expected for the relevant formation temperatures) we see that the R-B asymmetry is dominated by the red wing. This is particularly the case in the supergranular boundaries with the asymmetry becoming increasingly large over the strongest supergranular vertex flux concentrations. At higher reference velocities we see that the R-B asymmetry in the supergranular network switches sign indicating that the blue side of the line profile is becoming dominant. The change in sign is abrupt for C IV, and occurs at about 10-20km/s higher velocities for Ne VIII: we see a striking similarity between the two panels when we compare the R-B asymmetry for C IV at 50km/s and Ne VIII at 70km/s.
We should note that the preponderance of red signal in the high velocity ( km/s) panels of the left (C IV) column of the figure is the result of the analysis sampling the Si I 1548.72Å line that is 0.5Å (i.e., 100 km/s) to the red of the C IV line center. This line is 4-5 times less bright than the C IV line (see, e.g., Curdt et al. 2001) and we see that strong blue asymmetries still persist in many network locations, ie. indicating that the blue wing of the C IV line is still stronger than the narrow Si I line at the same velocity in the red wing. This blend reduces the visibility of the C IV asymmetry to higher velocities and can explain some, if not all of the velocity offset between the C IV and Ne VIII asymmetries. We also note that a very weak Si I line occurs at about 100 km/s to the red of line center of Ne VIII 770 Å (in second order). This line has an intensity of order only 2% of the Ne VIII intensity (Brekke 1993). It likely plays a role in reducing the visibility of Ne VIII asymmetry at very high velocities (but since it is weaker than the blend in C IV it has much less effect).
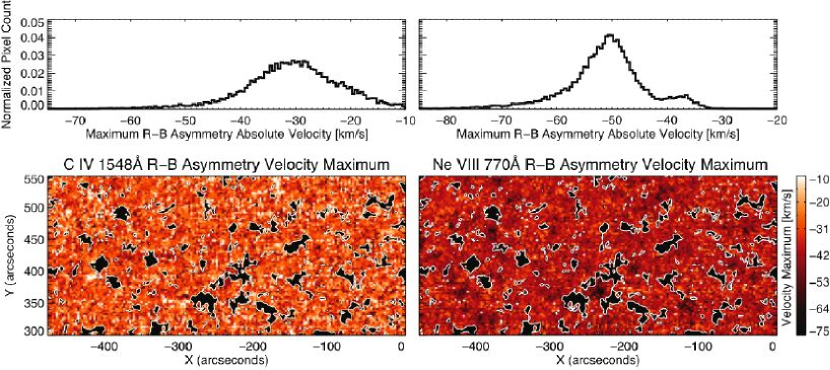
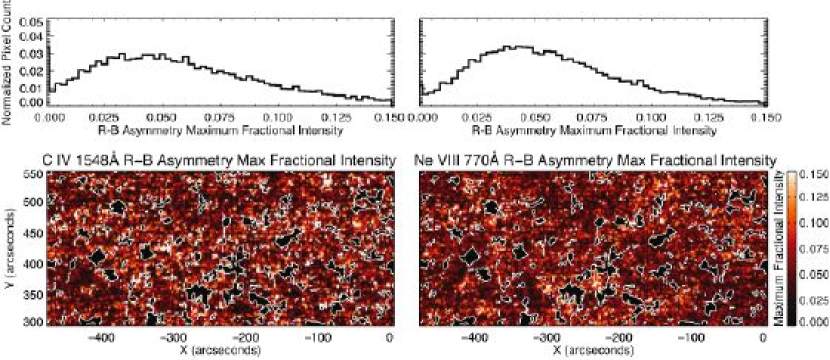
In order to place the derived R-B asymmetries in some relative context we estimate their maximum amplitude and location in absolute wavelength space. This step requires that we combine the information presented in Figs. 1 and 3, using the absolutely calibrated Doppler velocity from the line centroiding (panels 1G & 1H) to re-map the R-B asymmetry profiles. At each spatial pixel we adjust the velocity scale of the R-B profile to reflect the measured line centroid velocity; for example, a positive (red) line centroid Doppler shift will shift the entire R-B intensity profile to the red by the corresponding velocity and conversely for a blue Doppler shift of the line centroid. After shifting the R-B profiles we resample the panels of Fig. 3 to show the magnitude of the asymmetry in absolute velocity space, these are presented in the panels of Fig. 4. In performing this analysis we can also extract the maximum fractional (relative to the peak line intensity) magnitude of the line asymmetry and its location in absolute velocity space. The plots of these quantities, and their corresponding histograms, can be found in Fig. 5 and Fig. 6 respectively where we see that the maximum fractional intensity of the asymmetry in the C IV and Ne VIII lines are of the order of 3-4% (increasing into the cell interior as the intensity falls off significantly) with velocities that are offset by 20km/s.
2.2. Ne VIII 770Å first order observations
To further illustrate the ubiquitous presence of these blue-wing profile asymmetries in the quiet Sun magnetic network we present data that does not suffer significantly from blending with other lines. We also discuss the potential impact of low signal-to-noise on the detection of the subtle asymmetries we have found.
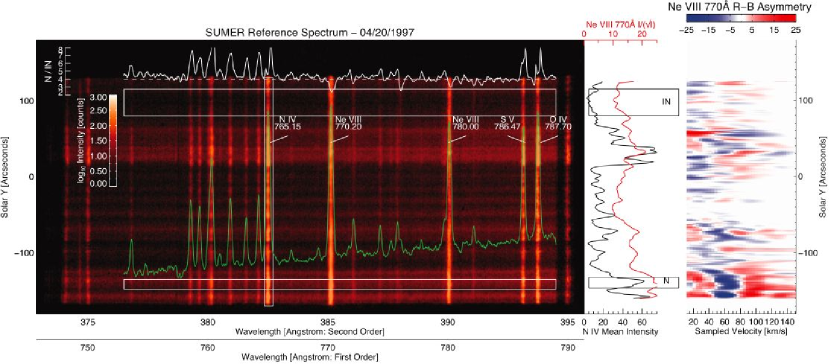
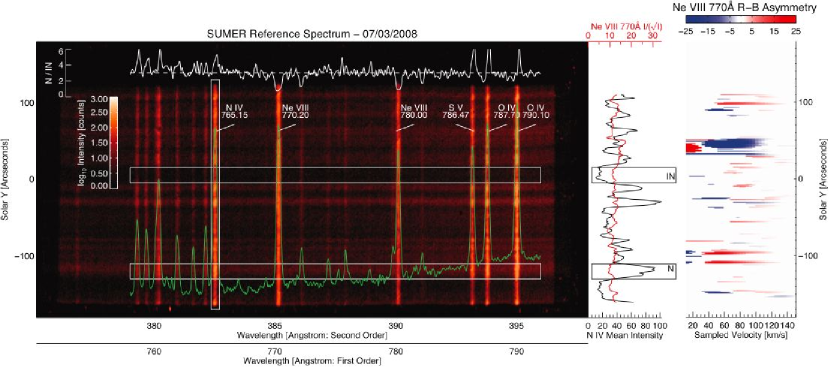
We consider quiet Sun spectral atlas observations of the Ne VIII 770Å line in first spectral order performed by SUMER close to the start of the mission (April 20 1997 00:34UT; Curdt et al. 2001, Fig. 7) and in a more recent observation (July 3 2008 12:11UT; Tian et al. 2009, Fig. 8). These data are taken with extremely long exposures (300s) of SUMER detector B and provide information about the Ne VIII 770Å line in first order. This line may be susceptible to Si I blends in the second spectral order, but is “clean” in the first order. We note that the nearest lines in the SUMER spectral atlas are the 769.38Å Mg VIII and 771.90Å N III lines which have 2 of the brightness of Ne VIII 770Å line in the quiet Sun, and are at 390 and 590 km/s to the blue and red respectively (Curdt et al. 2001).
Comparing Figs. 7 and 8 we are immediately drawn to the significant change in the strength, and “quality” of the SUMER spectra in the eleven years between the two observations presented. The ratio of network-internetwork intensity (N/IN) across the entire spectral range is reduced by a factor of two, the N/IN profile is very noisy and of low spectral contrast in the later observation, and the peak intensity of many of the emission lines (including Ne VIII 770Å) in this spectral range are decreased by up to a factor of four. Indeed, comparing the cross-slit variation of the Ne VIII 770Å spectral quality measure (; a good estimate of the signal-to-noise ratio - S/N, see, e.g. Chae, Schühle & Lemaire 1998), we see a mean value of 11.8, with very little variance (1.5) and very little contrast between the network and inter-network regions in the July 2008 spectra. Compare these values to the April 1997 case where the mean is 15, with a variance of 4 and regions of the slit with values in excess of 20. Because the strongly blue-shifted component we are interested in is very faint (% of the line core), it is clear that the spectral quality will significantly affect our ability to measure/quantify this component. Our analysis suggests that in the later phases of the SOHO mission SUMER spectra with a S/N of the order of 20 (needed to make a robust detection of these faint emission components in the blue wing) are rare even in long exposure observations. This can explain the lack of blueward asymmetries in the first order Ne VIII 770 Å spectral profiles (using SUMER) as analyzed recently by Tian et al. (2009).
This issue of data quality is illustrated by the results of an R-B analysis of the SUMER Ne VIII 770Å spectra in the reference spectra of Figs. 7 and 8. A complicating factor in this region of the UV spectrum is the linear behavior of the continuum background: even a small gradient can add additional weight to the red wing of the line unless it is taken into consideration when fitting the line center and when assessing the asymmetry of the profile. Therefore, we carefully fit a linear background and perform the R-B analysis on the background-subtracted spectra. The results are shown in the far right panels of Figs. 7 and 8. In the April 1997 reference spectrum we see a repetition of the signature observed in Figs. 3, 4, 5 and 6 (which were for the same spectral line, but in second spectral order): a red wing excess in the network regions at low velocities transitioning to a blue wing excess at higher velocities. The gradual return to red wing excess at very high velocities is likely the result of the linear background which, when not fully removed far from the line core, will lead to a preference for red asymmetries. The fact that we observe blue asymmetries for velocities between 50 and 90 km/s despite this background issue underscores the strength of the blue wing excess444We note that the coronal hole reference spectrum of Ne VIII 770 Å in first order (presented as the blue curve in Fig. 4, pg. 602, of Curdt et al. 2001) likely shows the blue-wing asymmetry as well. We suspect that the “knees” visible in the blue wings of the network/internetwork ratio in bright, spectrally isolated, TR emission lines in the spectral atlas data (the green curve in Curdt et al. 2001) may be the signature of the network blue profile asymmetry. Further analysis and modeling are required to ascertain the validity and uniqueness of this point.. In contrast, the R-B signature in the July 2008 spectra is highly dubious: there appears to be little correlation between the patches of signal and any physical structure along the slit. We deduce that this erratic signal is the result of the considerably higher noise level of the spectra taken later in the mission. This degradation of the spectra is a subject that merits further investigation. Reference spectra like those shown have been taken periodically throughout the SOHO mission, so such an analysis is possible, but beyond the scope of this Paper.
2.3. Raster scans of Si IV 1402Å, N V 1238Å and O VI 1032Å
The ubiquity and predominance in network regions of blueward asymmetries for velocities of order 40-100 km/s in the simultaneous C IV 1548 Å and Ne VIII 770 Å (in second order) raster scans and the reference spectra in Ne VIII 770 Å (in first order) are confirmed by several (non-simultaneous) SUMER raster scans (taken early during the SOHO mission) for three different lines that have high S/N, do not suffer from blends and are formed (under equilibrium conditions) at similar temperatures as C IV and Ne VIII. These lines are Si IV 1402.8 Å, N V 1238.8 Å and O VI 1031.9 Å, formed for respectively.
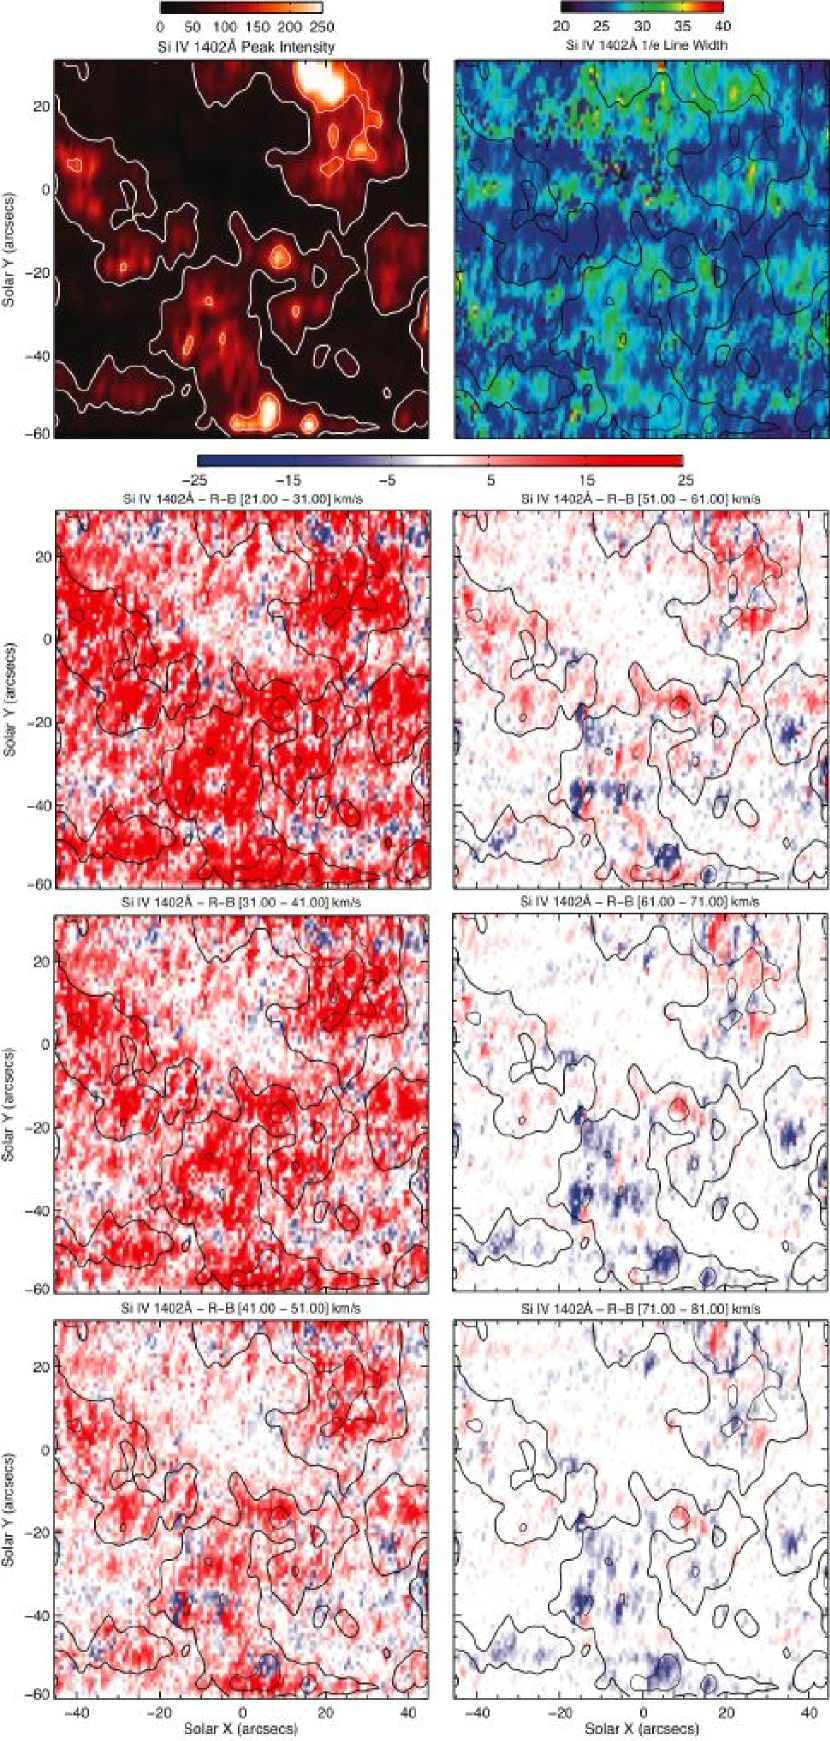
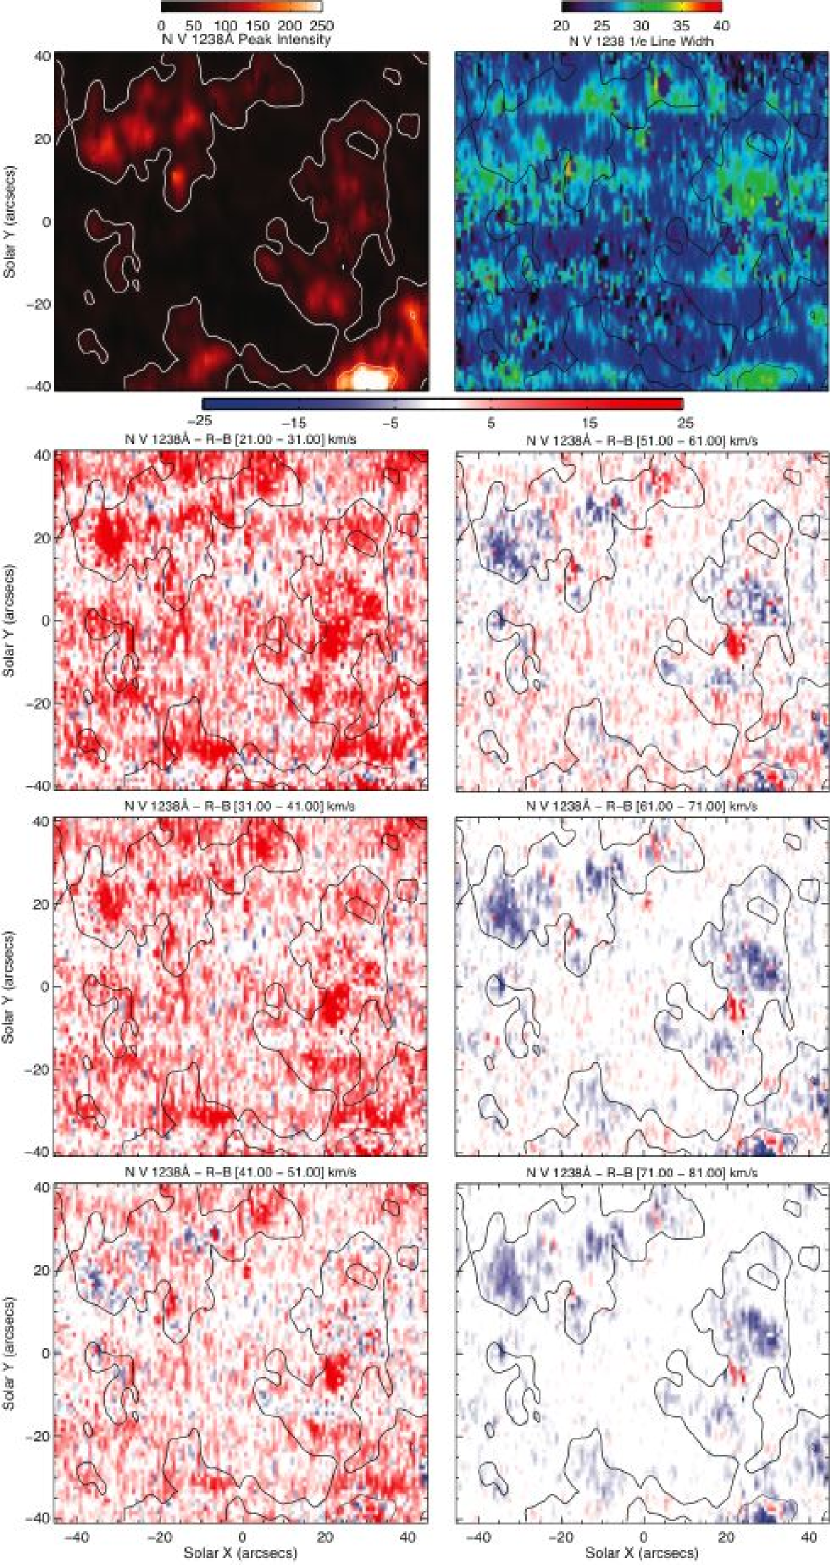
Figure 9 shows a raster scan with long exposures (60s) of the Si IV 1402Å line (formed at K) taken at quiet Sun at disk center on August 6, 1996. This line does not have any blends in the velocity range shown (according to the SUMER atlas Curdt et al. 2001). Similar to the C IV and Ne VIII spectra, the R-B analysis reveals that the network regions (shown with contours based on core intensity of the spectral line) are dominated by red asymmetries for low velocities, with a sudden shift to blue asymmetries from 50 km/s onward. We see significant blue asymmetries even at 80 km/s.
A very similar picture appears in a disk center raster scan (Fig. 10) taken about 12 hours later, but now in the N V 1238 Å line (formed at slightly higher temperatures under equilibrium conditions: 2xK, Mazzotta et al. 1998). In the network regions, we see a similar shift from redward asymmetries for velocities less than 50 km/s, to blueward asymmetries for velocities above 50 km/s, up to 80 km/s (the limit of the spectral range for this raster). This line has no known blends in this velocity range. Again, many locations in the network show significant blue asymmetries even at 80 km/s.
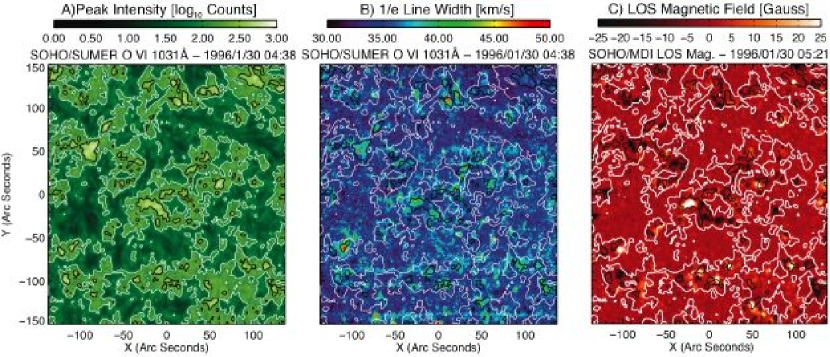
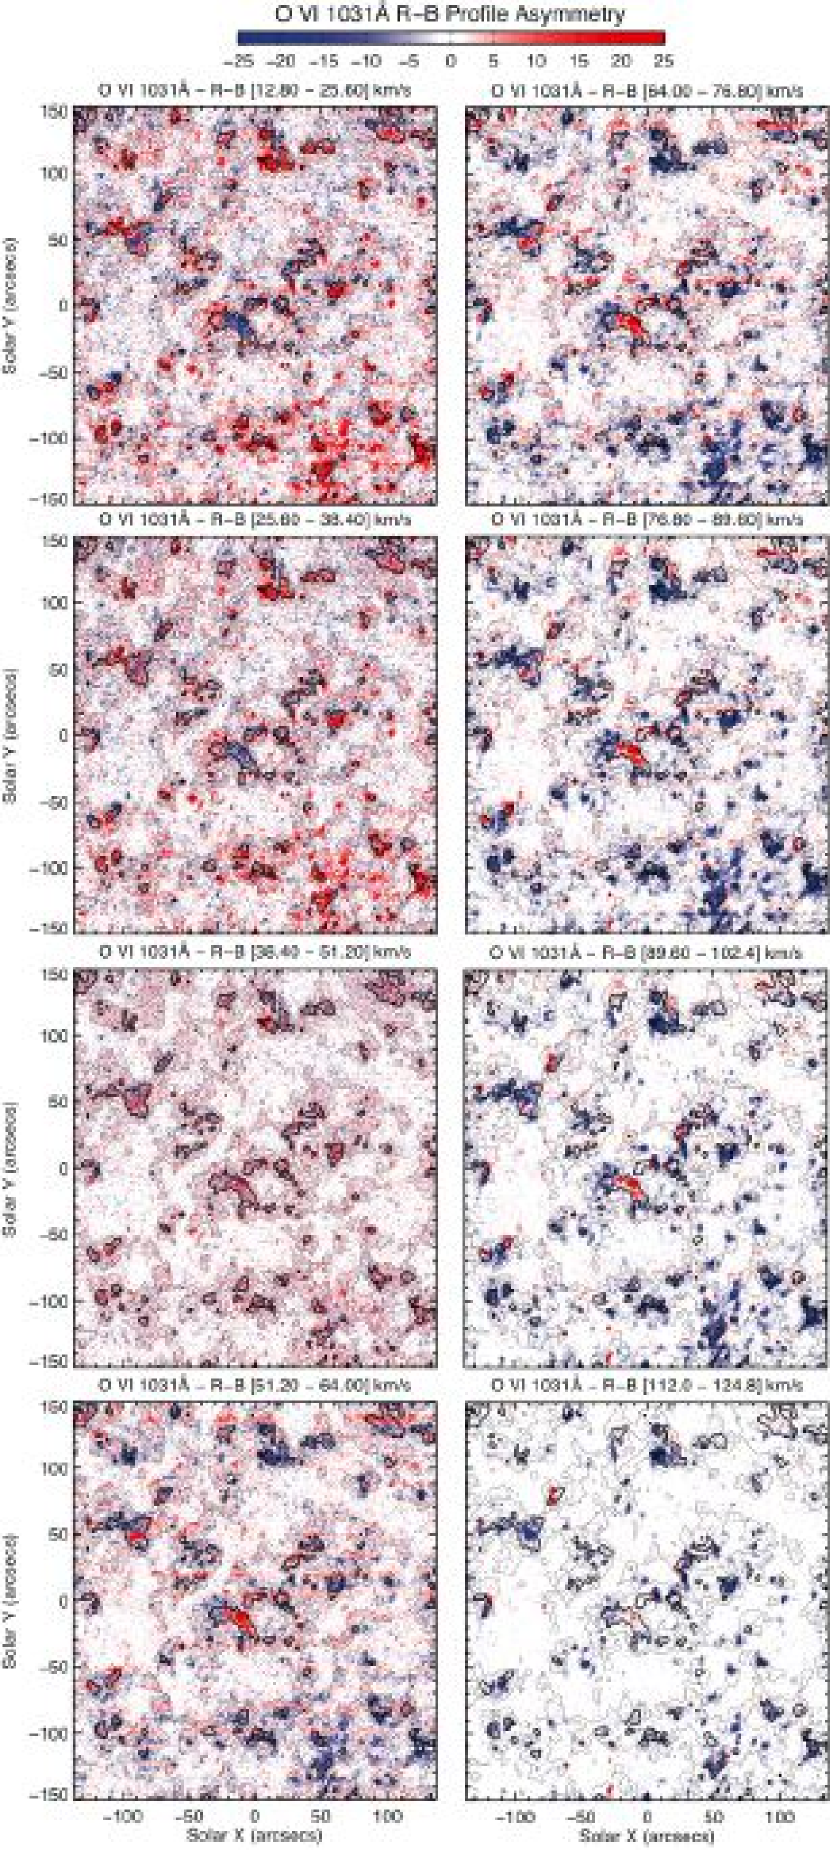
And finally, we consider an R-B analysis of the O VI 1031.92Å SUMER observation taken on January 30 1996 from 04:38-04:57UT. According to the SUMER spectral atlas (Curdt et al. 2001) the O VI 1031.92Å line (formed in equilibrium at 4xK, Mazzotta et al. 1998) has one very weak blend (0.5% of the O VI intensity) in the form of the 1031.39Å S II line. At this wavelength, any effect of the blend in the blue wing will appear at 154km/s from the line center, considerably beyond our analysis window and so we consider it to be negligible. Fig. 11 presents, from left to right, the peak line intensity, -width of the O VI line for comparison with a SOHO/MDI line-of-sight magnetogram taken at 05:21UT, in each case the thick and thin contours delineate the brightest network elements and the (approximate) supergranular network boundary, through 250 and 100 count peak intensity contours derived from panel A. Figure 12 shows the results of the R-B analysis of this line, using the steps discussed above. As before, we observe that the strong magnetic regions that compose the supergranular network exhibit a pronounced behavior. These regions favor a red-shifted excess of material at lower velocities that is replaced by a blue-shifted component appearing at about 50km/s with a 5-10% magnitude relative to the peak intensity that persists, gradually fading. Therefore, the O VI line has a qualitatively similar behavior to what we have observed above in Si IV, C IV, N V and Ne VIII. As an aside, we also notice a very high velocity blue component in certain locations (112-125km/s - panel H). Within the limitations of a slowly rastered image and a magnetogram taken 20 minutes later we assess that these locations lie typically (but not exclusively) at the edge of strong magnetic elements, are co-spatial with locations of significant profile broadening (km/s, see panel B of Fig. 11), and possibly correspond to “explosive events” in the periphery of the magnetic network (Innes et al. 1997).
In summary, the raster scans in these three, blend-free, high S/N spectral lines show the same blueward asymmetries for velocities of order 40-100 km/s in network regions as those we found in the C IV and Ne VIII spectra. These results strongly suggest that the effect of systemic blends on our results is unlikely to cause all observed asymmetries, and that strong upflows of 40-100 km/s seem to occur all over the quiet Sun in and around network regions, for lines formed (under equilibrium conditions) at temperatures from the low TR to the upper TR and low corona. These upflows are similar in amplitude and nature as those found by D2009 in plage regions, which are associated with chromospheric type-II spicules.
2.4. Time Series of N V 1238 Å
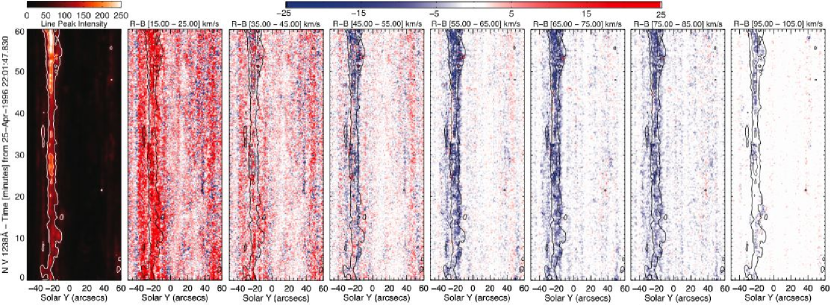
The raster scans shown in the previous sections clearly show a preference for the blueward asymmetries to occur in and around network regions. However, all of these scans take hours to complete so that temporal characteristics of the upflows cannot be determined. We use a sit-and-stare sequence of a quiet Sun region at disk center taken with SUMER on 25 April 1996 to illustrate the temporal behavior of the upflows. Fig. 13 shows a one hour long sequence of N V 1238 Å spectra that cover a quiet Sun region, including a network region at y=-30″to y=-20″. The intensity of the line is slowly changing in the bright network region over the course of the one hour long timeseries. The R-B analysis once again shows the redward asymmetry for velocities less than 50 km/s which shift rapidly to blueward asymmetries for velocities in excess of 50 km/s. Blueward asymmetries dominate from 50 to 100 km/s in the network region. In the internetwork regions very little asymmetry is found for these velocities. The right panels of Fig. 13 clearly show that the blueward asymmetries are highly variable in time, even while they continue to occur in and around the network region. This data shows that the upflows of 50-100 km/s are apparently episodic in nature.
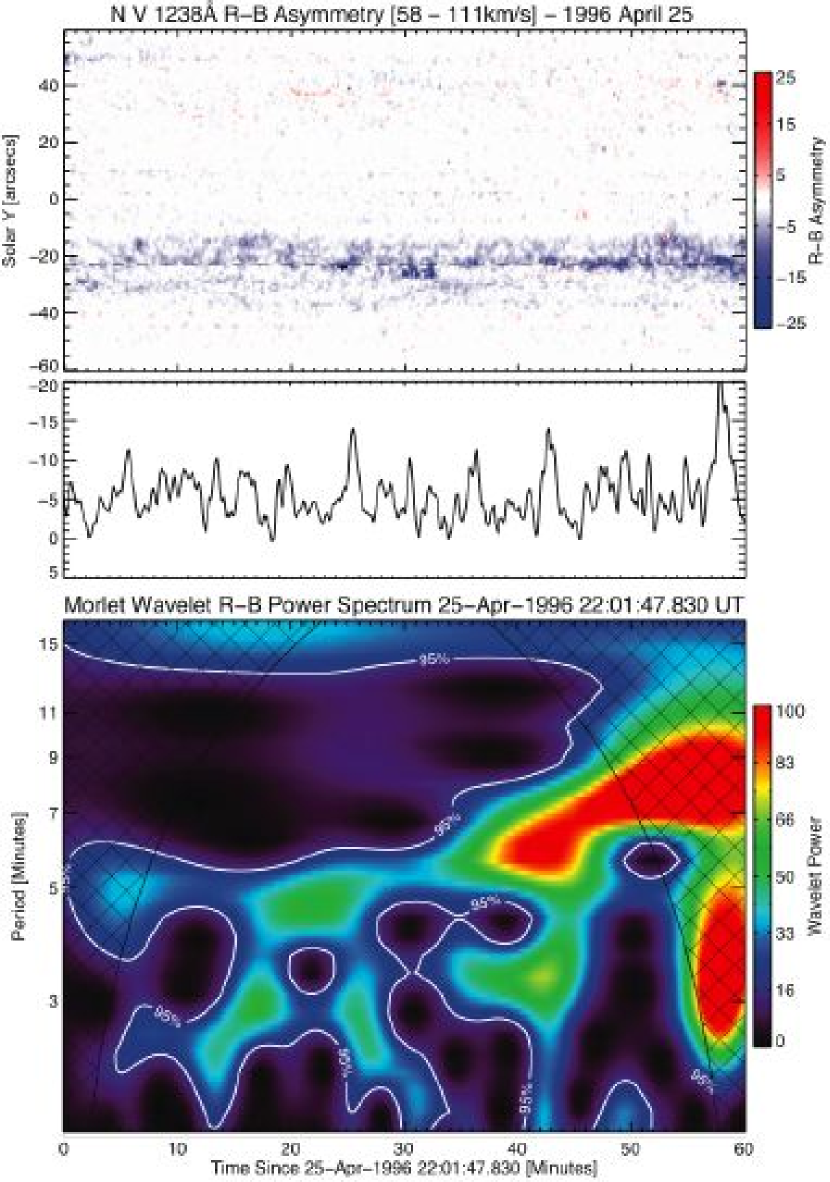
Further analysis of this time series shows that the characteristic timescale on which these upflow events seem to recur is of order 3-15 minutes. This is illustrated in Fig. 14 which shows, as a function of time and space, the episodic nature of the R-B asymmetry of N V 1238 Å (summed from 58 to 111 km/s) for the same timeseries. The middle panel shows the R-B timeseries at ″ with clear peaks of blueward asymmetry occurring, and typical events lasting of order 1-3 minutes. These events apparently recur on timescales of 3-15 minutes. This is confirmed by a wavelet analysis (using the Morlet wavelet) of the N V 1238Å R-B (58-111km/s) timeseries: the resulting wavelet power spectrum (bottom panel) shows significant (at 95% significance level) power throughout the timeseries at periods of order 3-5 minutes, as well as some at 15 min.
The lifetime of these upflow events agrees surprisingly well with those of type II spicules (of order 10-100 s De Pontieu et al. 2007b). This is further supporting evidence that these quiet Sun events are similar to those seen by D2009 in plage regions (which were directly associated with type II spicules). It is also very interesting that the upflow events in this particular network region occur quasi-periodically, or at least seem to occur on typical timescales of 3-15 minutes, timescales that are similar to granular (and other photospheric) timescales. The quasi-periodicity of the R-B asymmetries is further evidence that the periodicities observed in coronal imaging and spectral timeseries are not necessarily signs of propagating magneto-acoustic waves in the corona (e.g. de Moortel et al. 2002a; Wang et al. 2009), but may (sometimes) also be caused by quasi-periodic, high-speed, faint upflows associated with type II spicules that are heated to coronal temperatures. This topic is further discussed by McIntosh & De Pontieu (2009).
3. Discussion & Interpretation
We observe high speed upflows in emission lines that are formed, under equilibrium conditions, in the low, middle, and upper TR (or low corona). The upflows show a similar spatial pattern in all lines, preferentially occur around the network regions, and have velocities of order 40-100 km/s. The emission of the upflowing plasma is faint at 5% of the peak intensity of the line. It is possible that these upflows are visible as propagating disturbances in EUV (Schrijver et al. 1999) and soft X-Ray coronal images (Sakao et al. 2008): the velocity of the measured weak episodic jets are in the same range as the apparent velocities of the disturbances in imaging data. A connection to the chromospheric activity and/or spectroscopic measurements is studied by (McIntosh & De Pontieu 2009) for active regions.
What causes these upflows? Many authors have discussed blueward excursions of TR lines in the past (e.g. Dere, Bartoe & Brueckner 1989), with most of those observations being linked to explosive events: violent, often bi-directional jets caused by reconnection (Chae, Schühle & Lemaire 1998). What we report on here is not an occasional disturbance, like an explosive event, but a much more ubiquitous and fainter phenomenon: at any single moment, most of the network regions show these high speed upflows. We believe that these upflows are related to the blueward asymmetry and line broadening that has been reported before for TR lines in the quiet Sun network (e.g. Peter 2000). The latter suggested, without the benefit of the R-B measure, that hot coronal funnels cause this faint component, with the dominant core of the line emitted in small-scale, low-lying coronal loops. Our interpretation is very different. The quiet Sun upflows are very similar in location, velocity (50-120 km/s), intensity (5% of line core) and temporal behavior to the faint, coronal upflows observed with Hinode/EIS above active region plage (Hara et al. 2008, D2009). The latter have been directly linked to the heating to coronal temperatures of chromospheric type II spicules, which dominate the upper chromosphere in plage and quiet Sun network and develop velocities of order 50-150 km/s. D2009 estimated that the mass flux injected to the corona by these jets is significant for the mass balance of active region coronal loops. We suggest that the upflows we observe here in Si IV, C IV, N V, O VI, and Ne VIII are the quiet Sun equivalent of this process.
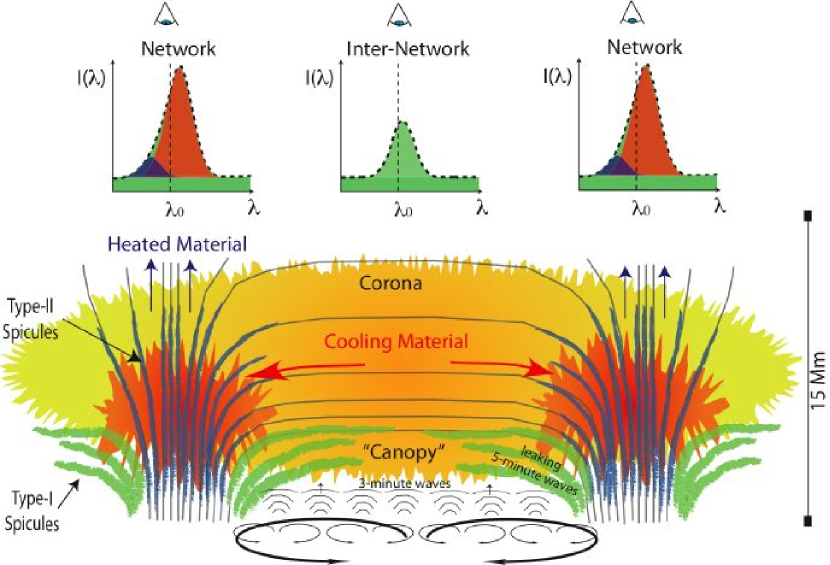
In Fig. 15 we provide a cartoon of the TR structure consistent with our observations and the analysis of D2009. What we observe as the transition region is a conveyor belt of sorts, one that includes frequent bursts of rapidly upflowing ionized hot plasma (in the form of thin, dynamic type II spicules), and recycles the material that is slowly cooling out of the corona, losing energy through radiation and producing the well known prevalent TR red-shift, as well as a host of other TR phenomenology discussed above (e.g., Gebbie et al. 1981; de Wijn & De Pontieu 2006; Judge 2008). This figure is very different from Fig. 8 of Peter (2000). We interpret the supergranular magnetic network as a truly dynamic environment of very high speed ionized plasma upflow (in the form of type II spicules) with a mix of instantaneous and gradual mass return from the corona instead of a component due to “hot coronal funnels” rooted in supergranular boundaries. While low-lying, cooler loops (e.g., Dowdy, Rabin & Moore 1986) may well play some role555Judge & Centeno (2008) recently questioned this view of transition region structure. in the TR emission (Peter 2000) our analysis has demonstrated that the role of spicules is fundamental in understanding the observed TR signature. It is possible that the small network core blueshifts observed in Ne VIII may be the result of a more gentle evaporative mass loading due to coronal energy deposition (e.g., Klimchuk 2006; Tomczyk & McIntosh 2009) in the upper TR. Regardless of the interpretation, our results suggest that approximating the observed spectral line profiles with (even multiple) Gaussians is profoundly limiting, and that other ways to consistently model the observed asymmetric plasma velocity distributions are essential (e.g., Scudder 1992a).
Our conceptual view of the TR is related to the model put forth by Pneuman & Kopp (1978) who suggested that a small fraction of spicules are heated to coronal temperatures and provide the corona with hot plasma. To constrain the spicular mass flux into the quiet Sun corona we follow the approach of D2009, appealing to the conservation of mass and observed emission measures in the system and noting that the latter are similar to those observed in active regions - upflow components with of the core intensity. D2009 found that the density of the coronal component of the spicules could be expressed as where the coronal density, and is the fraction of total coronal spicular density at a temperature of . If we assume that only a fraction of the spicular coronal mass flux is observed in Ne VIII, then the only difference with the analysis of D2009 is that the coronal density in quiet Sun is less than that of active regions (say, 3x10⁸ instead of cm-3). As a result the coronal densities of hot spicular matter are of order cm-3. This implies that the heated spicules can fill the quiet Sun corona even if only 0.3-1.5% of the chromospheric spicule mass reaches coronal temperatures. D2009 also estimate that the number of spicules per arcsec2 occurring within the network over the lifetime of a spicule is , where km the diameter of a typical spicule. Since the assumptions about the coronal scale height, expansion from network to corona, velocity and diameter of spicules are of the same order for active region and quiet Sun, we estimate a density of spicules of order 1-4 per arcsec2 within a network region. Is this number compatible with Hinode/SOT observations of type II spicules at the limb? Rouppe van der Voort et al. (2009) report that they see at least between 1 and 3 of these spicules per linear arcsec at the limb (at a height of 5,000 km). Rouppe van der Voort et al. (2009) indicate that when observing at 5,000 km height above the limb, line-of-sight superposition implies that one can see features emanating from network regions over a line-of-sight that is of order 200 arcseconds long. Such a line-of-sight in principle could cross network at the edge of of supergranules. However, the network around supergranular cells has a relatively low filling factor of order 0.25, as shown in, e.g., Fig. 12 of Rouppe van der Voort et al. (2009). This means that our estimate of 1-4 spicules per arcsec2 within a network region fits in well with the observed number of spicules (1-3 per linear arcsec) that is observed with Hinode at the limb (since the number of supergranule cells multiplier is cancelled by the low network filling factor). We conclude that the observed number of spicules at the limb is fully compatible with a scenario in which the heated component of type II spicules observed in TR emission can play a significant role in the mass balance of the quiet corona.
The impact of these spicules on the coronal energy balance can be estimated by calculating the flux associated with the internal energy of the mass flux calculated in the above. We find that the energy flux is given by , with the number of spicules that occur at any location over the spicule lifetime, the mass density of the spicule component that is heated to coronal temperatures, the specific heat at constant volume, the upflow velocities in the spicules, and the temperature the coronal spicular component reaches. D2009 estimated that . If we assume that all the plasma in these spicules is heated to 1 MK (of order the formation temperature of Ne VIII, this implies ), and use cm, km s-1, we find an energy flux of order erg cm-2 s-1. This is of the same order of magnitude as the estimated conductive and radiative losses ( erg cm-2 s-1 for quiet Sun, Priest 1982).
Several issues are unresolved in the scenario presented here. The first is the role that spicules play in the mass balance of the lower TR. Observations from Hinode/SOT indicate that many are heated above 20,000K (De Pontieu et al. 2007b), but the peak temperature that the bulk of the spicular mass reaches is unclear. Pneuman & Kopp (1978) suggest that the fraction of spicular mass reaching a certain TR temperature is a steeply declining function of , consistent with the rapid decrease of differential emission measure from 10,000 to 100,000K. Simultaneous observations with high spectral, temporal and spatial resolution of the chromosphere and TR at high signal-to-noise (20) are necessary to resolve this issue. With the recent selection of the Interface Region Imaging Spectrometer (IRIS) such data should be forthcoming.
A second issue relates to the formation and heating mechanism of type II spicules themselves. Insight into the magnetic geometry required for the energy release and how the plasma itself is heated and accelerated along the structure of the spicule may help explain why we see a velocity difference in the upward velocity components between the formation conditions of Si IV, C IV, N V, O VI and Ne VIII as well as those between the quiet and active atmosphere (with upflows stronger in the latter – up to 150 km/s). Certainly, the temporal behavior points to a driver that leads to episodic upflows on characteristic timescales of granulation, something also seen by Rouppe van der Voort et al. (2009) who report on the discovery of the disk-counterpart of type II spicules.
Finally, based on the observational evidence and interpretation presented in this paper, efforts to better understand type II spicules may lead to a clearer picture of the impact of non-equilibrium ionization on the upper portion of the solar atmosphere.
References
- Athay & Holzer (1982) Athay, R. G. & Holzer, T. E., 1982, ApJ, 255, 743
- Beckers (1968) Beckers, J. M., 1968, Sol. Phys., 3, 367
- Brekke (1993) Brekke, P., 1993, ApJS, 87, 443
- Chae, Schühle & Lemaire (1998) Chae, J., Schühle, U., & Lemaire, P., 1998, ApJ, 505, 957
- Curdt et al. (2001) Curdt, W., et al., 2001, A&A, 375, 591
- Davey et al. (2006) Davey, A. R., McIntosh, S. W., & Hassler, D. M. 2006, ApJS, 165, 386
- Delaboudinière et al. (1995) Delaboudinière, J.-P., et al. 1995, Sol. Phys., 162, 291
- De Pontieu et al. (2004) De Pontieu, B., Erdelyi, R., James, S.P., 2004, Nature, 430, 536
- De Pontieu et al. (2007a) De Pontieu, B., et al., 2007a, ApJ, 655, 624
- De Pontieu et al. (2007b) De Pontieu, B., et al., 2007b, Pub. Ast. Soc. Jap., 59, 655
- De Pontieu et al. (2009) De Pontieu, B., McIntosh, S. W., et al. 2009, ApJ, 701, L1
- de Moortel et al. (2002a) de Moortel, I., et al., 2002a, Solar Phys., 209, 61
- de Wijn & De Pontieu (2006) de Wijn, A. G., & De Pontieu, B., 2006, A&A, 460, 309
- Dere, Bartoe & Brueckner (1989) Dere K.P., Bartoe J.-D.F., Brueckner G.E., 1989, Sol. Phys. 123, 41
- Dowdy, Rabin & Moore (1986) Dowdy J. F., Rabin D., Moore R. L., 1986, Sol. Phys. 105, 35
- Fleck et al. (1995) Fleck, B., Domingo, V., Poland, A. I. 1995, The SOHO mission, Kluwer
- Gebbie et al. (1981) Gebbie, K. B. et al., 1981, ApJ251, L115
- Hansteen et al. (2006) Hansteen, V. H., et al. 2006, ApJ, 647, L73
- Hara et al. (2008) Hara, H., et al. 2008, ApJ, 678, L67
- Hassler et al. (1999) Hassler, D.M., et al. 1999, Science, 283, 810
- Innes et al. (1997) Innes, D. E., Inhester, B., Axford, W. I., Wilhelm, K., Nature, 386, 811
- Judge (2008) Judge, P. G., 2008, ApJ, 683, L87
- Judge & Centeno (2008) Judge, P. G., & Centeno, R. C., 2008, ApJ, 687, 1388
- Klimchuk (2006) Klimchuk, J., A., 2006, Sol. Phys., 234, 41
- Kosugi et al. (2007) Kosugi, T., et al., 2007, Sol. Phys., 243, 3
- Martínez-Sykora et al. (2009) Martínez-Sykora, J., Hansteen, V., De Pontieu, B., & Carlsson, M. 2009, ApJ, 701, 1569
- Mazzotta et al. (1998) Mazzotta, P., et al., 1998, A&AS, 133, 403
- McIntosh et al. (2007) McIntosh, S. W., et al. 2007, ApJ, 654, 650
- McIntosh, De Pontieu & Tarbell (2008) McIntosh, S. W., De Pontieu, B. & Tarbell, T.D., 2008, ApJ, 673, L219
- McIntosh, Leamon & De Pontieu (2009) McIntosh, S. W., Leamon, R. J., & De Pontieu, B., 2009, submitted ApJ[Available on request!]
- McIntosh & De Pontieu (2009) McIntosh, S. W. & De Pontieu, B., 2009, in press ApJLetters [http://arxiv.org/abs/0910.2452]
- Peter (2000) Peter, H., 2000, ApJ, 360, 761
- Priest (1982) Priest, E. R., 1982, Solar Magnetohydrodynamics, Dordrecht
- Pneuman & Kopp (1978) Pneuman, G. W. & Kopp, R. A., 1978, Sol. Phys., 57, 49
- Roberts (1945) Roberts, W. O., 1945, ApJ, 101, 136
- Rouppe van der Voort et al. (2009) Rouppe van der Voort, L., et al., 2009, in press ApJ[http://arxiv.org/abs/0909.2115]
- Sakao et al. (2008) Sakao, T., et al., 2008, Science, 318, 1585
- Secchi (1877) Secchi, P. S. 1877, Le Soleil, Paris, Gaultier-Villars
- Scherrer et al. (1995) Scherrer, P. H., et al. 1995, Sol. Phys., 162, 129
- Scudder (1992a) Scudder, J. D., 1992, ApJ, 398, 299
- Schrijver et al. (1999) Schrijver, C. J., et al., 1999, Sol. Phys., 187, 261
- Schrijver & Zwaan (2000) Schrijver, C. J. & Zwann, C., 2000, “Solar and Stellar Magnetic Activity”, Cambridge
- Tian et al. (2009) Tian, H., Marsch, E., Curdt, W., He, J., 2009, in press ApJ [http://adsabs.harvard.edu/abs/2009arXiv0909.0739T]
- Thomas (1948) Thomas, R. N., 1948, ApJ, 108, 130
- Tomczyk & McIntosh (2009) Tomczyk, S., & McIntosh, S. W., 2009, 697, 1384
- Tsuneta et al. (2008) Tsuneta, S., et al., 2008, Sol. Phys., 249, 167
- Wang et al. (2009) Wang, T. J., Ofman, L., Davila, J. M., Mariska, J., 2009, A&A, 503, L25
- Wilhelm et al. (1995) Wilhelm, K., et al. 1995, Sol. Phys., 162, 189
- Withbroe (1983) Withbroe, G. L., 1983, ApJ, 267, 825