Calibrating AGN Feedback in Clusters
Abstract
Whether caused by AGN jets, shocks, or mergers, the most definitive evidence for heating in cluster cores comes from X-ray spectroscopy. Unfortunately such spectra are essentially limited to studying the emission spectrum from the cluster as a whole. However since the same underlying emission measure distribution produces both the observed CCD and RGS spectra, X–ray imaging can still provide spatial information on the heating process. Using Chandra archival data for a sample of 9 clusters, we demonstrate how imaging data can be used to constrain departures from a canonical, isobaric cooling flow model as a function of position in a given cluster. The results of this analysis are also shown for the deep archival exposure of the Perseus cluster. Such “heating maps” can provide constraints on both the location and magnitude of the heating in the cores of clusters. When combined with detections and spectral index maps from low-frequency radio observations, these maps can be used to distinguish between different models for heating in these objects.
Keywords:
cooling flows — X-ray: galaxies: clusters:
98.65.Cw, 98.65.Hb1 Introduction
Since the launch of Chandra and XMM-Newton, it has become evident that the X-ray emitting gas in the cores of galaxy clusters is being heated and redistributed by powerful radio sources. Images of cluster cores over the past few years show a wealth of structure, much of which is produced by interactions between rapidly expanding radio lobes and the hot intracluster (ICM) medium surrounding them. In particular, large cavities or bubbles are now found routinely in the centers of clusters (McNamara and Nulsen, 2007). Based on studies of cavity energetics, the global energy budget in these systems seems more than sufficient to balance cooling in some objects (Bîrzan et al., 2004; Rafferty et al., 2006). The specifics of the feedback loop between AGN heating and cooling in cluster cores however is still not understood. In particular, the details of where this energy deposition occurs and by what physical mechanism energy is transferred to the ICM remain open questions.
In the canonical cooling flow model where gas is assumed to fully cool from ambient values down to very low temperatures, strong X–ray emission lines, such as Fe XVII at 15.02 Å, would be expected. XMM-Newton RGS spectra of cluster cores however show a lack of strong X-ray emission lines from gas at temperatures below a few keV (Peterson et al., 2003). Due to instrumental limitations, XMM-Newton RGS spectra are essentially limited to studying the emission spectrum from the cluster as a whole. Fortunately, X–ray imaging can sample the cluster temperature structure in cluster cores directly, albeit at reduced spectral resolution, since the same underlying emission measure distribution or distribution produces both the observed CCD and RGS spectra. Using simple, parameterized functions for the distribution, we show here that one can map the departures from the standard isobaric cooling flow model as a function of position in a given cluster. These “heating maps” can provide constraints on both the location and magnitude of the heating in the cores of clusters.
2 Emission measure diagnostics
The lack of strong emission lines from gas at temperatures below , where is the ambient cluster temperature, in XMM-Newton RGS spectra has become a key argument for new cooling flow models which include such additional physics as AGN heating, thermal conduction, and star formation. In the standard cooling flow model, which assumes no heating, the differential luminosity distribution, i.e. the luminosity radiated per unit temperature interval, is proportional to the mass deposition rate, :
| (1) |
Consequently in this scenario, one should observe equal amounts of emission per unit temperature interval, including X–ray lines, from gas down to very low temperatures. Based on a sample of 13 clusters, Peterson et al. (2003) find a deficit of emission below about of the ambient temperature relative to the predicted emission from equation 1. The observed distribution appears to be more consistent with an expression of the form,
| (2) |
where – instead of 0, as expected for the standard cooling flow model. In this prescription, is directly proportional to the amount of heating in the cluster. We have implemented the simple, parameterized distribution model of equation 2 as a source model within both the XSPEC and ISIS spectral fitting packages (Arnaud, 1996; Houck and Denicola, 2000). This technique is similar to that of Kaastra et al. (2004), although they employ a different formalism for the distribution.
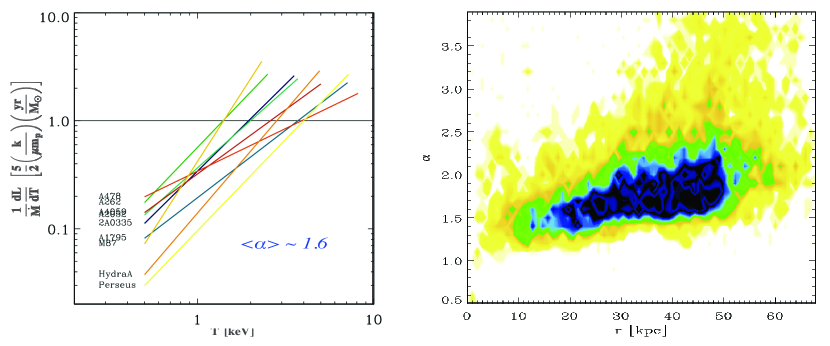
With this model, we have used archival Chandra imaging data to measure the underlying distribution for a small sample of clusters111This initial sample includes Perseus, M87, Hydra A, A478, A262, 2A0335+091, A2052, and A4052.. Several of these initial objects are common to the original sample of Peterson et al. (2003). Data were extracted and fit within the entire cooling radius for these objects so these results can be compared with the integrated RGS spectra directly. The resulting distributions are shown plotted in the left panel of Figure 1. The mean value of for the sample is . These integrated results are completely consistent with the RGS results reported by Peterson et al. (2003). We plan to expand this analysis to a larger sample of Chandra and XMM-Newton imaging data.
3 Mapping Heating in Cluster Cores
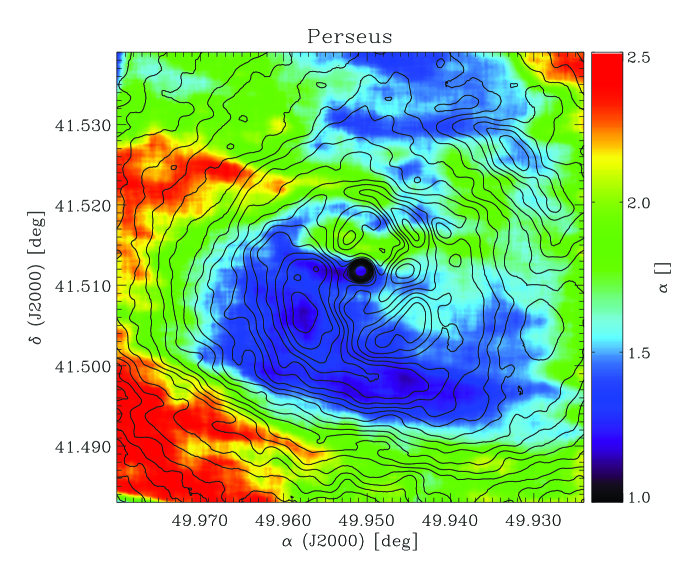
Although fits to the integrated spectra make a nice consistency check, our ultimate goal is to actually map the departures from a canonical, unheated cooling flow model (equivalent to determining the parameter) as a function of position in a given cluster. Figure 2 shows one such map constructed using the deep, 1 Msec Chandra observation of the Perseus cluster. It is immediately obvious that over the entire cooling region. More strikingly, rises rapidly immediately outside the edges of the radio filled cavities. This observed spatial correlation is strong circumstantial evidence that energy associated with the radio cavities is being deposited into the ICM at these locations. Due to the episodic nature of AGN activity, the ambient, non-zero value of may represent the time-averaged result of several outbursts, while the observed rise in at the cavity boundaries may be due to ongoing heating associated with the most recent outburst.
Again, although disconnected from the physics of the heating mechanism, such “heating maps” can provide constraints on both the location and magnitude of the heating in the cores of clusters. As Figure 2 demonstrates, this technique provides a potentially powerful diagnostic for determining the underlying distribution in clusters and by extension the degree and location of heating in the ICM. Using this technique, we intend to construct such heating maps for all clusters in the Chandra and XMM-Newton archives with sufficient quality data. Ultimately, these maps can provide constraints on AGN feedback-based heating models as well as the energy transfer mechanism itself. The complex radio bubble and X–ray cavity morphologies observed in cluster cores make it clear that spatial information is key to understanding AGN heating in the ICM.
References
- McNamara and Nulsen (2007) B. R. McNamara, and P. E. J. Nulsen, ARA&A 45, 117–175 (2007), 0709.2152.
- Bîrzan et al. (2004) L. Bîrzan, D. A. Rafferty, B. R. McNamara, M. W. Wise, and P. E. J. Nulsen, ApJ 607, 800–809 (2004), arXiv:astro-ph/0402348.
- Rafferty et al. (2006) D. A. Rafferty, B. R. McNamara, P. E. J. Nulsen, and M. W. Wise, ApJ 652, 216–231 (2006), arXiv:astro-ph/0605323.
- Peterson et al. (2003) J. R. Peterson, S. M. Kahn, F. B. S. Paerels, J. S. Kaastra, T. Tamura, J. A. M. Bleeker, C. Ferrigno, and J. G. Jernigan, ApJ 590, 207–224 (2003).
- Wise (2009) M. W. Wise, in preparation (2009).
- Wise and Houck (2009) M. W. Wise, and J. C. Houck, in preparation (2009).
- Arnaud (1996) K. A. Arnaud, “XSPEC: The First Ten Years,” in Astronomical Data Analysis Software and Systems V, edited by J. H. Jacoby, and J. Barnes, 101, San Francisco, 1996, p. 17.
- Houck and Denicola (2000) J. C. Houck, and L. A. Denicola, “ISIS: An Interactive Spectral Interpretation System for High Resolution X-Ray Spectroscopy,” in ASP Conf. Ser. 216: Astronomical Data Analysis Software and Systems IX, 2000, pp. 591–+.
- Kaastra et al. (2004) J. S. Kaastra, T. Tamura, J. R. Peterson, J. A. M. Bleeker, C. Ferrigno, S. M. Kahn, F. B. S. Paerels, R. Piffaretti, G. Branduardi-Raymont, and H. Böhringer, A&A 413, 415–439 (2004).