Present address: ]Dipartimento di Fisica G. Galilei and CNISM, Università di Padova, v. Marzolo 8, Padova, Italy
Equilibrium properties and force-driven unfolding pathways of RNA molecules
Abstract
The mechanical unfolding of a simple RNA hairpin and of a 236–bases portion of the Tetrahymena thermophila ribozyme is studied by means of an Ising–like model. Phase diagrams and free energy landscapes are computed exactly and suggest a simple two–state behaviour for the hairpin and the presence of intermediate states for the ribozyme. Nonequilibrium simulations give the possible unfolding pathways for the ribozyme, and the dominant pathway corresponds to the experimentally observed one.
pacs:
87.15.A-; 87.15.Cc; 87.15.LaThe study of the RNA three-dimensional structure has received a boost by the recent discovery that some RNA molecules act as enzymes in several key cellular processes in complete absence of protein cofactors Doudna and Cech (2002).
As for proteins, the shape of RNA molecules is strictly connected to their function, and thus the study of the response to external forces helps to understand how biomolecules transform mechanical inputs into chemical signals. Recent experiments and simulations have shown how it is possible to extract information on the RNA structure by using force spectroscopy, where RNA molecules are manipulated by using controlled forces.
In particular, remarkable experimental works Liphardt et al (2001); Onoa et al (2003) have investigated the connections between the molecular structure of RNA hairpins and Tetrahymena thermophila ribozyme, and the respective unfolding pathways under mechanical stress.
Motivated by such experiments, several groups have proposed theoretical and numerical approaches to the mechanical unfolding of RNA molecules Var (a); Hyeon and Thirumalai (2005); Hyeon et al. (2006); Hyeon and Thirumalai (2007); Hyeon et al. (2008). In particular, by using a coarse–grained Gō–model and Molecular Dynamics (MD) simulations, Thirumalai and coworkers have computed phase diagrams and free energy landscapes of RNA hairpins Hyeon and Thirumalai (2005); Hyeon et al. (2008), and the unfolding pathways of larger, more complex RNA molecules Hyeon et al. (2006); Hyeon and Thirumalai (2007).
However, MD simulations are computationally demanding, and even in the simple case of the determination of the phase diagram, simulations have to be restarted for every choice of the model parameters. Here we introduce a simple discrete model for RNA molecules under external force, whose thermodynamics is exactly solvable, and as such is able to provide exact thermodynamical results for any size of the molecules, in a computation time which is incomparably smaller than the time needed for simulations. We exploit this model to obtain the force–temperature phase diagram of a small and a large RNA molecule and their free energy landscape as a function of the molecular elongation.
Furthermore, by using Monte Carlo simulations (MC), we investigate the unfolding pathways of the larger molecule, finding that the most probable path from the native to the unfolded state agrees with the experimentally determined one. It is worth noting that the present model has been used to evaluate the phase diagram, the free energy landscape Alb , and the unfolding pathways Imparato and Pelizzola (2008) of widely studied proteins, showing a good degree of agreement with the corresponding experimental results.
The model – We use a Gō model defined by the energy
| (1) |
where is the end–to–end length of the molecule and is associated to the covalent bond between bases and . (respectively 0) means that this bond is (resp. is not) in a native–like state. Given the state of the variables, for an RNA molecule with bases, orientational degrees of freedom are introduced. Such degrees of freedom, , describe the orientation of the native–like stretches, relative to the external force . Indeed, if a native–like stretch extends from base to base , then . Such a stretch can be as short as a single base . We set as boundary conditions . The orientation of a native–like stretch is also a binary variable: (respectively ) represents a stretch oriented parallel (resp. antiparallel) to the external force . is the length of the native stretch, taken from the Protein Data Base (PDB) and defined as the distance between the phosphorus atoms of bases and . is the element of the contact matrix, which takes the value 1 if the bases and are in contact, and 0 otherwise. Within the present model, bases and are considered to be in contact if at least two atoms, one from each base, are closer than Å. Finally is the corresponding interaction strength, which is proportional to the number of atom pairs, which are in contact according to the above criterion. We have shown Alb that, as far as the equilibrium thermodynamics is concerned, the sum over the variables can be performed exactly, and in the case a well–known Ising–like model of protein folding is obtained Var (b). Stacking interactions are implicitly taken into account in the present model: one can easily check that, for instance, the formation of a contact between bases and (if present in the native structure) is a necessary condition for the formation of an native contact.
Simple hairpin (P5GA) – We first consider a 22–nucleotides RNA hairpin, (PDB code 1EOR, see ref.app for the secondary structure), which is similar to the P5ab in the P5abc domain of group I intron Liphardt et al (2001). We first focus on the equilibrium properties of the molecule, and then study the unfolding kinetics induced by external forces.
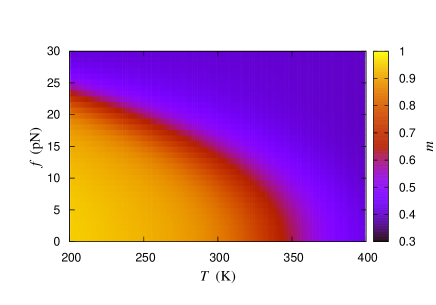
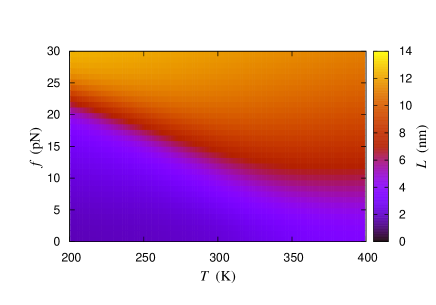
In fig. 1, the phase diagrams are plotted. They show that P5GA behaves like a two-state system, the transition region from the folded to the unfolded state being quite narrow. It is also in good agreement with that by Hyeon and Thirumalai Hyeon and Thirumalai (2005) for the same molecule.
An interesting quantity that characterizes the stability of a biopolymer, is the free energy landscape (FEL) as a function of its end-to-end elongation , defined as
| (2) |
where is the microscopic state of the system, and the sum is restricted to those states, whose value of the macroscopic variable is equal to the argument of . Here corresponds to the hamiltonian (1) with . As discussed in Alb , can be exactly computed in the present model. The landscape is plotted in fig. 2, for K. When an external constant force is applied to the molecule free ends, one gets the tilted landscape , which is plotted in fig. 2, for pN. From the phase diagram in fig. 1 one sees that for this value of the force, the molecule length is about half of its maximum value nm. At the same time, the FEL exhibits two wells at small and large elongation, indicating that the molecule hops from the folded to the unfolded state, for this value of the force Hyeon and Thirumalai (2005).

The FEL of the same molecule was obtained in Hyeon and Thirumalai (2005, 2007); Hyeon et al. (2008) by using an off-lattice coarse grained model and MD simulations. In these papers, was estimated by analyzing the kinetics of the molecule under force, i.e., by sampling the occupation frequency of those states with a given elongation . This method is expected to give reliable results only for small molecules, like the one at issue, where the phase space of the molecule is sampled according to its equilibrium phase space distribution. In the case of larger molecules, at small forces, one expects that the states with large are not sampled with the correct frequency, as computer simulations usually fail to visit rare states. On the contrary, the phase diagrams and landscapes, as given by the present model, are exact results, and can be obtained for any molecule size and any value of and .
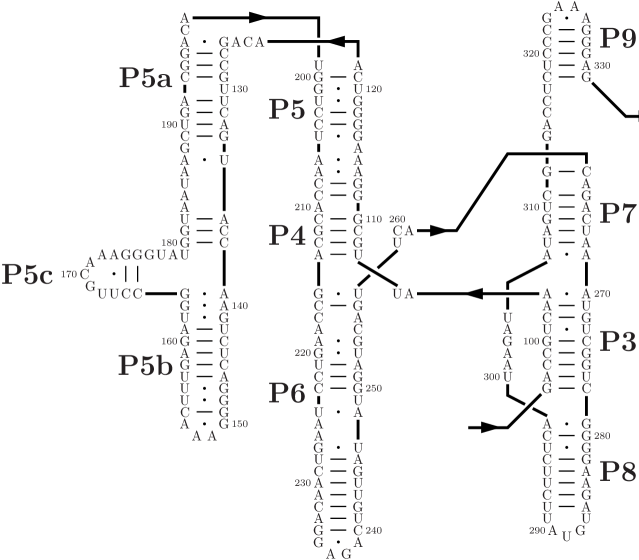
Tetrahymena thermophila ribozyme (1GRZ) – In the following we investigate the thermodynamical equilibrium properties and the mechanical unfolding of the Tetrahymena thermophila ribozyme Golden et al. (1998), PDB code 1GRZ, whose mechanical unfolding has been studied both experimentally Onoa et al (2003) and with computational techniques Hyeon et al. (2006). We consider the structured part from base 96 to 331, which exhibits several secondary structure elements (SSE), named Pn with n=, see ref. app .
In fig. 3 we plot the phase diagram of the 1GRZ molecule. At variance with the case of the hairpin, this larger molecule exhibits a wider transition region, reflecting the presence of intermediate states along the unfolding pathway, as will be discussed in detail below.
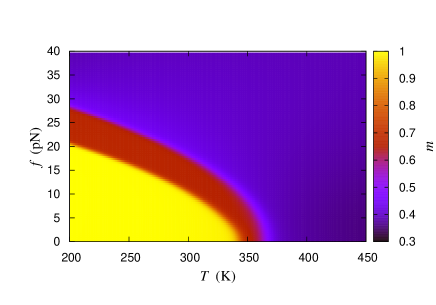
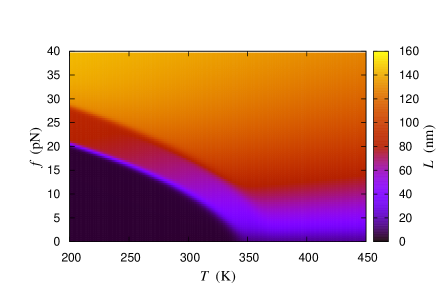
In fig. 4, we plot the unperturbed FEL as a function of the end–to–end length at K. In the same figure, we plot the tilted FEL for two values of the external force pN. From the phase diagram in fig. 3 one sees that for and K, the average end–to–end length is half of its maximum value nm. The FEL at pN exhibits two major and one minor energy wells, indicating the coexistence of three states characterized by three different values of for this force.

In order to study the mechanical unfolding of the ribozyme, we consider here the experimental protocol where the external force is applied by tethering the molecule to a colloidal particle trapped in an optical trap: , where is the end-to end length of the molecule at time , while and are the stiffness and the center of the trap, respectively. This experimental setup corresponds to that used in ref. Onoa et al (2003), which we will use as a reference to compare our results.
In ref. Imparato and Pelizzola (2008), the present model was used to trace the state of SSEs of a protein. Similarly, one can monitor the unfolding of a single SSE of 1GRZ by considering a suitable order parameter for each SSE. Here we choose the fraction of native contacts within an element. The order parameter of the SSE Pn will be defined as , where the prime means that and run over those bases belonging to Pn, and is the total number of native contacts in Pn. This approach allows us to trace the current state of each SSE. The unfolding time of a given SSE is defined as the time at which the corresponding order parameter crosses a given threshold for the first time Imparato and Pelizzola (2008).
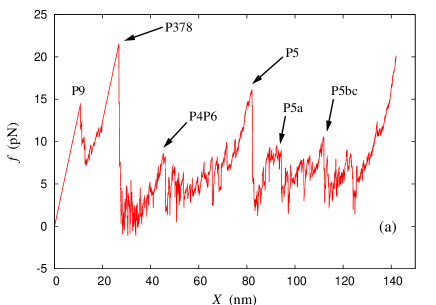
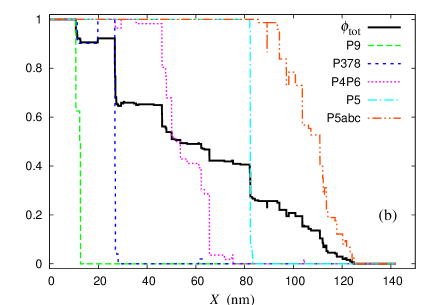
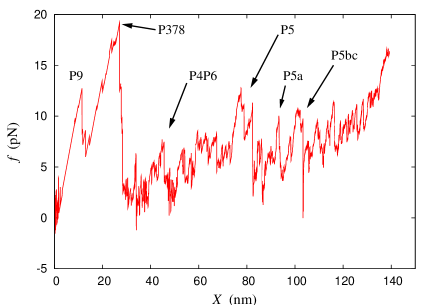
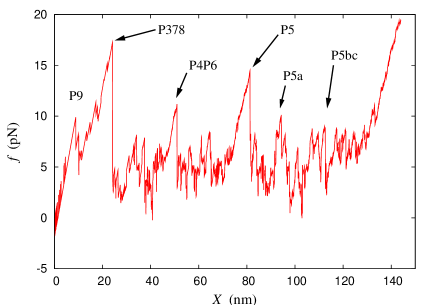
In order to find the typical unfolding pathways, we consider 1000 trajectories, simulated with a standard Monte Carlo algorithm Alb , where the trap stiffness and the velocity take the values pN/nm, and nm/(MC Step). Time is a discrete variable counting the number of MC steps. A typical trajectory is plotted in fig. 5. In the force–extension curve unfolding peaks can be observed. By comparing the position of the peaks with the drops in the SSEs order parameters in fig. 5(b), we can associate peaks in fig. 5(a) to the unfolding of SSEs. The equilibrium behaviour of these order parameters is reported and discussed in app . The unfolding pathways corresponding to the 1000 trajectories can be easily clustered into two big sets. The first set (622 trajectories) corresponds to the pathway P9 P34678 P5 P5a P5bc. This means that P9 is the first SSE to unfold, followed by the SSEs P3, P4, P6, P7 and P8 with no definite order among them, and so on. This is consistent with the experimental pathway Onoa et al (2003) P9 P378 P46 P5 P5abc, except for lumping together P378 and P46 and for splitting P5abc. This set of trajectories can be analyzed in more detail, looking for finer subdivisions, and one finds that 429 out of these 622 trajectories correspond to the pathway P9 P78 P3 P46 P5 P5a P5bc. Even at this finer level our results are consistent with the experimental ones Onoa et al (2003), and we can also predict a definite order of unfolding events within the domains P378 and P5abc. Moreover, we find an alternative, less probable (355 trajectories out of 1000) pathway, P9 P3 P46 P5 P5a P5bc P78, where P78 are the last domains to unfold. The order of the unfolding events does not appear to be affected by moderate variations of the threshold used to obtain the model interaction parameters app . It is worth to note that such parameters take implicitly into account the effect of counterions on the stability of the native structure, see same reference.
To summarize, the present model turns out to be able to provide the equilibrium properties of an RNA hairpin with minimal computational efforts in comparison with more detailed molecular models. This feature allows us to extend our investigation to the equilibrium properties of a large molecule, namely the Tetrahymena thermophila ribozyme. The model is also able to reproduce the experimental behaviour of the ribozyme under mechanical loading, providing additional information on the unfolding events at a microscopic level not accessible to experiments, similarly to what obtained for the analysis of protein unfolding Imparato and Pelizzola (2008). These results clearly indicate that such a model captures the basic universal features underlying the mechanical unfolding of biopolymers.
References
- Doudna and Cech (2002) J. A. Doudna and T. R. Cech, Nature 418, 222 (2002).
- Liphardt et al (2001) J. Liphardt et al, Science 292, 733 (2001).
- Onoa et al (2003) B. Onoa et al, Science 299, 1892 (2003).
- Var (a) M. Müller, F. Krzakala, M. Mézard, Eur. Phys. J. E 9, 67 (2002); S. Cocco, J.F. Marko, R. Monasson, Eur. Phys. J. E 100, 153 (2003); U. Gerland, R. Bundschuh, T. Hwa, Biophys. J. 84, 2831 (2003); A. Imparato, L. Peliti, Eur. Phys. J. B 39, 357 (2004).
- Hyeon and Thirumalai (2005) C. Hyeon and D. Thirumalai, Proc. Natl. Acad. Sci. U.S.A. 102, 6789 (2005).
- Hyeon et al. (2006) C. Hyeon, R. I. Dima, and D. Thirumalai, Structure 14, 1633 (2006).
- Hyeon and Thirumalai (2007) C. Hyeon and D. Thirumalai, Biophysical Journal 92, 731 (2007).
- Hyeon et al. (2008) C. Hyeon, G. Morrison, and D. Thirumalai, Proc. Natl. Acad. Sci. U.S.A. 105, 9604 (2008).
- (9) A. Imparato, A. Pelizzola and M. Zamparo, Phys. Rev. Lett. 98, 148102 (2007); A. Imparato, A. Pelizzola and M. Zamparo, J. Chem. Phys. 127, 145105 (2007).
- Imparato and Pelizzola (2008) A. Imparato and A. Pelizzola, Phys. Rev. Lett. 100, 158104 (2008).
- Var (b) H. Wako and N. Saitô, J. Phys. Soc. Jpn 44, 1931 (1978); H. Wako and N. Saitô, ibid. 44, 1939 (1978); V. Muñoz et al., Nature 390, 196 (1997); V. Muñoz et al. Proc. Natl. Acad. Sci. USA 95, 5872 (1998); V. Muñoz and W.A. Eaton, ibid. 96, 11311 (1999); P. Bruscolini and A. Pelizzola, Phys. Rev. Lett. 88, 258101 (2002).
- (12) In this appendix we (1) report the secondary structures of the RNA fragments that we have studied, (2) study the equilibrium order parameters as functions of the molecular elongation, for comparison with our nonequilibrium simulations, (3) report nonequilibrium unfolding simulations of molecule 1EOR, and (4) study the effect of the cutoff distance used to define contacts on the 1GRZ unfolding nonequilibrium simulations.
- Golden et al. (1998) B. L. Golden, A. R. Gooding, E. R. Podell, and T. R. Cech, Science 282, 259 (1998).
Appendix to “Equilibrium properties and force-driven unfolding pathways of RNA molecules”
I Molecular structures
In this section we report the secondary structures of the RNA fragments we have studied with our model.
In fig. A.6 we report the secondary structure of the simple hairpin P5GA (pdb code 1EOR).
In addition, in fig. A.7 we report the secondary structure of the main structured portion of the Tetrahymena thermophila ribozyme (pdb code 1GRZ). This is the portion we have considered in our work and goes from base 96 to 331, according to the pdb numbering. In the figure, the numbers which are adjacent to bases correspond to the pdb numbering, and the labeling of hairpins follows Golden et al. (1998), where the secondary structure of the whole molecule can be found. It is worth to note, that in that work the authors obtained crystals of the ribozyme by freezing solutions containing 50 mM of Mg. This concentration is compatible with the experimental conditions of, e.g., Liphardt et al (2001); Onoa et al (2003). Thus, the native structure, as given in the protein data base PDB, is affected by the presence of ions , which stabilize the long range, tertiary contacts. As discussed in the text, in generating our model interaction energies , we take into account those atom pairs whose distance is smaller than a threshold distance. Thus the effect of the Mg+ ions is implicitly taken into account in our model. It is commonly believed [2,3] that tertiary contacts are bottlenecks for the molecular unfolding, which manifest as peaks in the force-extension curve, like those in fig.5a of the main text.

II Comparison of the out–of–equilibrium unfolding pathways with the equilibrium configurations
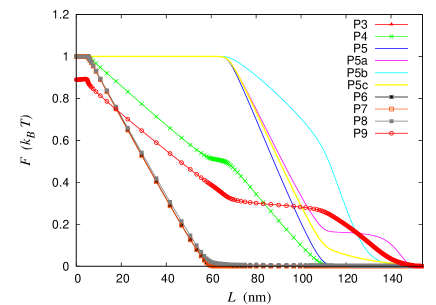
In fig. A.8 the order parameter as a function of the molecular elongation , at K. Inspection of this curve suggests that at such a temperature, P9 is partially unfolded, and as the molecular elongation increases, the unfolding of P3, P4,P6, P7, and P8 start at nm, the unfolding of P4 and P9 being slower than the others. At nm, the P3, P6, P7 and P8 are completely unfolded, while the curves for P4 and P9 exhibits a shoulder. At the same value of the elongation, the SSEs P5, P5a, P5b, and P5c start to unfold too, and for 115 nm only a small fraction of P9 and of P5abc is not yet unfolded. Such a figure has to be compared with fig. 4 and fig. 5 in the main text. The picture emerging is consistent with the typical unfolding pathways found during the simulations: P9 P34678 P5 P5a P5bc. It is worth to note, however, that in out-of-equilibrium pulling manipulations the unfolding is a stochastic process, and thus the sequence of the unfolding events may vary from one realization of the process to another. For example in fig 5.b in the main text one clearly distinguish the unfolding events of P378 and P4P6, while in the equilibrium picture, fig. A.8, the unfolding of those elements occurs at almost the same length. Similarly, the characteristic lengths emerging from analysis of fig. A.8, i.e. nm correspond to minima in the energy landscape plotted in the inset of fig. 4 in the main text, suggesting that those minima correspond to the typical configurations of the molecule immediately before the unfolding of a specific group of SSEs.
III Supplementary simulations
1EOR
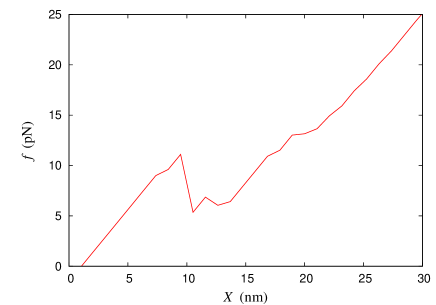
Here, we describe unfolding simulations of the 1EOR molecule. We consider first the constant force setup (force clamp): a constant force pN is applied to the molecule, and its length is traced as a function of time. A typical trajectory is plotted in fig. A.9. Inspection of this figure clearly indicates that the molecule hops back and forth between two states characterized by nm and nm, which correspond to the two minima in the energy landscape of the molecule, see inset of fig. 2 in the main text.

We now consider the dynamic-loading set up. As in the main text, the force applied changes as a function of time as , where is the end-to end length of the molecule at time , while and are the stiffness and the center of the external potential, respectively. We take the values pN/nm, and nm/(MC step). We find that the molecule unfolds exhibiting a peak in the force-elongation curve, at pN, in very good agreement with ref. Liphardt et al (2001).
1GRZ
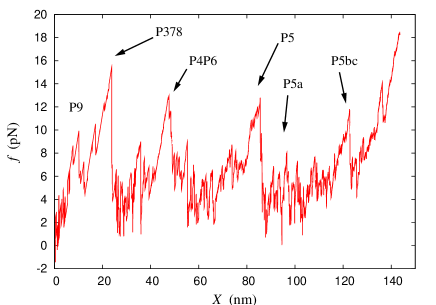
As stated in the main text, in the present RNA model, bases and are considered to be in contact if at least two atoms, one from each base, are closer than Å. We now study the possible effects of the threshold on the unfolding pathway, and in particular on the force-elongation curve.
We consider the values Å, and run unfolding simulations as those described in the main text. Typical trajectories are plotted in fig. A.11: inspection of these figures suggests that increasing has no net effect on the unfolding pathway, the typical unfolding sequence being that of fig. 5 in the main text. For however, the peaks in the force-extension curve appear to be flattened out, as one would expect, because of the reduced number and intensity of contact interactions.